Role of internal variability in recent decadal to multidecadal tropical Paci fi c climate changes
Mohammad Hadi Bordbar1,2 , Thomas Martin1 , Mojib Latif1,3 , and Wonsun Park1
1GEOMAR Helmholtz Centre for Ocean Research Kiel, Kiel, Germany,2Physics Department, University of Isfahan, Isfahan, Iran,3Cluster of Excellence“The Future Ocean”, Kiel University, Kiel, Germany
Abstract
While the Earth’s surface has considerably warmed over the past two decades, the tropical Pacific has featured a cooling of sea surface temperatures in its eastern and central parts, which went along with an unprecedented strengthening of the equatorial trade winds, the surface component of the Pacific Walker Circulation (PWC). Previous studies show that this decadal trend in the trade winds is generally beyond the range of decadal trends simulated by climate models when forced by historical radiative forcing. There is still a debate on the origin of and the potential role that internal variability may have played in the recent decadal surface wind trend. Using a number of long control (unforced) integrations of global climate models and several observational data sets, we address the question as to whether the recent decadal to multidecadal trends are robustly classified as an unusual event or the persistent response to external forcing. The observed trends in the tropical Pacific surface climate are still within the range of the long-term internal variability spanned by the models but represent an extreme realization of this variability.Thus, the recent observed decadal trends in the tropical Pacific, though highly unusual, could be of natural origin. We note that the long-term trends in the selected PWC indices exhibit a large observational uncertainty, even hindering definitive statements about the sign of the trends.
Plain Language Summary
While the Earth’s surface has considerably warmed over the past two decades, the tropical Pacific has featured a cooling of sea surface temperatures in its eastern and central parts, which went along with an unprecedented strengthening of the equatorial trade winds. Here we show that climate models simulate a high level of internal variability, so that the recent changes in the tropical Pacific could still be due to natural processes.1. Introduction
An important element of atmosphere-ocean interactions in the tropical Pacific region is the Pacific Walker Circulation (PWC), consisting of upward deep convective motion over the maritime continent and descend- ing motion over the eastern tropical Pacific [Bjerknes, 1969]. PWC strength controls the air-sea heat exchange over the tropical and subtropical Pacific. In turn, it affects the heat budget of the global climate system [Kosaka and Xie, 2013;England et al., 2014]. For example, the recent hiatus in the globally averaged surface air temperature has been attributed to acceleration of the PWC and concurrent cooling of the eastern and central tropical Pacific [Kosaka and Xie, 2013;De Boisséson et al., 2014;England et al., 2014;McGregor et al., 2014;Douville et al., 2015]. Causality, however, remains unclear. Much effort has been devoted to understand decadal climate variability in the tropical Pacific sector. However, no consensus has been achieved yet about the origin of tropical Pacific decadal variability, specifically the relative roles of long-term internal variability and external forcing [Latif and Keenlyside, 2011].Vecchi et al.[2006] analyzed tropical Pacific zonal sea level pressure (SLP) and sea surface temperature (SST) contrasts, hereafter termedΔSLP andΔSST, both indirect measures of PWC strength, from a coupled general circulation model and reanalysis data. Theirfindings sug- gested significant slowdown of the PWC in response to global warming, a result supported by many other climate models [Deser et al., 2010;Gastineau and Soden, 2011;Tokinaga et al., 2012;Bellomo and Clement, 2015]. In contrast, observational data during the most recent decades and a few climate model simulations are in conflict with the above results [Meng et al., 2011;L’Heureux et al., 2013;Sandeep et al., 2014;Latif et al., 2015].
Significant interannual to multidecadal variabilities in the tropical Pacific sector have been documented [Zhang et al., 1997;Newman et al., 2003;DiNezio et al., 2013;De Boisséson et al., 2014;Sandeep et al., 2014].
On the interannual time scale, variability of the PWC is well understood and strongly linked to the El Niño–
Geophysical Research Letters
RESEARCH LETTER
10.1002/2016GL072355
Key Points:
•Pacific Walker Circulation strongly varies internally
•Anthropogenic signals in the tropical Pacific sector are hard to detect
•There is large model uncertainty about the future of the Pacific Walker Circulation
Supporting Information:
•Supporting Information S1
•Figure S1
•Figure S2
•Figure S3
•Figure S4
Correspondence to:
M. Latif, mlatif@geomar.de
Citation:
Bordbar, M. H., T. Martin, M. Latif, and W. Park (2017), Role of internal variability in recent decadal to multidecadal tropical Pacific climate changes,Geophys. Res. Lett.,44, doi:10.1002/2016GL072355.
Received 15 JAN 2017 Accepted 2 APR 2017
Accepted article online 5 APR 2017
©2017. American Geophysical Union.
All Rights Reserved.
Southern Oscillation (ENSO) accounting for much of the PWC variability [Zhang et al., 1997;Newman et al., 2003;Sandeep et al., 2014;Chen and Wallace, 2015]. On the decadal to multidecadal time scales, however, other mechanisms may come into play.Newman et al.[2003] showed a link between the Pacific Decadal Oscillation (PDO) and equatorial SST through an atmospheric bridge, a point of view supported by other stu- dies [Shakun and Shaman, 2009; Meehl et al., 2013;Sandeep et al., 2014]. Thus, the Interdecadal Pacific Oscillation (IPO), which can be viewed as the basin-wide manifestation of the PDO, also has the potential to impact the PWC [England et al., 2014]. In fact, the unprecedented recent acceleration of the equatorial Pacific trade winds and the associated stronger zonal SST and sea surface height contrasts across the equa- torial Pacific can be primarily attributed to the IPO phase transition in the late 1990s [Merrifield, 2011;Kosaka and Xie, 2013;England et al., 2014;De Boisséson et al., 2014;Delworth et al., 2015]. Regarding the origin of the Pacific long-term internal variability,Dommenget and Latif[2008] introduced the concept of a hyper mode and argued that such variability can simply be generated through the integration of stochastic surface heat flux variability by the ocean mixed layer. The existence of long-term variability introduces a large uncertainty in projections of tropical Pacific sector climate [Meng et al., 2011;Bordbar et al., 2015].
Climate model simulations employing observed historical radiative forcing hardly capture the recent decadal changes observed in the tropical Pacific region [England et al., 2014;De Boisséson et al., 2014;McGregor et al., 2014;Kociuba and Power, 2015;Delworth et al., 2015]. It is still controversial as to whether this failure could be ascribed to the underestimated level of internal variability in the models, unrealistic phase of climate cycles in the models, too low model sensitivity to external forcing, unknown and/or erroneous external radiative forcing, or observational errors.
The purpose of this study is to investigate the role that internal long-term variability may have played in the aforementioned decadal time scale changes and, most importantly, the question if they are still within the range of internal variability spanned by climate models. For this purpose, we analyze a large number of long control integrations of current generation climate models and compare simulated with observed trends.
2. Data and Methods
Several control runs with preindustrial CO2 concentration (280 ppm) from the Coupled Model Intercomparison Project Phase 5 (CMIP5; Table S1 in the supporting information) are investigated here [Taylor et al., 2012] (http://pcmdi//llnl.gov). The majority of models were integrated longer than 500 years, sufficiently long to estimate variability at decadal and multidecadal time scales (Table S1). To examine the influence of enhanced atmospheric CO2 on the long-term internal variability, two multimillennial control integrations (each 3500 years long) of the Kiel Climate Model (KCM) [Park et al., 2009] are ana- lyzed, one employing preindustrial and the other“present-day”(348 ppm) CO2concentration. These pre- industrial and present-day control runs are labeled KCM-W07 and KCM-W04, respectively. Additionally, a number of CMIP5 models employing historical radiative forcing are analyzed (Table S1). We also utilize different observational estimates from different sources (Text S1 in the supporting information).
The linear trend has been removed from all control runs to reduce the impacts of spurious long-term model drift. Removing a quadratic function instead of the linear trend does not significantly change the results [see alsoSen Gupta et al., 2013].
As in previous studies [Vecchi et al., 2006;Meng et al., 2011], the zonal contrastsΔSLP andΔSST across the tropical Pacific are computed as measures of the PWC strength (Text S2).
To compare model trends with observed trends, we calculate 20 year and 50 year linear trends ofΔSST and ΔSLP over the entire period of the control runs and reanalysis data sets by applying moving windows to the annual mean time series. We apply the commonly used nonparametric Mann-Kendall test [Pettitt, 1979] to examine the significance level of the trend (Text S3). The distribution of the running trends is computed and displayed in Box-and-Whisker diagrams (Text S4).
3. Results
The most extreme 20 year, 50 year, and 100 year trends inΔSLP andΔSST simulated in the control runs are compared with estimates of the most recent observed trends (Figure 1). The observed 20 year trends inΔSLP andΔSST during 1994–2013 obtained from the different reconstructions (Figure 1b) are very similar and
Geophysical Research Letters
10.1002/2016GL072355positive, suggesting enhancement of the PWC and positive ocean-atmosphere feedback. The extrema in the model trends are rather symmetric (Figures 1a and 1b), such that those models with large (small) positive trends also exhibit large (small) negative trends, but the magnitude of extreme trends varies remarkably among the models.
Large year-to-year variability dominates the time series of observedΔSLP andΔSST (Figure S1 in the support- ing information), which is primarily due to ENSO. For example, the strong El Niño event of 1997–1998 and the strong La Niña event of 1998–1999 noticeably alter the 20 year trends inΔSLP andΔSST (Figure 2). In fact, the observed 20 year trend estimates, which depict only little spread, are not statistically different from zero at the 95% significance level. Further, these trends are within the range of internal variability spanned by the majority of the climate models (Figure 1b). For each model, the likelihood of 20 year linear trend inΔSST andΔSLP being greater than that obtained from the different observational data is computed (Tables S3 Figure 1.Largest (left column) negative and (right column) positive (a and b) 20 year, (c and d) 50 year, and (e and f) 100 year linear trends in zonal SST (°C/decade) and SLP (hPa/decade) contrast across the equatorial Pacific computed from several multimodel control. In the right column, the dashed (solid) lines parallel toyaxis (xaxis) indicate the observed trends in the zonal SST (SLP) contrasts ending in 2013. ObservationalΔSST trends are estimated from HadISST [Rayner et al., 2003], ERSSTv3b [Smith et al., 2008], ERSSTv4 [Huang et al., 2015], KaplanSST [Kaplan et al., 1998] and CobeSST [Ishii et al., 2005], andΔSLP trends from NCEP/NCAR [Trenberth and Paolino, 1980], 20CRv2 [Compo et al., 2011], ICOADS, and HadSLP2 [Allan and Ansell, 2006] reanalysis (Figures 1b and 1d). The observed 20 year, 50 year, and 100 year trends are obtained from the periods corresponding to 1994–2013, 1964–2013, and 1914–2013, respectively. Please note that in Figure 1f,ΔSLP is estimated only from HadSLP2 and ICOADS. Positive and negative trends for each model are shown by the same symbol.
and S4). A large model spread is noticed, which indicates remarkable diversity in representing multidecadal variability of equatorial Pacific SST and SLP contrasts. Yet a number of models (8 out of 23) yield probabilities in excess of 5%, depending on the observational data set, but the likelihood is below 20% in all models for all data sets. We argue that the recent observed 20 year trends inΔSLP andΔSST could be due to internal climate variability but with rather low probability. The historical runs also yield rather low probabilities (Table S3 and S4).
The observed 50 year trends inΔSLP andΔSST during 1964–2013 are also positive (Figure 1d), again suggest- ing strengthening of the PWC and consistent positive ocean-atmosphere feedback. However, the spread is rather large, especially with regard to theΔSLP trend (Figure 2). TheΔSLP trends are statistically significant at the 95% level only in the National Centers for Environmental Prediction (NCEP) SLP and the Hadley Centre Sea Level Pressure data set 2 (HadSLP2) (Table S2). The observed 50 year trend inΔSLP estimated from International Comprehensive Ocean-Atmosphere Data Set (ICOADS) amounting to about 0.05 hPa/decade is small and well within the range of the models’internal variability (Figures 1d and 2d). The trend obtained from NCEP National Center for Atmospheric Research (NCAR) and HadSLP2 amounting to about 0.18 hPa/
decade is at the high end of the largest model trends. Such a trend can thus be regarded as an extreme rea- lization of internal variability. We note that the 50 year trend inΔSLP might be overestimated due to biases in the reconstructed data [Wu and Kinter, 2003;DiNezio et al., 2013]. Given the large observational uncertainties (Figure 2), it remains debatable as to whether the recent 50 years have seen an unusualΔSLP trend at all.
The observational uncertainty in the 50 year trends ofΔSST during 1964–2013 is large too (Figure 2c), with Hadley Centre Sea Ice and Sea Surface Temperature data set (HadISST) depicting a much larger trend Figure 2.Time series of (a and b) 20 year, (c and d) 50 year, and (e and f) 100 year running trends in the observed (left column)ΔSST (°C/decade) and (right column) ΔSLP (hPa/decade). The trend is computed 1 year apart from each other. The time refers to the last year of each running block trend. TheΔSST is derived from HadISST, Kaplan, ERSSTV3, ERSSTV4, and CobeSST reanalysis, whereas theΔSLP is based on NCEP-NCAR, 20CRV2, HadSLP2, and ICOADS.
Geophysical Research Letters
10.1002/2016GL072355estimate than the other SST data sets. However, the sign is robust, which is relevant in the context of the ongoing discussion about theΔSST response to global warming [Clement et al., 1996;Sandeep et al., 2014].
When excluding HadISST, wefind that the remaining observational estimates of the 50 year trend inΔSST are well within the range of the internal variability spanned by the models (Figure 1d). Only a limited number of models simulate the 50 year trends ofΔSST that are consistent with HadISST. The likelihood of simulating 50 year trends inΔSST being consistent with the observational estimates again strongly differs from model to model (Tables S5 and S6).
We next consider the centennial trends inΔSLP andΔSST (Figures 1e and 1f and 2e and 2f). Twentieth cen- tury trend in the PWC obtained from 20CRV2 is not in good agreement with the available station data [Compo et al., 2011] (Figure 2f). Here the centennial trend inΔSLP is estimated only from HadSLP2 and ICOADS.
However, these trends are not statistically significant at 95% level (Table S2) and different in sign. Further, they are small and well within the range of the internal variability provided by the models. In addition, differ- ent centennial periods yield different trend signs and magnitudes (Figure 2f). For example, HadSLP depicts a centennial reduction over the 20th century, which is consistent with the results of previous studies [Vecchi et al., 2006;Deser et al., 2010]. When using the last 100 years of the same data set, the sign of the trend reverses (Figure 2f). Our analysis suggests that there is no significant centennial trend in ΔSLP and thus PWC, to the extent thatΔSLP well represents PWC strength. Observational estimates of centennial trends inΔSST are also subject to a large uncertainty (Figure 2f). All estimates ofΔSST presented here are positive and in the range of the long-term internal variability simulated by the models, with HadISST providing the largest centennial trend (Figure 2e).
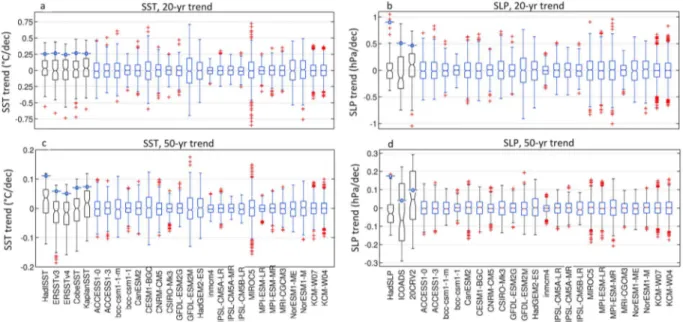
Figure 3 depicts the Box-and-Whisker diagrams of the running trends, in which each box spans the interquar- tile range (IQR). Regarding the 20 year trends inΔSST (Figure 3a), the observational estimates depict a rather symmetric distribution in which the medians are not significantly different from zero. The IQR of the 20 year trend in HadISST amounting to 0.227°C/decade is the smallest of all observational estimates (Table S7). The trend in the period 1994–2013 lies within the confidence interval in each observational data set.
The IQR varies noticeably among the models, with the smallest (largest) value in inmcm4 (Geophysical Fluid Dynamics Laboratory ESM2M) amounting to 0.097 (0.387) °C/decade (Table S7). The recently observed 20 year trend inΔSST, with estimates ranging between about 0.2°C/decade and 0.3°C/decade, is within the range of variability of several models (9 out of 23), suggesting that it could be entirely driven by internal variability.
Figure 3.The boxplots representing median and interquartile range (IQR) of (a and b) 20 year and (c and d) 50 year trends in the zonal SST (Figures 3a and 3c) and SLP (Figures 3b and 3d) contrast across the equatorial Pacific obtained from different reanalysis data sets and several control runs. The bottom and top of the boxes are thefirst and the third quartiles, respectively. The bands inside the boxes represent the medians. Whiskers indicate 99% confidence limits. The red crosses indicate the extreme trends defined as the trends exceeding the confidence limits. The black bars to the left of each panel are obtained from observations. The blue bars are derived from control runs. The blue markers in the observational bars are referred to the trends in 1994–2013 (Figures 3a and 3b) and 1964–2013 (Figures 3c and 3d).
Further, the likelihood of the occurrence of a trend larger than that observed during the last two decades is larger than zero in a number of models (14 out of 23; Table S3), but the average likelihood is small.
With respect to the 20 year trend inΔSLP, the results from the different observational data sets are inconsis- tent with each other (Figure 3b). HadSLP does not depict a noticeable tendency toward either positive or negative values, whereas ICOADS (20CRV2) tends to have more periods with negative (positive) trends, meaning deceleration (intensification) of the PWC. In addition, extreme events exceeding the 99% confi- dence interval are evident in both the observations and models. Finally, we note that with regard to the 20 year trends in bothΔSLP and ΔSST the IQR is smaller in most climate models in comparison to the observations. The observations contain external forcing which, by definition, is excluded in the control inte- grations of the models. Overall, the aforementioned probability distributions obtained from the historical runs (Figure S2 and Tables S3 and S4) depict similar characteristics as the unforced control runs, which pro- vides evidence for the dominant role of internal variability.
The observational uncertainty becomes even larger when considering the 50 year trends inΔSST (Figure 3c).
The medians from Kaplan and HadISST are opposite in sign compared to those obtained from the ERSST ver- sions. Apart from HadISST, the 50 year trends inΔSST are within the 99% confidence intervals calculated from all data sets and several models (11 out of 23). The IQR amounting to typically 0.075°C/decade does not strongly vary among the observational estimates, and it is larger than the IQRs calculated from all models which typically depict a value of about 0.050°C/decade (Table S7). Likewise, the 50 yearΔSLP trends suggest that there is not much agreement among the observational data sets in terms of the IQR values (Figure 3d and Table S7). The chance of any individual trend being positive (negative) is more (less) likely in 20CRV2 in comparison to ICOADS and HadSLP. Again, the IQR values from the models are smaller than those from the observational data sets. The recent 50 year trends inΔSLP derived from ICOADS are well captured by the multimodel ensemble (Table S6).
The magnitude of the extreme trends at the three time scales and the level of internal variability in the KCM
“present-day”control run, termed KCM-W04, are only marginally different from those derived from the KCM preindustrial control run, termed KCM-W07 (Figures 1 and 3). This suggests that today’s higher atmospheric CO2content relative to preindustrial levels may not strongly impact the level of long-term internal variability in climate models.
During the period 1994–2013 a pronounced cooling, with a horseshoe-type pattern and off-equatorial max- ima, was observed in the eastern and central Pacific, whereas a warming was observed in the western tropical Pacific (color shading, Figures 4a and 4b). This SST trend pattern was associated with anomalously high SLP over the eastern and anomalously low SLP over the western Pacific (contours, Figures 4a and 4b) and a pro- nounced amplification of the westward trade winds over the western and central tropical Pacific (arrows, Figures 4a and 4b). We investigate the patterns of SST, SLP, and wind stress associated with the most extreme 20 year trends inΔSST simulated in the preindustrial control integrations of the KCM and selected CMIP5 models from which wind stress was available at the time of analysis. The 20 year SST trend patterns share some similarities with those observed over the recent decades (Figures 4c–4j), and the pattern correlations exceed 0.50 in several models (five out of eight; Table S8). The cooling over the central and eastern tropical Pacific is not statistically significant, neither in the observations nor in the models, supporting the notion that the observed 20 year SST trends can be explained by internal variability.
The SST trends, which are shown for two SST analyses in the top panels (Figures 4a and 4b), are symmetric about the equator and reminiscent of the trends observed when the climate system shifts from the positive to the negative phase of the IPO [Zhang et al., 1997;Meehl et al., 2013;England et al., 2014;Chen and Wallace, 2015]. However, amplitude and structure of the SST trends considerably differ among the models; but in all models, the strongest cooling is located in the central equatorial Pacific and extends into the eastern equa- torial Pacific, consistent with an amplification of wind-driven Ekman divergence and equatorial upwelling [England et al., 2014]. In the same way, the general picture of the decadal trend in the period 1969–1988, when the trend in theΔSST is negative, is that of a La Niña-like pattern and also reproduced reasonably well by the models (Figure S3). This structure brings to mind the positive phase of the IPO [England et al., 2014].
The most important difference between the model and observed SST trend estimates during 1994–2013 is seen over the Indian Ocean. The simulated trends generally are not statistically significant and depict cooling over large regions of the Indian Ocean, whereas the observations indicate basin-wide warming that is
Geophysical Research Letters
10.1002/2016GL072355statistically significant at the 95% level. The latter could be due to the relatively low level of internal variability compared to the tropical Pacific [Luo et al., 2012;Lee et al., 2015]. The Indian Ocean warming may have stimulated enhanced trade winds over the Pacific through deepening pressure over the Indian Ocean and Maritime Continent, as suggested by, e.g.,Meng et al.[2011] andLuo et al.[2012]. The difference to observations in the Indian Ocean may be due to external forcing, specifically enhanced atmospheric greenhouse gas concentrations, which is not considered in the control integrations. Further research is required to isolate the contribution of Indian Ocean warming in recent strengthening of the trade winds.
The observed SST trend pattern during 1964–2013, which is shown for two SST analyses in the top panels (Figures 5a and 5b) and in which the globally averaged SST trend has been subtracted at each grid point to damp the effects of global warming, depicts cooling over most of the tropical Pacific but details signifi- cantly differ between the two data sets. However, the cooling trend is not statistically significant at the 95% level. There is enhanced SLP over the central tropical Pacific, a strengthening of the trade winds over Figure 4.Twenty-year linear trends in observed and simulated SSTs (shading, °C/decade), SLP (contours, hPa/decade), and wind stress (vectors, Pa/decade). (a and b) The SST trends are shown together with trends of SLP and wind stress from NCEP/NCAR [Kalnay et al., 1996] during 1994–2013. SST trends in Figures 4a and 4b are obtained from ERSSTv4 and HadISST, respectively. Twenty-year trends associated with the largest positive trend inΔSST in the models (Figures 4c–4j). Hatching shows where the SST trends are significant at 95% confidence. In each panel, positive (negative) values are denoted by solid (dashed) lines. The arrow in the top-left corner of each panel denotes a 0.004 Pa/decade change in the wind stress. The globally averaged SST trend in 1994–2013 is subtracted from each grid point in Figures 4a and 4b.
the western and weakening over the eastern tropical Pacific (Figures 5a and 5b). The anomaly fields associated with the strongest positive 50 year trends inΔSST obtained from the models (Figures 5c–5j) are consistent with the observations in the Pacific but not in the Indian Ocean. The pattern correlations are small (Table S9). Strengthening of the trade winds is evident in all models but with varying magnitude. The models also simulate opposite 50 year trends inΔSST with similar magnitude and weaker trade winds (Figure S4).
4. Conclusions
A high level of internal decadal to multidecadal variability of the tropical Pacific atmosphere-ocean system, specifically of the Pacific Walker Circulation (PWC), is simulated by a number of climate models. We show that a clear picture of PWC long-term trends could not be reliably defined from the available observational and reanalysis data sets. Hence, we suggest using multiple observational estimates in evaluating climate Figure 5.Fifty-year linear trends in observed and simulated SSTs (shading, °C/decade), SLP (contours, hPa/decade), and wind stress (vectors, Pa/decade). (a and b) The SST trends are shown together with trends of SLP and wind stress from NCEP/NCAR during 1964–2013. SST trends in Figures 5a and 5b are obtained from ERSSTv4 and HadISST, respectively. Fifty-year trends associated with the largest positive trend inΔSST in the models (Figures 5c–5j). Hatching indicates where the SST trends are significant at the 95% confidence level. In each panel, positive (negative) values are denoted by solid (dashed) lines. The arrow in the top-left corner of each panel denotes a 0.002 Pa/decade change in the wind stress. The globally averaged SST trend in 1964–2013 is subtracted from each grid point in Figures 5a and 5b.
Geophysical Research Letters
10.1002/2016GL072355models and quantifying the climate impact of external forcing. The most recent observed decadal trends in the PWC, as measured by the zonal contrasts in SLP and SST,ΔSLP andΔSST, are still within the range of long- term internal variability spanned by the climate models, but the trends, if reliable, would reflect an extreme realization of internal decadal variability. Moreover, the spatial anomaly patterns of SST, SLP, and wind stress in the tropical Pacific, linked to extreme decadalΔSST trends in the models, are in reasonably good agree- ment with the observed trend patterns. Thus, the recent decadal time scale changes in the tropical Pacific could be due to internal variability alone. This is also supported by historical runs employing observed forcing 1850–2005, which yield very similar results as the control runs.
For example, the likelihood of an SST gradient being more extreme than the recent 20 year trend is lar- ger than 7% in seven of the analyzed control runs, while it is a very rare event in the other 16 models.
We also note a large sensitivity of the probabilities to the choice of the observational data sets. Similar results are found for the recent 50 year trends. The probabilities, in general, are relatively small, so that external forcing likely played an important role at both time scales. With regard to 100 year trends the observational uncertainty is so large, inhibiting a meaningful model assessment. In any case, the large long-term internal variability simulated by the models implies a large uncertainty in projecting the future PWC and associated teleconnections.
References
Allan, R., and T. Ansell (2006), A new globally complete monthly historical gridded mean sea level pressure dataset (HadSLP2), 1850–2004, J. Clim.,19, 5816–5842.
Bellomo, K., and A. C. Clement (2015), Evidence for weakening of the Walker Circulation from cloud observations,Geophys. Res. Lett.,42, 7758–7766, doi:10.1002/2015GL065463.
Berrisford, P., et al. (2011), The ERA-Interim archive, version 2.0,ERA Rep. Ser. 1. Tech. Rep. ECMWF, 23 pp.
Bjerknes, J. (1969), Atmospheric teleconnections from the equatorial Pacific,J. Phys. Oceanogr.,97(3), 163–172.
Bordbar, M. H., T. Martin, M. Latif, and W. Park (2015), Effects of long-term variability on projections of twenty-first-century dynamic sea level, Nat. Clim. Change,5, 343–347.
Chen, X., and J. M. Wallace (2015), ENSO-like variability: 1900–2013,J. Atmos. Sci.,28(24), 9623–9641.
Clement, A. C., R. Seager, M. A. Cane, and S. E. Zebiak (1996), An ocean dynamical thermostad,J. Clim.,9, 2190–2196.
Compo, G. P., et al. (2011), The twentieth century reanalysis project,Q. J. R. Meteorol. Soc.,137, 1–28.
De Boisséson, E., M. A. Balmaseda, S. Abdalla, E. Källén, and P. A. E. M. Janssen (2014), How robust is the recent strengthening of the tropical Pacific trade winds?,Geophys. Res. Lett.,41, 4398–4405, doi:10.1002/2014GL060257.
Delworth, T. L., F. Zeng, A. Rosati, G. A. Vecchi, and A. T. Wittenberg (2015), A link between the hiatus in global warming and North American Drough,J. Clim.,28, 3834–3845.
Deser, C., A. S. Phillips, and M. A. Alexander (2010), Twentieth century tropical sea surface temperature trends revisited,Geophys. Res. Lett.,37, L10701, doi:10.1029/2010GL043321.
DiNezio, P. N., G. A. Vecchi, and A. C. Clement (2013), Detectability of changes in the Walker Circulation in response to global warming, J. Clim.,26, 4038–4048.
Dommenget, D., and M. Latif (2008), Generation of hyper climate mode,Geophys. Res. Lett.,35, L02707, doi:10.1029/2007GL03187.
Douville, H., A. Voldoire, and O. Geoffroy (2015), The recent global warming hiatus: What is the role of Pacific variability?,Geophys. Res. Lett., 42, 880–888, doi:10.1002/2014GL062775.
England, M. H., S. McGregor, P. Spence, G. A. Meehl, A. Timmermann, W. Cai, A. Sen Gupta, M. J. McPhaden, A. Purich, and A. Santoso (2014), Recent intensification of wind-driven circulation in the Pacific and the ongoing warming hiatus,Nat. Clim. Change,4(3), 222–227.
Gastineau, G., and B. J. Soden (2011), Evidence for a weakening of tropical surface wind extremes in response to atmospheric warming, Geophys. Res. Lett.,38, L09706, doi:10.1029/2011GL047138.
Huang, B., V. F. Banzon, E. Freeman, J. Lawrimore, W. Liu, T. C. Peterson, T. M. Smith, P. W. Thorne, S. D. Woodruff, and H.-M. Zhang (2015), Extended reconstructed sea surface temperature version 4 (ERSST.v4): Part I, upgrades and intercomparisons,J. Clim.,28, 911–930.
Ishii, M., A. Shouji, S. Sugimoto, and T. Matsumoto (2005), Objective analyses of sea-surface temperature and marine meteorological variables for the 20th century using ICOADS and the Kobe collection,Int. J. Climatol.,25, 865–879.
Kalnay, E., et al. (1996), The NCEP/NCAR 40-year reanalysis project,Bull. Am. Meteorol. Soc.,77, 437–470.
Kaplan, A., M. A. Cane, Y. Kushnir, A. C. Clement, M. B. Blumenthal, and B. Rajagopalan (1998), Analyses of global sea surface temperature 1856–1991,Geophys. Res. Lett.,103, 18,567–18,589, doi:10.1029/97JC01736.
Kociuba, G., and S. B. Power (2015), Inability of CMIP5 models to simulate recent strengthening of the Walker Circulation: Implications for projections,J. Clim.,28(1), 20–35.
Kosaka, Y., and S. P. Xie (2013), Recent global-warming hiatus tied to equatorial Pacific surface cooling,Nature,501, 403–407.
Latif, M., and N. S. Keenlyside (2011), A perspective on decadal climate variability and predictability,Deep Sea Res., Part II,58, 1880–1894.
Latif, M., V. A. Semenov, and W. Park (2015), Super El Niños in response to global warming, in a climate model,Clim. Change,132, 489–500.
Lee, S. K., W. Park, M. O. Baringer, A. L. Gordon, B. Huber, and Y. Liu (2015), Pacific origin of the abrupt increase in Indian Ocean heat content during the warming hiatus,Nat. Geosci.,8, 445–449.
L’Heureux, M. L., S. Lee, and B. Lyon (2013), Recent multidecadal strengthening of the Walker Circulation across the tropical Pacific,Nat. Clim.
Change,3(4), 1–6.
Luo, J. J., W. Sasaki, and Y. Masumoto (2012), Indian Ocean warming modulates Pacific climate change,Proc. Natl. Acad. Sci. U.S.A.,109, 18,701–18,706.
McGregor, S., A. Timmermann, M. F. Stuecker, M. H. England, M. Merrifield, F.-F. Jin, and Y. Chikamoto (2014), Recent Walker Circulation strengthening and Pacific cooling amplified by Atlantic warming,Nat. Clim. Change,4(10), 888–892.
Acknowledgments
This work was supported by the European Union’s PREFACE project (FP7/2007–2013, 603521) and the SPACES/SACCUS (03G0837A) and RACE II projects of BMBF (grant agreement 03F0729C). We acknowledge the World Climate Research Program’s Working Group on Coupled Modeling, which is responsible for CMIP, and we thank the climate modeling groups (listed in Table S1; http://pcmdi//llnl.gov) for producing and making available their model output. For CMIP the U.S.
Department of Energy’s Program for Climate Model Diagnosis and Intercomparison provides coordinating support and led development of soft- ware infrastructure in partnership with the Global Organization for Earth System Science Portals. Observational data sets employed in this study are provided by the NOAA/OAR/ESRL/PSD, Boulder, Colorado (http://www.esrl.
noaa.gov/psd/). KCM data used in this study are available by e-mail from the corresponding author (mlatif@geomar.
de).This is a contribution to the Excellence Cluster“Future Ocean.”
Meehl, G., A. Hu, J. M. Arblaster, J. Fasullo, and K. E. Trenberth (2013), Externally forced and internally generated decadal climate variability associated with the Interdecadal Pacific Oscillation,J. Clim.,26(18), 7298–7310.
Meng, Q., M. Latif, W. Park, N. S. Keenlyside, V. A. Semenov, and T. Martin (2011), Twentieth century Walker Circulation change: Data analysis and model experiments,Clim. Dyn.,38(9–10), 1757–1773.
Merrifield, M. A. (2011), A shift in western tropical Pacific sea level trends during the 1990s,J. Clim.,24, 4126–4138.
Newman, M., G. P. Compo, and M. A. Alexander (2003), ENSO-forced variability of the Pacific Decadal Oscillation,J. Clim.,16, 3853–3857.
Park, W., N. Keenlyside, M. Latif, A. Ströh, R. Redler, E. Roeckner, and G. Madec (2009), Tropical Pacific climate and its response to global warming in the Kiel climate model,J. Clim.,22, 71–92.
Pettitt, A. N. (1979), A non-parametric approach to the change-point problem,Appl. Stat.,28, 126–135.
Rayner, N. A., D. E. Parker, E. B. Horton, C. K. Folland, L. V. Alexander, D. P. Rowell, E. C. Kent, and A. Kaplan (2003), Global analyses of sea surface temperature, sea ice, and night marine air temperature since the late nineteenth century,Geophys. Res. Lett.,108(D14), 4407, doi:10.1029/
2002JD002670.
Sandeep, S., F. Stordal, P. D. Sardeshmukh, and G. P. Compo (2014), Pacific Walker Circulation variability in coupled and uncoupled climate models,Clim. Dyn.,43, 103–117.
Sen Gupta, A., N. C. Jourdain, J. N. Brown, and D. Monselesan (2013), Climate drift in CMIP5 models,J. Clim.,26, 8597–8615.
Shakun, J. D., and J. Shaman (2009), Tropical origins of North and South Pacific decadal variability,Geophys. Res. Lett.,36, L19711, doi:10.1029/
2009GL040313.
Smith, T. M., R. W. Reynolds, T. C. Peterson, and J. Lawrimore (2008), Improvements to NOAA’s historical merged land-ocean surface temperature analysis (1880–2006),J. Clim.,21(10), 2283–2296.
Taylor, K. E., R. J. Stouffer, and G. A. Meehl (2012), An overview of CMIP5 and the experiment design,Bull. Am. Meteorol. Soc.,93, 485–498.
Tokinaga, H., S. P. Xie, C. Deser, Y. Kosaka, and Y. M. Okumura (2012), Slowdown of the Walker Circulation driven by tropical Indo-Pacific warming,Nature,491(7424), 439–443.
Vecchi, G. A., B. J. Soden, A. T. Wittenberg, I. M. Held, A. Leetmaa, and M. J. Harrison (2006), Weakening of tropical Pacific atmospheric circulation due to anthropogenic forcing,Nature,441(7089), 73–76.
Trenberth, K. E., and D. A. Paolino (1980), The Northern Hemisphere sea-level pressure data set: Trends, errors and discontinuities, Mon. Weather Rev.,108, 855–872.
Wu, R., and J. N. Kinter (2003), Discrepancy of interdecadal changes in the Asian region among the NCEP-NCAR reanalysis, objective analyses, and observations,J. Clim.,18, 3048–3067.
Zhang, Y., J. M. Wallace, and D. S. Battisti (1997), ENSO-like interdecadal variability: 1900–93,J. Clim.,10, 1004–1020.