Southern Ocean biological impacts on global ocean oxygen
David P. Keller1, Iris Kriest1, Wolfgang Koeve1, and Andreas Oschlies1
1GEOMAR Helmholtz-Zentrum für Ozeanforschung Kiel, Kiel, Germany
Abstract
Southern Ocean (SO) physical and biological processes are known to have a large impact on global biogeochemistry. However, the role that SO biology plays in determining ocean oxygen concentrations is not completely understood. These dynamics are investigated here by shutting off SO biology in two marine biogeochemical models. The results suggest that SO biological processes reduce the ocean’s oxygen content, mainly in the deep ocean, by 14 to 19%. However, since these processes also trap nutrients that would otherwise be transported northward to fuel productivity and subsequent organic matter export, consumption, and the accompanying oxygen consumption in midlatitude to low-latitude waters, SO biology helps to maintain higher oxygen concentrations in these subsurface waters. Thereby, SO biology can influence the size of the tropical oxygen minimum zones. As a result of ocean circulation the link between SO biological processes and remote oxygen changes operates on decadal to centennial time scales.1. Introduction
The Southern Ocean (SO) plays a key role in ocean circulation [Lumpkin and Speer, 2007;Iudicone et al., 2008]
and biogeochemical cycling [Sarmiento et al., 2004;Marinov et al., 2006;Palter et al., 2010;Iudicone et al., 2011;
Primeau et al., 2013] because it is a site of substantial water mass transformation, deep water formation, and interbasin exchange. Modeling studies have suggested that because of the global circulation connections in this region, the efficiency of SO organic matter export and remineralization has a global effect on the cycling of nutrients and thereby controls between 12.5 to 75% of the biological productivity and biogeochemical cycling in other regions of the ocean [Sarmiento et al., 2004;Marinov et al., 2006;Palter et al., 2010;DeVries et al., 2012]. Since the oxygen content of a water mass is dependent on where and when it was last in contact with the atmosphere and on the imprints of biological processes (mainly oxygen consumption) during the time elapsed since then, SO circulation and the magnitude of organic matter export and consumption would, thus, be expected to play a large role in determining the ocean’s oxygen distributions. However, as far as we are aware, detailed SO biological process-oriented studies on global oxygen cycling have not been conducted since the early modeling work ofSarmiento and Orr[1991], which was mainly focused on the effects of hypothetical iron fertilization. More recent studies of hypothetical iron fertilization have only cursorily described how changes in the magnitude of SO organic matter export and remineralization affect ocean oxygen [Jin and Gruber, 2003;Oschlies et al., 2010;Keller et al., 2014]. Given the recent interest in better understanding what controls ocean oxygen distributions and trends [Helm et al., 2011;Andrews et al., 2013]
and more specifically tropical oxygen minimum zone (OMZ) dynamics [Stramma et al., 2008;Deutsch et al., 2014;Duteil et al., 2014], we think that an evaluation of the impact of SO biological processes on global oxygen distributions is timely.
In this study we use an idealized modeling approach to investigate the role that SO biological processes play in global oxygen cycling. Our objectives are (1) to quantify the impact that current SO biological processes have on global ocean oxygen concentrations and (2) to demonstrate how past or future changes in SO biological processes may play a so far underappreciated role in remote (e.g.,>5000 km away), biogeochemi- cally important features such as tropical OMZs. In previous SO biogeochemical modeling studies, which have focused on carbon [Ito and Follows, 2005;Marinov et al., 2006, 2008], phosphorus [Ito and Follows, 2005;
DeVries et al., 2012;Holzer and Primeau, 2013;Primeau et al., 2013], nitrate, and silicic acid [Sarmiento et al., 2004] cycling, the biogeochemical dynamics have often been investigated by forcing rather simplistic biogeochemical models to simulate a nearly complete biological utilization of SO surface nutrients. While this idealized approach has proven to be quite useful, we have taken a different approach in this study and instead shut off SO biology because a SO nutrient drawdown approach is more difficult to achieve with more complex models such as the ones used here, e.g., it is not possible even if the maximum potential
Geophysical Research Letters
RESEARCH LETTER
10.1002/2016GL069630
Key Points:
•SO biological processes reduce the ocean’s oxygen content, mainly in the deep ocean, by 14 to 19%
•SO nutrient trapping maintains higher oxygen levels in midlatitude to low-latitude subsurface waters
•SO biological processes affect remote oxygen concentrations on decadal to centennial time scales
Supporting Information:
•Supporting Information S1
Correspondence to:
D. P. Keller, dkeller@geomar.de
Citation:
Keller, D. P., et al. (2016), Southern Ocean biological impacts on global ocean oxygen,Geophys. Res. Lett.,43, doi:10.1002/2016GL069630.
Received 19 MAY 2016 Accepted 8 JUN 2016
Accepted article online 10 JUN 2016
©2016. American Geophysical Union.
All Rights Reserved.
phytoplankton growth rate is set at very high values of up to 10 per day [Oschlies et al., 2010]. Moreover, by comparing this extreme case of minimum SO respiration against realistic present-day simulations, we can more easily quantify the role that SO biological processes play in global oxygen cycling. We also chose to conduct this study with more complex biogeochemical models because the use of a reduced complexity biogeochemical model (e.g., where production is parameterized to be proportional to euphotic layer phos- phate concentrations, or seasonality is not included) might miss some of the important dynamics that control primary productivity, organic matter export, remineralization, and oxygen consumption. The use of two models, which differ in circulation and biogeochemical detail, allow us to better determine the robustness of the results.
2. Methods
2.1. Model Descriptions
Thefirst model that we use is the 2.9 version of the University of Victoria Earth System Climate Model (UVic) [Weaver et al., 2001;Eby et al., 2013]. The model has three dynamically coupled main components that include a 3-D ocean general circulation model, a terrestrial model, and a one-layer atmospheric energy-moisture balance model. A dynamic-thermodynamic sea ice model is also included as a subcomponent of the ocean model. A common horizontal resolution of 1.8° latitude × 3.6° longitude is used for all components. The oceanic component uses the Modular Ocean Model (MOM) version 2.2 physical model [Pacanowski, 1995], which is in the configuration described byKeller et al.[2012], and has 19 vertical levels with thicknesses ranging from 50 m at the surface to 500 m in the deep ocean. The heat and waterfluxes to and from the ocean, land, and sea ice are interactively calculated with the atmospheric energy-moisture balance model.
The wind velocities used to calculate the surface heat, water, gasfluxes, physical momentum transfer to the ocean and sea ice models, and the advection of water vapor in the atmosphere are prescribed from National Center for Atmospheric Research/National Centers for Environmental Prediction monthly climatolo- gical wind data. The marine biogeochemical-ecosystem model [Schmittner et al., 2008;Keller et al., 2012]
includes two phytoplankton classes (nitrogen fixers and other phytoplankton), zooplankton, particulate detritus, nitrate (NO3), and tracers for oxygen (O2), phosphate (PO4), dissolved inorganic carbon, and alkalinity. The effects of iron limitation on marine primary productivity are also included using a dissolved iron masking approach. The dynamics of dissolved organic matter (DOM) cycling are not explicitly included. The model has been used in several marine biogeochemical studies, and its skill at simulating the present-day ocean is assessed inKeller et al.[2012].
Our second global model applies the transport matrix method [Khatiwala et al., 2005;Khatiwala, 2007] for tracer transport, using a transport matrix derived from the Estimating the Circulation and Climate of Ocean (ECCO) project [Stammer et al., 2004]. The physical framework has a horizontal resolution of 1° × 1° and a vertical resolution of 23 levels that range in thickness from 10 m at the surface to 500 m in the deep ocean.
The biogeochemical model is phosphorus-based and simulates nutrients (as phosphate), oxygen, phytoplank- ton, zooplankton, detritus, and dissolved organic phosphorus (DOP) [Kriest et al., 2012]. Phytoplankton iron lim- itation is not explicitly included. The model also includes a parameterization for benthic burial [Kriest and Oschlies, 2013], and in the following is referred to as ECCO-BUR. Its skill at simulating present-day ocean biogeo- chemistry has been assessed inKriest and Oschlies[2013].
The two models differ in both circulation and biogeochemical model components. The main physical model differences concern the resolution (ECCO-BUR has a higher vertical and horizontal resolution than UVic) and parameterizations of the physical models, Massachusetts Institute of Technology (MIT) (ECCO-BUR) versus MOM2 (UVic) used. For example, atmospheric forcing of the MIT (ECCO-BUR) model had beenflux adjusted through data assimilation to allow it to better simulate observed ocean circulation and hydrography [Stammer et al., 2004]. UVic combines a reanalysis product for external forcing and an atmospheric energy- moisture balance model to dynamically drive its ocean circulation. The main biogeochemical differences are as follows: (1) UVic is nitrogen-based; ECCO-BUR is phosphorous-based, (2) UVic has two types of phyto- plankton; ECCO-BUR has one, (3) phytoplankton in UVic can be limited by nitrate, phosphate, and iron; phy- toplankton in ECCO-BUR is only limited by phosphate, (4) detritus remineralization is temperature dependent in UVic and not in ECCO-BUR, and (5) ECCO-BUR includes semilabile DOP; UVic does not and only implicitly simulates labile DOM cycling. Despite these differences, the simulated biogeochemical tracer distributions
of both models agree with observations similarly well or better than other CMIP5 models, although both also show pro- nounced differences in their simulation of the Southern Ocean [Duteil et al., 2013].
2.2. Experiment
Control run and experimental simulations were conducted by initializing the models with either World Ocean Atlas 2009 data (UVic) or globally uniform values of PO4 and O2 (ECCO-BUR) and then running them until a seasonally varying steady state was reached (10,000 years for UVic;
9000 years for ECCO-BUR). The experimen- tal runs to investigate the role of the SO productivity, and organic matter export and consumption in determining global ocean oxygen distributions were con- ducted for each model by setting the growth rate of phytoplankton south of 40°S to zero, which effectively stopped all biological and detrital production and consumption in this region (Figures 1 and S1–S3 in the supporting information).
The effects on ocean oxygen of not having SO biology were then investigated by comparison with the control runs.
3. Results
3.1. Steady State Differences
When phytoplankton growth ceases in the SO both productivity and theflux and con- sumption of organic matter in the region stop (Figures 1 and S2). To the north of the SO, productivity and the flux and consumption of organic matter generally increase (Figures 1 and S1–S3) because nutrients, which are normally trapped in the SO or deep ocean by biophysical pro- cesses [Primeau et al., 2013], can now be physically transported (not shown) north- ward out of the SO region (Figure S4). At least some portion of these nutrients enters the euphotic zone in waters to the north of 40°S (Figure 1c) sup- porting biological production there. General patterns of biogeochemical tracers for the experiment are simi- lar for the two models (not shown), although the results do differ somewhat in a few regions, e.g., the Atlantic, due to the differences in model resolution and circulation, and just to the north of 40°S, which is a region where the UVic model has strong iron limitation [Keller et al., 2012] and the ECCO-BUR does not. As a conse- quence, unutilized phosphate in the ECCO-BUR simulations is consumed by phytoplankton and exported to depth mostly between 40° and 20°S, while in the UVic simulations it is transported farther northward before being utilized (Figure 1c). Overall, having no SO productivity leads to an increase in annual global net primary productivity (NPP) in the UVic model (+7 Pg C yr 1; a 13% increase) and a decrease in the ECCO-BUR model ( 4.6 Pg C yr 1; a 14% decrease). The difference in NPP is a result of a larger horizontal displacement of Figure 1.Steady state annual zonally averaged changes (experiment
minus control) in (a) depth-integrated net primary productivity (NPP) (b) particulate organic carbon export at 2000 m, and (c) surface phosphate (PO4) for the UVic (black dashed line) and the ECCO-BUR (grey dotted line) simulations.
unutilized nutrients in UVic (see above), in conjunction with more efficient recy- cling, particularly at higher temperatures in UVic. In both models the annual global flux of organic matter into the deep ocean (~2 km) decreases by 0.9 Pg C yr 1 when SO biology is shut off, which corre- sponds to a 22% decrease in UVic and a 20% decrease in ECCO-BUR. This rela- tively large overall global decrease in the deepflux of organic matter, despite an increase in NPP, occurs in UVic because the loss of the deep SO organic matterflux is not offset by higher produc- tivity and theflux of organic matter to the north of it when SO biology is shut off (Figures 1a, 1b, S1, and S3). There is no corresponding offset because the organic matter that is produced by any NPP increase north of the SO is more effi- ciently remineralized in the upper ocean and less efficiently transported to depth in midlatitude to low-latitude regions due to a combination of higher tempera- tures, stronger stratification, and circula- tion [Marinov et al., 2008; Levy et al., 2013]. Some of the increases in NPP also occur in waters shallower than 2000 m, and thus, any exported matter never reaches the deep ocean, i.e., essentially a topographic effect that affects the glo- bal means. These factors are why it is pos- sible to have higher overall NPP in UVic but a lower overallflux of organic matter into the deep ocean. The dynamics men- tioned above also apply to the ECCO-BUR model, with the exception of tempera- ture effects on remineralization and explain why there is a nonproportional decrease in global NPP and the flux of organic matter into the deep ocean when SO biology is shut off.
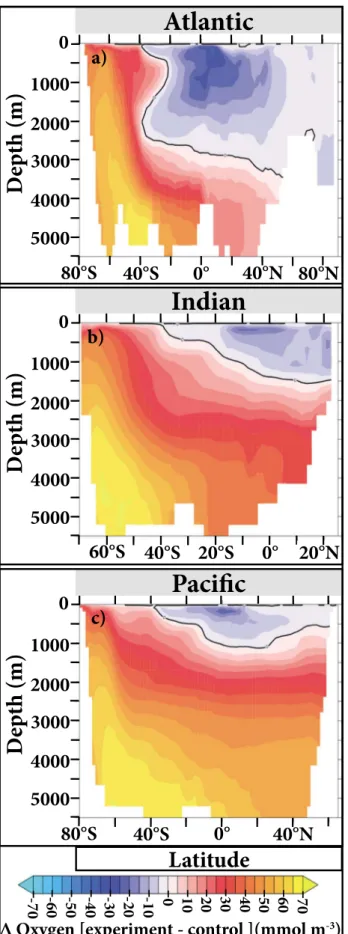
Since primary productivity produces oxy- gen and organic matter remineralization consumes it, the change in these pro- cesses in the experimental runs has an effect on dissolved oxygen (Figures 2, 3, and S5). Simulated oxygen concentrations
Figure 2.Steady state annual zonally aver- aged changes in oxygen in the (a) Atlantic, (b) Indian, and (c) Pacific ocean basins for the UVic simulation. The black lines are the zero (no change) contours.
below 500 m increase globally by an aver- age of 15% (UVic) and 22% (ECCO-BUR) when SO biological processes cease in the simulations. These increases in oxygen occur even in regions such as the North Pacific that are quite far from the SO (Figures 2 and S5), a feature that is in line with the relatively high fraction of Antarctic water masses in this region [Khatiwala et al., 2012]. These dynamics occur in our model simulations because no oxygen is biotically consumed in the SO in water masses that have mostly equi- librated at the surface (see discussion on oxygen equilibration inDuteil et al.[2013]) and then been subducted again. It is important to note that simulated SO sub- surface biological oxygen consumption essentially occurs during part of the year in the control runs since it is dependent on the seasonal availability of photo- synthetically generated organic matter (Figure S6). Thus, the experiments only cause a seasonal change in SO oxygen dynamics. However, this change is enough for oxygen to remain higher than in the control runs during deep water mass for- mation and transport out of the SO and eventually also through midlatitude to low latitudes in spite of the higher organic matterfluxes (Figures 1b, S1b, and S3) and hence higher oxygen consumption there.
As a result, total ocean oxygen increases from 259 to 294 Pmol in the UVic model and from 232 to 277 Pmol in the ECCO- BUR. In contrast to deeper waters, oxygen concentrations in the upper ocean actually decrease in most areas to the north of the SO in the experimental runs (Figures 2 and S5) because there is more primary production, organic matterflux, and hence oxygen consumption, in these regions (Figures 1, S1, S2, and S3). Since these subsurface waters host waters that are already low in oxy- gen in the control run, there is an increase in the simulated percent fraction of the ocean that is suboxic (O2<5 mmol m 3; Figure 3b), and tropical OMZs expand upon cessation of SO biological productivity, despite the increase in the global ocean’s oxygen inventory.
3.2. Transient Responses
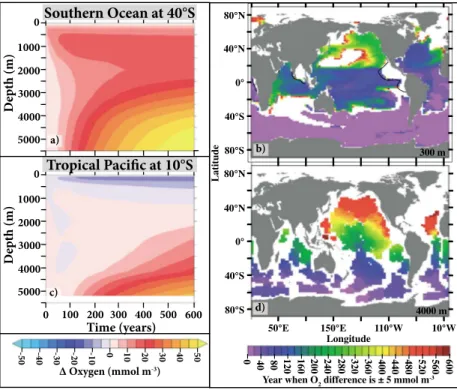
When the biological productivity in the SO is shut off, the effects are not immediately felt in other ocean regions. Remote biogeochemical changes depend on how long it takes for the newly available nutrients to be transported there and increase productivity or on how long it takes for the higher amounts of oxygen con- tained in newly formed Antarctic Bottom Water and shallower sub-Antarctic water masses to be transported there. Here we show several examples of these transient responses for the UVic model (Figures 4 and S7). In the SO the model begins to experience changes in oxygen at approximately the time when the biological component is shut off (see Figure 4a for an example at 40°S). As expected, oxygen changes in shallower waters occur almost immediately (Figures 4a, 4b and S7a), while it takes longer (40 to 100 years) for oxygen Figure 3.Steady state annually averaged global (a) oxygen concentra-
tions and (b) percent fraction of the ocean that is suboxic for the stan- dard (e.g., control) UVic (black lines) and ECCO-BUR (grey lines) simulations and the experiments with no Southern Ocean biology (UVic
—black dotted lines and ECCO-BUR—grey dotted lines). World Ocean Atlas 2009 (WOA09) data are also shown (open square symbols).
in the deep ocean to change by more than 5 mmol m 3(Figures 4a, 4d, and S7b). Farther north the model increasingly has less oxygen in shallow subsurface waters (see Figure 4c for an example at 10°S) as a result of increasing productivity, organic matterflux and consumption (not shown), and more oxygen in the deep ocean. However, depending on location, it takes decades to hundreds of years before oxygen in the upper ocean has decreased by more than 5 mmol m 3(Figures 4b and S7a). In the very deep ocean north of 40°S it typically takes hundreds of years (Figures 4d and S7b) for large oxygen increases to occur.
4. Discussion
Even though the two models used in our experiment differ in various aspects like model resolution, ocean circulation, and biogeochemistry, the experimental results that are related to oxygen are generally robust in regard to the overall changes that occur when the SO biological component is turned off. Both models show similar percent changes in organic matter export and nutrient and oxygen concentrations (Figures 1 and 2a), as well as in the time that it takes of these changes to occur (not shown for ECCO-BUR). However, there are some notable differences that can be attributed to the differences in resolution and circulation.
Furthermore, there are also important model differences in the amount of productivity just north of 40°S when SO biology is turned off. A possible explanation for this difference could be the lack of iron limitation in the ECCO-BUR model, which allows surface biota to utilize more nutrients immediately north of 40°S than in the UVic model that explicitly accounts for iron limitation.
Overall, our results suggest that the current ocean’s oxygen content is 14 to 19% lower than it would be otherwise because of SO biological processes. The size of OMZs also appears to be partially determined by SO biological processes (Figure 3b). However, one caveat to these results is that even though these, and most other global ocean models can generally simulate present-day large-scale O2distributions, they all overesti- mate the suboxic (O2<5 mmol m 3) water volume [Gnanadesikan et al., 2012;Stramma et al., 2012;Bopp et al., 2013; Cocco et al., 2013], presumably due to poorly resolved equatorial circulation [Dietze and Loeptien, 2013;Getzlaff and Dietze, 2013].
Figure 4.(a and c) Annual zonally averaged changes (experiment minus control) in oxygen over time for the UVic simula- tion at 40°S (Figure 4a) and 10°S (Figure 4c) in the Pacific Ocean. (b and d) The year when oxygenfirst changes (experiment minus control) by ±5 mmol m 3at 300 m (Figure 4b) and 4000 m (Figure 4d). The black contour line in Figure 4b indicates where oxygen equals 20 mmol m 3in the control run. White regions in Figures 4b and 4d indicate that either oxygen changes are less than ±5 mmol m 3or bathymetry is shallower than the depth level.
While it is highly unlikely that the biological productivity in the SO will cease to exist as in our experiments, our results show, in more detail than in previous studies [Sarmiento and Orr, 1991;Jin and Gruber, 2003;
Oschlies et al., 2010;Keller et al., 2014], how SO organic matterflux and its consumption/remineralization influ- ences ocean oxygen concentrations elsewhere by either trapping nutrients in the SO and inhibiting oxygen consumption to the north or through the consumption of oxygen in water masses that are formed in the SO and subsequently transported out of the region without coming into contact with the atmosphere. As shown in other SO biogeochemical studies [Sarmiento et al., 2004;Marinov et al., 2006;Primeau et al., 2013], these dynamics occur because SO export and the remineralization of organic matter exert such a large influence on global marine biogeochemistry. One important aspect of these dynamics involves where SO biological processes occur since different regions of the SO are thought to control different aspects of biogeochemical cycles, i.e., the concept of the biogeochemical divide [Marinov et al., 2006]. In the results presented above we did not differentiate between Antarctic and subantarctic waters because one of our objectives was to demon- strate how SO biological processes influence oxygen distributions throughout the water column. Thus, this experiment disrupts both the nutrient trapping efficiency of the SO, which has been suggested to occur pri- marily due to processes in subantarctic waters [Primeau et al., 2013], and theflux of organic matter to the deep ocean, which is driven significantly by biological processes in Antarctic waters [Primeau et al., 2013].
When we perform an experiment with the UVic model where we turn off biological processes in different parts of the SO based on where the maximum divergence in potential density occurs (Figure S8a), which allows us to separate these regions in a manner that is similar to previous biogeochemical studies of Antarctic and subantarctic waters [Marinov et al., 2006;Primeau et al., 2013], we can show that if biology is shut off only in Antarctic waters (Figure S8c), there is a strong global effect on deep ocean oxygen concen- trations (Figure S9). While if we shut off biological processes only in subantarctic waters (Figure S8b), there is little change in deep ocean oxygen concentrations (Figure S9). Together these experiments highlight the importance of Antarctic biogeochemistry in determining deep ocean oxygen concentrations. However, inter- estingly, in both experiments there is an increase in NPP, organic matter export, and nutrients north of 40°S, with quite similar results north of 20°S (Figure S10), and subsequently a decrease in oxygen in the upper few hundred meters (Figure S9b illustrates this for the change in suboxic area). This occurs because shutting off biology in either region decreases overall SO nutrient trapping. While these dynamics seem fairly straight for- ward for when there is no biology in the subantarctic region, e.g., unutilized nutrients are simply transported northward out of the SO, one might expect that only turning off biology in the Antarctic region would not have a similar effect given the hypothesized importance of subantarctic nutrient trapping [Primeau et al., 2013]. However, since our simulated SO biology is limited by light (especially seasonally), iron, and tempera- ture, the northward transport of surface phosphate and subsequent increases in NPP (Figures S10a and S10b) and organic matter export in subantarctic waters can only partly compensate the effect of shutting off biology in the Antarctic. Thus, in steady state a fraction of the unutilized nutrients from the Antarctic region ends up north of 40°S where it fuels productivity and increase oxygen consumption.
Since the magnitude of SO organic matter export and remineralization has changed in the past [Iida et al., 2013] and is predicted to increase in the future in response to climate change [Steinacher et al., 2010;Bopp et al., 2013;Marinov et al., 2013], ocean oxygen concentration distributions likely have been and will continue to be influenced by these dynamics. Understanding these changes is particularly important in regard to OMZs since biogeochemical cycling in these regions has impacts on the global cycling of nitrogen, phos- phorus, and iron [Paulmier and Ruiz-Pino, 2009;Gruber, 2011;Wright et al., 2012]. Of particular concern is that the expansion of these regions could have climatic feedbacks through nitrous oxide production [Naqvi et al., 2010;Zamora et al., 2012] and changes in the ocean’s nutrient content, in particular, via the loss offixed nitrogen by denitrification. Of further concern is how changes in the spatial distribution of low oxygen waters will affect higher trophic level organisms likefish [Ekau et al., 2010;Seibel, 2011].
Research by Stramma et al. [2008] suggested that tropical oxygen minimum zones are expanding.
Furthermore, in some of them, such as the Eastern Tropical South Pacific, nutrients also appear to be increas- ing [Czeschel et al., 2015]. Although many of these changes are likely due to regional dynamics [Deutsch et al., 2014;Duteil et al., 2014], and to some extent SO wind changes [Getzlaff et al., 2015], our results suggest that SO biology could also be playing some role in any changes. However, since there is a time lag between when changes in the SO occur and when this affects oxygen in the tropics (Figures 4 and S7), it is difficult to know how much of an influence changes in the SO have, especially because there are so few historical observations
from the SO. Moreover, since it is quite difficult to constrain and separate out the influence of different pro- cesses that operate on different time scales in OMZ dynamics [Karstensen et al., 2008;Brandt et al., 2015], it would be quite easy to miss the influence of SO biological processes.
Interestingly, our results suggest that the predicted strengthening of organic matter export and remineraliza- tion in the SO in response to climate change [Steinacher et al., 2010;Bopp et al., 2013;Marinov et al., 2013]
may help to slightly counter the changes in oxygen that are predicted to occur in OMZ and other regions in response to warming [Stramma et al., 2008;Gruber, 2011]. However, the time scales involved before SO-related impacts occur in OMZs, and their magnitude remains highly uncertain, especially given that circulation is pre- dicted to change as well [Gnanadesikan et al., 2012;Yamamoto et al., 2015], and thus require further study.
Numerous studies on both global [Helm et al., 2011;Gnanadesikan et al., 2012;Andrews et al., 2013;Yamamoto et al., 2015] and regional scales [Deutsch et al., 2011, 2014;Duteil et al., 2014;Brandt et al., 2015] have shown how important physical mechanisms and local biological dynamics are in controlling oxygen distributions and trends. The results of this idealized study may remind us that remote biological processes can play a role in determining global oxygen distributions in some regions and show that past, mostly unobserved changes in SO biological processes may exert an influence on currently observed changes in oxygen.
5. Summary and Conclusions
Our results show that SO biological processes can play an important role in determining global oxygen dis- tributions. We estimate that the current ocean’s oxygen content is 14 to 19% lower than it would be other- wise because of SO biological processes. The size of OMZs also appears to be partially determined by SO biological processes. Therefore, we suggest that when studying oxygen trends in any location, such as tropi- cal OMZs, one must account for the influence that remote processes have and the time scales over which those influences are felt.
References
Andrews, O. D., N. L. Bindoff, P. R. Halloran, T. Ilyina, and C. Le Quéré (2013), Detecting an external influence on recent changes in oceanic oxygen using an optimalfingerprinting method,Biogeosciences,10, 1799–1813, doi:10.5194/bg-10-1799-2013.
Bopp, L., et al. (2013), Multiple stressors of ocean ecosystems in the 21st century: Projections with CMIP5 models,Biogeosciences,10(10), 6225–6245, doi:10.5194/bg-10-6225-2013.
Brandt, P., et al. (2015), On the role of circulation and mixing in the ventilation of oxygen minimum zones with a focus on the eastern tropical North Atlantic,Biogeosciences,12, 12,069–12,136, doi:10.5194/bg-12-489-2015.
Cocco, V., et al. (2013), Oxygen and indicators of stress for marine life in multi-model global warming projections,Biogeosciences,10(3), 1849–1868, doi:10.5194/bg-10-1849-2013.
Czeschel, R., L. Stramma, R. A. Weller, and T. Fischer (2015), Circulation, eddies, oxygen and nutrient changes in the eastern tropical South Pacific Ocean,Ocean Sci.,11, 455–470, doi:10.5194/os-11-455-2015.
Deutsch, C., H. Brix, T. Ito, H. Frenzel, and L. Thompson (2011), Climate-forced variability of ocean hypoxia,Science,333(6040), 336–339, doi:10.1126/science.1202422.
Deutsch, C., et al. (2014), Oceanography. Centennial changes in North Pacific anoxia linked to tropical trade winds,Science,345(6197), 665–668, doi:10.1126/science.1252332.
DeVries, T., F. Primeau, and C. Deutsch (2012), The sequestration efficiency of the biological pump,Geophys. Res. Lett.,39, L13601, doi:10.1029/2012GL051963.
Dietze, H., and U. Loeptien (2013), Revisiting“nutrient trapping”in global coupled biogeochemical ocean circulation models,Global Biogeochem. Cycles,27, 1–20, doi:10.1002/gbc.20029.
Duteil, O., W. Koeve, A. Oschlies, D. Bianchi, E. Galbraith, I. Kriest, and R. Matear (2013), A novel estimate of ocean oxygen utilisation points to a reduced rate of respiration in the ocean interior,Biogeosciences,10, 7723–7738, doi:10.5194/bg-10-7723-2013.
Duteil, O., C. W. Böning, and A. Oschlies (2014), Variability in subtropical-tropical cells drives oxygen levels in the tropical Pacific Ocean, Geophys. Res. Lett.,41, 8926–8934, doi:10.1002/2014GL061774.
Eby, M., et al. (2013), Historical and idealized climate model experiments: an intercomparison of Earth system models of intermediate complexity,Clim. Past,9(3), 1111–1140, doi:10.5194/cp-9-1111-2013.
Ekau, W., H. Auel, H.-O. Pörtner, and D. Gilbert (2010), Impacts of hypoxia on the structure and processes in pelagic communities (zooplankton, macro-invertebrates andfish),Biogeosciences,7, 1669–1699.
Getzlaff, J., and H. Dietze (2013), Effects of increased isopycnal diffusivity mimicking the unresolved equatorial intermediate current system in an Earth System Climate Model,Geophys. Res. Lett.,40, 2166–2170, doi:10.1002/grl.50419.
Getzlaff, J., H. Dietze, and A. Oschlies (2015), Simulated effects of southern hemispheric wind changes on the Pacific oxygen minimum zone, Geophys. Res. Lett.,43, 728–734, doi:10.1002/2015GL066841.
Gnanadesikan, A., J. P. Dunne, and J. John (2012), Understanding why the volume of suboxic waters does not increase over centuries of global warming in an Earth system model,Biogeosciences,9, 1159–1172, doi:10.5194/bg-9-1159-2012.
Gruber, N. (2011), Warming up, turning sour, losing breath: Ocean biogeochemistry under global change,Philos. Trans. R. Soc. London, Ser. A, 369(1943), 1980–1996, doi:10.1098/rsta.2011.0003.
Helm, K. P., N. L. Bindoff, and J. A. Church (2011), Observed decreases in oxygen content of the global ocean,Geophys. Res. Lett.,38, L23602, doi:10.1029/2011GL049513.
Acknowledgments
This work is a contribution to the DFG supported project SFB754. Parallel supercomputing resources for I.K. have been provided by the North-German Supercomputing Alliance (HLRN).
Additional funding was provided by the BMBF BIOACID Program (FKZ 03F0608A) to W.K. The data used in this study are available at http://thredds.geomar.de/
thredds/fileServer/fb2bm/data/
Keller_etal_2016_No_SO_biology_oxy- gen.zip.
Holzer, M., and F. W. Primeau (2013), Global teleconnections in the oceanic phosphorus cycle: Patterns, paths, and timescales,J. Geophys. Res.
Oceans,118, 1775–1796, doi:10.1002/jgrc.20072.
Iida, T., T. Odate, and M. Fukuchi (2013), Long-term trends of nutrients and apparent oxygen utilization south of the polar front in Southern Ocean intermediate water from 1965 to 2008,PLoS One,8(8, e71766), doi:10.1371/journal.pone.0071766.
Ito, T., and M. Follows (2005), Preformed phosphate, soft tissue pump and atmospheric CO2,J. Mar. Res.,63, 813–839.
Iudicone, D., S. Speich, G. Madec, and B. Blanke (2008), The global conveyor belt from a Southern Ocean perspective,J. Phys. Oceanogr.,38(7), 1401–1425, doi:10.1175/2007JPO3525.1.
Iudicone, D., K. B. Rodgers, I. Stendardo, O. Aumont, G. Madec, L. Bopp, O. Mangoni, and M. R. d’Alcala (2011), Water masses as a unifying framework for understanding the Southern Ocean carbon cycle,Biogeosciences,8(5), 1031–1052, doi:10.5194/bg-8-1031-2011.
Jin, X., and N. Gruber (2003), Offsetting the radiative benefit of ocean iron fertilization by enhancing N2O emissions,Geophys. Res. Lett., 30(24), 2249, doi:10.1029/2003GL018458.
Karstensen, J., L. Stramma, and M. Visbeck (2008), Oxygen minimum zones in the eastern tropical Atlantic and Pacific oceans,Prog.
Oceanogr.,77, 331–350, doi:10.1016/j.pocean.2007.05.009.
Keller, D. P., A. Oschlies, and M. Eby (2012), A new marine ecosystem model for the University of Victoria Earth System Climate Model,Geosci.
Model Dev.,5, 1195–1220, doi:10.5194/gmd-5-1195-2012.
Keller, D. P., E. Y. Feng, and A. Oschlies (2014), Potential climate engineering effectiveness and side effects during a high carbon dioxide-emission scenario,Nat. Commun.,5, 1–11, doi:10.1038/ncomms4304.
Khatiwala, S. (2007), A computational framework for simulation of biogeochemical tracers in the ocean,Global Biogeochem. Cycles,21, GB3001, doi:10.1029/2007GB002923.
Khatiwala, S., M. Visbeck, and M. A. Cane (2005), Accelerated simulation of passive tracers in ocean circulation models,Ocean Model.,9(1), 51–69, doi:10.1016/j.ocemod.2004.04.002.
Khatiwala, S., F. Primeau, and M. Holzer (2012), Ventilation of the deep ocean constrained with tracer observations and implications for radiocarbon estimates of ideal mean age,Earth Planet. Sci. Lett.,325–326, 116–125, doi:10.1016/j.epsl.2012.01.038.
Kriest, I., and A. Oschlies (2013), Swept under the carpet: organic matter burial decreases global ocean biogeochemical model sensitivity to remineralization length scale,Biogeosciences,10(12), 8401–8422, doi:10.5194/bg-10-8401-2013.
Kriest, I., A. Oschlies, and S. Khatiwala (2012), Sensitivity analysis of simple global marine biogeochemical models,Global Biogeochem. Cycles, 26, GB2029, doi:10.1029/2011GB004072.
Levy, M., L. Bopp, P. Karleskind, L. Resplandy, C. Ethe, and F. Pinsard (2013), Physical pathways for carbon transfers between the surface mixed layer and the ocean interior,Global Biogeochem. Cycles,27, 1001–1012, doi:10.1002/gbc.20092.
Lumpkin, R., and K. Speer (2007), Global ocean meridional overturning,J. Phys. Oceanogr.,37(10), 2550–2562, doi:10.1175/JPO3130.1.
Marinov, I., A. Gnanadesikan, J. R. Toggweiler, and J. L. Sarmiento (2006), The Southern Ocean biogeochemical divide,Nature,441(7096), 964–967, doi:10.1038/nature04883.
Marinov, I., M. Follows, A. Gnanadesikan, J. L. Sarmiento, and R. D. Slater (2008), How does ocean biology affect atmospheric pCO2? Theory and models,J. Geophys. Res.,113, C07032, doi:10.1029/2007JC004598.
Marinov, I., S. C. Doney, I. D. Lima, K. Lindsay, J. K. Moore, and N. Mahowald (2013), North–south asymmetry in the modeled phytoplankton community response to climate change over the 21st century,Global Biogeochem. Cycles,27, 1274–1290, doi:10.1002/2013GB004599.
Naqvi, S. W. A., H. W. Bange, L. Farías, P. M. S. Monteiro, M. I. Scranton, and J. Zhang (2010), Marine hypoxia/anoxia as a source of CH4and N2O, Biogeosciences,7(7), 2159–2190, doi:10.5194/bg-7-2159-2010.
Oschlies, A., W. Koeve, W. Rickels, and K. Rehdanz (2010), Side effects and accounting aspects of hypothetical large-scale Southern Ocean iron fertilization,Biogeosciences,7, 4017–4035.
Pacanowski, R. (1995), MOM 2 Documentation User’s Guide and Reference Manual, 232 pp.
Palter, J. B., J. L. Sarmiento, A. Gnanadesikan, J. Simeon, and R. D. Slater (2010), Fueling export production: nutrient return pathways from the deep ocean and their dependence on the meridional overturning circulation,Biogeosciences,7(11), 3549–3568, doi:10.5194/
bg-7-3549-2010.
Paulmier, A., and D. Ruiz-Pino (2009), Oxygen minimum zones (OMZs) in the modern ocean,Prog. Oceanogr.,80(3–4), 113–128, doi:10.1016/
j.pocean.2008.08.001.
Primeau, F. W., M. Holzer, and T. DeVries (2013), Southern Ocean nutrient trapping and the efficiency of the biological pump,J. Geophys. Res.
Oceans,118, 1–18, doi:10.1002/jgrc.20181.
Sarmiento, J. L., and J. C. Orr (1991), Three-dimensional simulations of the impact of Southern Ocean nutrient depletion on atmospheric CO2
and ocean chemistry,Limnol. Oceanogr.,36(8), 1928–1950.
Sarmiento, J. L., N. Gruber, M. A. Brzezinski, and J. P. Dunne (2004), High-latitude controls of thermocline nutrients and low latitude biological productivity,Nature,427, 56–60, doi:10.1038/nature02204.1.
Schmittner, A., A. Oschlies, H. D. Matthews, and E. D. Galbraith (2008), Future changes in climate, ocean circulation, ecosystems, and biogeochemical cycling simulated for a business-as-usual CO2emission scenario until year 4000 AD,Global Biogeochem. Cycles,22, GB1013, doi:10.1029/2007GB002953.
Seibel, B. A. (2011), Critical oxygen levels and metabolic suppression in oceanic oxygen minimum zones,J. Exp. Biol.,214, 326–336.
Stammer, D., K. Ueyoshi, A. Köhl, W. G. Large, S. A. Josey, and C. Wunsch (2004), Estimating air-seafluxes of heat, freshwater, and momentum through global ocean data assimilation,J. Geophys. Res.,109, C05023, doi:10.1029/2003JC002082.
Steinacher, M., et al. (2010), Projected 21st century decrease in marine productivity: A multi-model analysis,Biogeosciences,7(3), 979–1005.
Stramma, L., G. C. Johnson, J. Sprintall, and V. Mohrholz (2008), Expanding oxygen minimum zones in the tropical oceans,Science,230, 655–658, doi:10.1126/science.1153847.
Stramma, L., A. Oschlies, and S. Schmidtko (2012), Mismatch between observed and modeled trends in dissolved upper-ocean oxygen over the last 50 yr,Biogeosciences,9(10), 4045–4057, doi:10.5194/bg-9-4045-2012.
Weaver, A. J., et al. (2001), The UVic Earth System Climate Model: Model description, climatology, and applications to past, present and future climates,Atmos. Ocean,39(4), 361–428, doi:10.1080/07055900.2001.9649686.
Wright, J. J., K. M. Konwar, and S. J. Hallam (2012), Microbial ecology of expanding oxygen minimum zones,Nat. Rev. Microbiol.,10(6), 381–394, doi:10.1038/nrmicro2778.
Yamamoto, A., A. Abe-Ouchi, M. Shigemitsu, A. Oka, K. Takahashi, R. Ohgaito, and Y. Yamanaka (2015), Global deep ocean oxygenation by enhanced ventilation in the Southern Ocean under long-term global warming,Global Biogeochem. Cycles,29, 1801–1815, doi:10.1002/
2015GB005181.
Zamora, L. M., A. Oschlies, H. W. Bange, K. B. Huebert, J. D. Craig, A. Kock, and C. R. Löscher (2012), Nitrous oxide dynamics in low oxygen regions of the Pacific: Insights from the MEMENTO database,Biogeosciences,9(12), 5007–5022, doi:10.5194/bg-9-5007-2012.