Croei et al.: Turbidinaetry of IgG and albumin in CSF and serum 863 J. Clin. Chem. Clin. Biochem.
Vol. 27, 1989, pp. 863-868
© 1989 Walter de Gruyter & Co.
Berlin · New York
A Simple Immunoturbidimetric Method for IgG and Albumin Quantitation in Cerebrospinal Fluid and Serum
By Croci, A. Nespolo
Istituto Neurologico "C. Besta", Milano, Italia M. A. Bosoni
Laboralorio Analisi Chimica Clinica, Ospedale Civile Vimercate (Milano), Italia and G. Tarenghi
Direzioni Scientifica Miles Italiana SpA, Divisione Diagnostici, Cavenago Brianza (Milano), Italia
(Received February 23/June 21, 1989)
Summary: We describe a simple immunoturbidimetric method for measuring both IgG and albumin in CSF and serum, which enables the calculation of CSF indices. For each protein, only one calibration curve is used for both CSF and serum samples. The assay protocol is simple and similar for both tests. Sensitivity and versatility of the method afford measurements over a very wide ränge of concentrations (approx. 0.007 to 94 g/l for IgG and 0.06 to 92.40 g/l for albumin). Precision studies (triplicates for 6 runs over 15 days) gave overall CVs: < 2.9 and 4.9% for IgG in CSF (11.5 mg/1) and serum (10.28 g/l); < 1.3 and 1.1% for albumin in CSF (115 mg/1) and serum (76.89 g/l). Comparison studies showed gopd correlation with radial immuno- diffusion (r ^ 0.995 and 0.976 for IgG and albumin) and rate nephelometry (r > 0.967 and 0.982 for IgG and albumin). Thus, the method under investigation proved to be reliable and appears to be particularly suitable for the routine work.
Introduction The quantitative indices for estimating the intrathecal . . , . . ~ . * i_ i- -ö IgG production, i. e. Link's index
Quantitative determmation of immunoglobulm G
(IgG) and albumin in cefebrospinal fluid (CSF) is an IgGcsp, mg/dl albumin^m, g/dl importantdiagnostictestinthestüdyofinflammatory IgG
serum, g/dl x albumincsp, mg/dl
disorders of the central nervous System (CNS) (l -3). ^
TourtettoUe^
formula (4)> and Reiber^
formula_, „ , „_ . „
r(5), all include a correction for permeability changes Elevatum of these CSF protems results from two ^
blo£)d.
CSF^^
an/
they are calculatedmechamsms.
albumin values in both serum(a) "passive diffusion" äs a consequence of the m- CSF. Besides being accurate and precise, analytical creased permeability of the blood-CSF barrier in the methods for quantifying these protems m such fluids presence ,of high levels of plasma proteins;
should have wide^easuring ranges, because of the
variability of the protein levels m patients with vanous
(b) "intrathecal synthesis" of IgG by B lymphocytes neurological diseases (albumin from 0.05 to 80 g/l
within the liquor compartment. and IgG from 0.006 to 100 g/l, approximately).
864 Croci et al.: Turbidimetry of IgG and albumin in CSF and serum
Liquid-phase immunochernical techniques, such s nephelometry and turbidimetry, are now preferred to radial immunodiffusion (RID) for their sensitivity, precision, and rapidity. Unlike nephelometry, turbi- dimetry does not require a dedicated Instrumentation.
In this study, we explored the ability of an immuno- turbidimetric method (6) to perform IgG and albumin assays on CSF and serum samples from patients af- fected by various neurological disorders.
Materials and Methods
Immunoturbidimetric method Reagents
We used the reagent kits for the quantitative determination of IgG and albumin (SERA-PAK® immuno kits) from Miles It- aliana SpA, Diagnostics Division, Cavenago Brianza, Italy.
Each kit provides:
1) antibody reagent, consisting of specific antiserum appropri- ately diiuted in buffer (100 mmol/1 borate at pH 8.0 in the IgG kit; 50 mmol/1 Tris at pH 7.0 in the albumin kit) containing, per litre, 40 g of polyethylene glycol 6000 (PEG), l g of sodium azide, and 2 g of a nonionic surfactant. The reagent is stable for at least one year at 2—8 °C;
2) diluent, containing per litre 9 g of sodium Chloride and l g of sodium azide at pH 7.0; in the albumin kit, the diluent also contains 5 g of gelatin;
3) calibrator, whose protein assigned values are based on the College of American Pathologists U.S. Reference Preparations for Serum Proteins (7); the working calibrators are prepared by serially diluting this calibrator with diluent and are stable for at least 2 months at 2-8 °C.
A polyethylene glycol solution, containing all the antibody reagent components except the specific antiserum, is also pro- vided.
Assay procedures
For both proteins, we were able to utilize the same calibration curve for CSF and serum, the only difference being the dilution of the sample according to the total protein content and the assignement of appropriate values to working calibrators. Tl··
bles l and 2 sunimarize the assay procedures and typical con^·
centration values for working calibrators.
NHR (Normal-High Range) and VHR (Very High Range) procedures for quantifying IgG in CSF employ different sample volumes (50 μΐ vs 5 μΐ, the latter being the assay volume of the calibration curve). Absorbances in the CSF assay using 50 μΐ of sample were therefore multiplied by the appropriate correc- tion factor (1.089) to take accouiit of the different final reaction volume.
Apparates
For immunoturbidimetric assays we used an Optimale™ fluo- rometef/photometer (Ames-Gilford) with semi-automated pro- cedure, 21-fold predilutions of serum specimens being carried out separately.
Calculation of the calibration plots and of sample concentra^
tions were perfornied by the 4^parameter logistic model or a 3rd order pplynomial function using an IBM personal puter.
Comparative methods We assayed IgG and albumin by:
(a) a radial immunodiffusion method (NOR-Partigen® plates from Behringwerke AG, Marburg, Lahn, F. R. G.), but using the SERA-PAK working calibrators for calibration, because of a discrepancy in nominal protein Contents;
(b) a rate nephelometry method (Array™ Protein System from Beckman Instruments, Inc., Brea, CA 92621).
Samples
We used serum and lumbar CSF samples taken from patients, ages 10 to 50 years, who were affected by various neurological diseases. The sampies were first stored at -τ20 °C, then brought to room temperature, and kept for 30 min before testing.
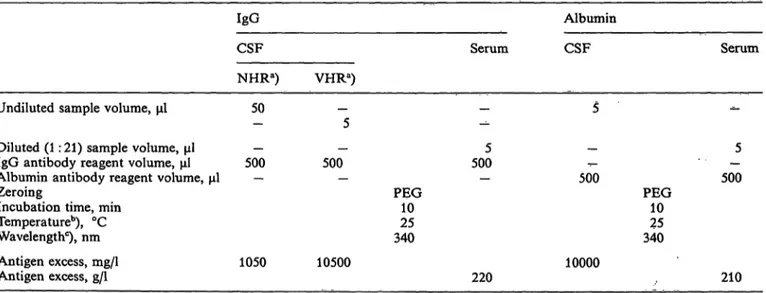
Tab. l. IgG and albumin tests
IgG Albumin
CSF Serum CSF Serum
NHRa) VHRa) Undiluted sample volume, μΐ 50
Diiuted (l: 21) sample volume, μΐ — — IgG antibody reagent volume, μΐ 500 500 Albumin antibody reagent volume, μΐ — — Zeroing
Incubation time, min Temperature0), °C Wavelengthc), nm
Antigen excess, mg/1 1050 10500 Antigen excess, g/l
5005
PEG10 34025
500
10000
5 PEG 500
2510 340
220 210
a) Up to 440 mg/1 (NHR procedure) and from 70 to 4470 mg/1 (VHR procedure), approximately
b) Also 30 °C or 37 °C
c) Also 360 nm
All calibration curves using 5 μΐ of working calibrators and 500 μΐ of antibody reagent
J. Clin. Chem. Clin. Biochem. / Vol. 27,1989 / No. 11
Croci et al.: Turbidimetry of IgG and albumin in CSF and serum 865 Tab. 2. Working calibrators and typical assay ranges for IgG and albumin tests
Working calibrators"), dilutions
IgG, with
undiluted CSF (NHR), mg/1 diluted CSF (VHR), mg/1 1 : 21 diluted serum, g/l
Albumin, with undiluted CSF, mg/1 1 : 21 diluted serum, g/l
1:128 707 1.47 1:512 1.4368
1:64 14014 2.93 1:256 2.88137
1:12 28028 5.87 1 : 128
5.77275
1:16 56056 11.73 1:64 11.55550
1:8
1120112 23.47 1:32 23.101100
1:4
2240224 46.94 1:16 46.202200
1:2
4470447 93.87 1:8
92.404400
a) Prepared from a calibrator containing 8.94 g/l IgG and 35.18 g/l albumin. These are typical concentrations; values change with the lot number.
Results
Reaction kinetics
The time course of the immunoprecipitation reaction was similar for both IgG and albumin. The formation of insoluble complexes is almost complete after 5 min.
Nevertheless we chose a 10-min reaction time for this
"quasi-equilibrium" reaction.
The reaction is not influenced by temperature, and no significant difference was found at 25 °C and
37 °C.Stability of the calibration curves
We tested the stability of the calibration curves by assaying the same working calibrators (stored in re- frigerator) 8 times in a 30-day period. Figure l illus- trates the mean calibration curves with the pertinent Standard deviations. CVs calculated for each working calibrator are very l w: < 3.2% for IgG and < 2.3%
for albumin.
1.0- 0.8- 0.6- 0.4- 0.2-
i-'c\iin τ-^
IgG (serum) [g/l]
IgG (CSF 9 NHR) [mg/IJ IgG (CSF, VHR) [mg/l]
ϊ
1.6- 1.4- 1.2-
|o,:
1.0-eo —
0.6- 0.4- 0.2-
in oin fm
σ>CM
Albumin (serum) [g/l) UTb·» IO
j in
F i i
Albumin (CSF) [mg/IJ Fig. 1. Calibration curves for IgG (left) and albumin (right). Mean calibration curves (8 curves over 30 days); bars indicate± 2 SO
NHR = Normal-High Range procedure VHR = Very High Range procedure
866 Croci et äl.: Turbidimetry of IgG and albumin in CSF and senim
Antigen excess
We evaluated the antigen excess phenomenon by an- alysing the calibrator supplied and various sera at high protein concentrations. IgG and albumin levels representing antigen excess are given in table l, ex- pressed in mg/1; the actual amount of protein at the equivalence point is 52.5 g IgG per sample and 50 g albumin per sample. If the total protein contents of the samples under examination are known and they are assayed at the proper dilution, falsely low results are unlikely to be obtained.
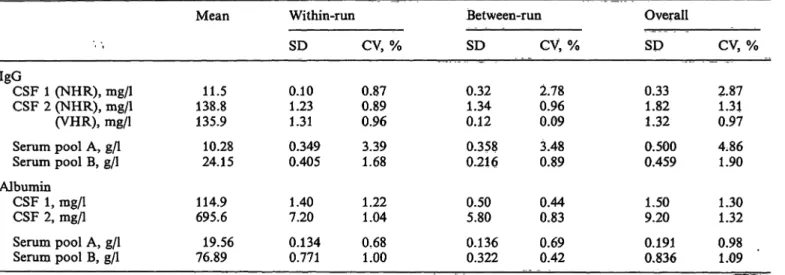
Precision
Precision was assessed from 18 replicate assays (6 . runs over 15 days) of two serum pools and two CSF samples.
Tab. 3. Precision data
Table 3 shows the results. One of the two CSF samples was tested for IgG with both NHR and VHR pro- cedures. The mean values obtained differ negligibly (-2.1%).
Method comparisön
fWe determined IgG and albumin in 90 routine serä and 90 routine CSF samples in 6 funs over 30 days by the present assay and by RID and rate nephelo- metry methods. Results were processed by least- square regression analysis (8), and statistieal param^
eters are given in table 4. The results for CSF IgG, obtained by NHR and VHR> were analysed both separately and äs a single collection of data.
.
IgGCSF 1 (NHR), mg/1 CSF 2 (NHR), mg/1 (VHR), mg/1 Serum pool A, g/l Serum pool B, g/l Albumin
CSF 1, mg/1 CSF 2, mg/1 Serum pool A, g/l Serum pool B, g/l
Mean
138.811.5 135.9 10.28 24.15 114.9 695.6 19.56 76.89
Within-run SD 0.101.23 1.31 0.349 0.405 1.407.20 0.134 0.771
CV, % 0.870.89 0.96 3.391.68
1.221.04 0.681.00
Between-run SD
0.321.34 0.12 0.358 0.216 0.505.80 0.136 0.322
CV, % 2.780.96 0.09 0.893.48
0.830.44 0.690.42
Overall SD 0.331.82 1.32 0.500 0.459 1.509.20 0.191 0.836
CV, % 2.871.31 0.97 4.861.90
1.301.32 0.981.09 n = 18 for each determination; over a 15-day period
Tab. 4. Correlation between the immunoturbidimetric method (y) and other methods (x) Comparisön
methods (x) IgGRID
nephelometryRate
Sample
CSF Serum CSFCSF CSF
n
90b) 90 81C) 25d) 90b)
r
0.965 0.955 0.998 0.999 0.999
Slope
1.003 0.908 1.043 1.036 1.042
y-iritercept mg/1 for CSF
1.1 0.68 -1.31.6 -1.0
Syx
; g/i for
29.9 0.10 4.58.1 5.9
x serum
97.7 12.63 249.158.6
96.0
y
99.0 12.15 259.759.8
99.0
Rangea)
7-1000 5.65-26.50
7- 330 69-1100 7-1100
Serum 90 0.967 1.073 -0.35 0.39 11.67 12.17
a) Range of y-values
b) NHR and VHR procedures °) NHR procedure
d) VHR procedure
5.65-26.50 Albumin
RID
Ratenephelometry CSF Serum CSF Serum
90 90 90 90
0.987 0.976 0.999 0.982
0.982 0.986 1.080 1.012
-2.8 -0.42 -8.2
0.27
43.2 1.98 27.9
1.42
411.0 42.10 379.1
40.32
401.0 41.09 401.2 „
41.08
32-3630 27- 84.35 32-3630 27- 84.35
Croci et al.: Turbidimetry of IgG and albumin in CSF and scrum 867
Interferences
We explored the effect of haemoglobin, bilirubin, and triacylglycerols on the lest results.
The high predilution of serum samples (l :21) mini- mizes the potential interference by elevated concen- trations of such substances. IgG and albumin results were only slightly overestimated (by less than 9.5 and 10.2%) in three normal sera spiked with haemoglobin (8000 mg/1), bilirubin (50 mg/1), and triacylglycerols (4000 mg/1). Although CSF samples are analysed un- diluted, potential interference is very low. Neverthe- less, a sample blank should be run for samples with a high level of bilirubin (an unusual occurrence) or haemoglobin (subarachnoid haemorrhages, CSF withdrawal contaminated with blood). IgG and al- bumin results were in fact overestimated by about 25% and 30% in a sample with 500 mg/1 of haemo- globin.
We also tested the effect of the most widely used anticoagulants. No significant interference was found for sodium heparin, sodium citrate, or disodium EDTA up to four times the commonly used concen- trations.
Carry-over Two CSF pools
1) albumin 3050 mg/1 and IgG 580 mg/1;
2) albumin 128 mg/1 and IgG 18 mg/1 and two serum pools
1) albumin 72 g/l and IgG 45 g/l;
2) albumin 22 g/l and IgG 5.2 g/l were analysed in the sequence:
1-1-1-2-2-2-1-1-1-2-2-2.
Average carry-over was 4.2% (CSF) and 7.3%
(serum) for IgG, and 5.0% (CSF) and 8.5% (serum) for albumin.
Discussion
We found that the present niethod for the immuno- turbidimetric quantitation of IgG and albumin in CSF and serum (or plasma) gives good results and is con- venient to perform. *
tCalibration curves are stable, precision is very good, and the accuracy, compared with that of other widely used methods, is certainly satisfactory. Interestingly, the same calibration curve can be used both for CSF and serum samples despite their remarkably different protein concentrations. The sensitivity of the CSF IgG assay (6 mg/1) is high, and superior to that of immunonephelometry (12 mg/1).
Dilution of polyethylene glycol, the enhancer of the immunoprecipitation reaction, by the larger amount of CSF sample in the NHR procedure (50 μΐ instead of 5 μΐ) does not significantly influence the reaction kinetics, s shown by the equivalent results from the NHR and VHR procedures (tabs. 3 and 4). From a practical point of view, favourable features of the method are the use of the same predilution (l: 21) of serum samples for both proteins, and the adaptability both to a plain spectrophotometer and to common automated analysers.
The level of interference from haemoglobin, bilirubin, and triacylglycerols is generally acceptable, but strongly haemolysed CSF samples should be run with a sample blank for higher accuracy. Dose response curves for immunoturbidimetric assays are non-linear (fig. 1). Basically, there are two Computing algorithms for describing adequately these curves and both re- quire a computerized program to process and st re the curves. We obtained the best fit with the four- parameter logistic model; equivalent results can also be obtained with a third-order polynomial function, although it sometimes yields minor mathematical ar- tefacts, such s flexures between the two highest work- ing calibrators. To obtain analytically reliable values, it is worthwhile underlining the importance of meas- uring all the terms of the various ratios and formulae mentioned in the Introduction with the same assay method.
In summary, the irnrnunoturbidimetric method de- scribed here proved to be simple, rapid, easy to use, and accurate in measuring IgG and albumin in CSF and serum samples. Both small and large batches of specimens can be analysed with equal convenience.
The method is therefore useful for all laboratories involved in the assay of CSF proteins.
References
1. Lowenthal, A., van Sande, M. & Karcher, D. (1960) The differential diagnosis of neurological disease by fractioning electrophoretically the CSF gamma globulins. J. Neurochem.
6, 51-56.
2. Link, H. (1967) Immunoglobulin G and low mplccular weight proteins in human cerebrospinal fluid: chemical and immunological characterization with special rcfercnce to multiple sclerosis. Acta Neurol. Scand. 43, 1-136 (suppl.
28).
868 Croci et al.: Turbidimetry of IgG and albunün in CSF and serum 3. Tibbling, G., Link, H. & Ohman, S. (1977) Principles of . 6. Dona, V., Papagni, M., Tarenghi, G., Aguzzi, F. & Berti, G.
albumin and IgG analysis in neurological disorders. I. Es- " (1987) Specific serum prptein quantitation by a simple im- tablishment of reference values. Scand. J. Clin. Lab. Invest. munoturbidimetric method. Giom. It. Chim. Clin. 12* 205 — 57,385-390. 214.
4. Tourtelotte, W. W., Ma, B. I. & Brandes, D. B. (1981) 7. Reimer, C. B., Smith, J. S., Wells, T. W., Nakamura, R. M., Quantification of de novo central nervous System IgG mea^ Keitges, P. W., Ritchie, R. R, Wüliams, G. W., Hanson, D>
sles antibody synthesis in SSPE. Ann. Neurol. P, 551-556. J. & Dorsey, D, B. (1982) Collaborative caHbration of the 5. Reiber, H. & Felgenhauer, K. (1987) Protein transfer at the U.S. National and the College of American Päthologists
blood cerebrospinal fluid barrier and the quantitation of the reference preparations for specific ,^erum proteins. Am^ J.
humoral immune response within the central nervous System. Clin. Pathol. 77, 12^19.
Clin. Chim. Acta 163, 319 - 328. 8. Westgard, J. O. & Hunt, R. M. (1973) Üse and Interpretation of common statistical tests in method-comparison studies.
Clin. Chem. 19, 49 — 57.
Dr. Danilo Croci
Istituto Neurologico "C. Besta"
Via Celoria 11 1-20133 Milano