ATLAS-CONF-2014-041 05July2014
ATLAS NOTE
ATLAS-CONF-2014-041
July 3, 2014
Search for pair produced long-lived neutral particles decaying in the ATLAS hadronic calorimeter in ppcollisions at √
s=8TeV
The ATLAS Collaboration
Abstract
The ATLAS detector at the Large Hadron Collider at CERN is used to search for the decay of a light scalar boson to a pair of long-lived particles, neutral under the Standard Model, in 20.3 fb−1of data collected in proton-proton collisions at √
s=8 TeV. A bench- mark model with a light scalar boson that couples to mass in the same manner as the Higgs boson is considered. This search is sensitive to long-lived particles that decay to jets at the outer edge of the ATLAS electromagnetic calorimeter or inside the hadronic calorimeter.
No significant excess of events is observed. Limits are reported on the product of the scalar boson production cross-section times branching ratio into long-lived neutral particles as a function of the proper lifetime of the particles. Limits are reported for boson masses between 100 and 140 GeV, and a long-lived neutral particle mass between 10 and 40 GeV.
c Copyright 2014 CERN for the benefit of the ATLAS Collaboration.
Reproduction of this article or parts of it is allowed as specified in the CC-BY-3.0 license.
1 Introduction
A number of extensions of the Standard Model (SM) involve a hidden sector that is weakly coupled to the SM in which the coupling is via a heavy communicator scalar particle,ΦHS[1–4]. The hidden sector contains a confining gauge interaction that is otherwise invisible to the SM. In the benchmark model used in this paper the scalarΦHScouples to mass in the same manner as the Higgs [3]. AΦHSwith the same mass as the Higgs boson can be considered as the Higgs with an exotic decay channel. The discovery of a 126 GeV Higgs boson [5–7] by the ATLAS and CMS experiments [8, 9] in 2012 identified the last piece of the highly successful SM. However, current measurements of the Higgs boson couplings allow for substantial exotic decays.
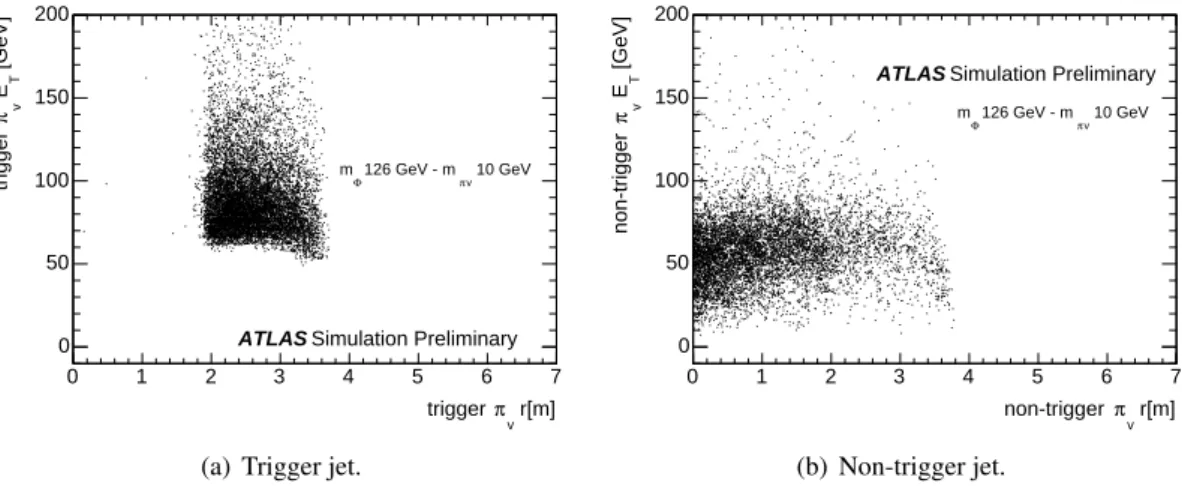
A Hidden Valley (HV) benchmark model [3, 4] is chosen in which the lightest HV particles form an isopin triplet and are called valley pions (πv) because of their similarity to the SM triplet. The πv are pair-produced (ΦHS→πvπv) and each decays to a pair of SM fermions. They possess Yukawa couplings to fermions and therefore preferentially decay to accessible heavy fermions, primarilybb,ccandτ+τ−.
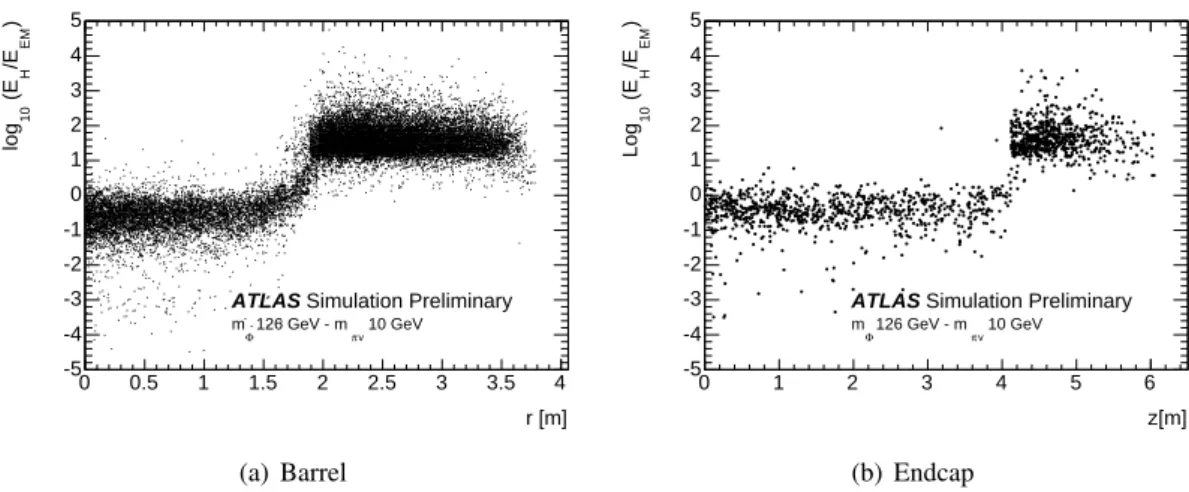
The lifetime of theπv is unspecified and could be quite long. The particles’ late decay to fermion pairs can therefore result in signatures that traditional searches will fail to detect. A πv decay in the inner detector or muon spectrometer can be reconstructed as a displaced vertex. However, standard vertex-finding algorithms [10] are not likely to reconstruct them. Likewise, aπv decay deep inside the calorimeter is reconstructed as a jet with an unusual energy signature that most traditional searches reject as having poor data quality. This search focuses on final states where both πv decay in the hadronic calorimeter or near the outer edge of the electromagnetic calorimeter. Each heavy fermion pair from aπv
decay is reconstructed as a single jet with three characteristic properties: a narrow radius, no tracks from charged particle pointing to the jet, and little or no energy deposited in the electromagnetic calorimeter.
TwoΦHS masses are considered in addition to the Higgs mass, which is taken as 126 GeV; this is a search for both exotic decays of the Higgs boson as well as similar decays of other scalar bosons. In addition, severalπvmasses are studied. Other searches for displaced vertices generated by neutral, long- lived particles were performed in ATLAS [11] and CMS [12] at the LHC and in D0 [13] and CDF [14] at the Tevatron. The Tevatron experiments and CMS searched for displaced vertices in their tracking system only, which results in a corresponding proper decay length range of few meters. CMS also looked at the multi-lepton decay channel, another possible decay of hidden valley particles. The previous ATLAS analysis, based on 7 TeV data, used the muon spectrometer system, and was sensitive to proper decay lengths between 1 m and 20 m depending on the benchmark model. No evidence of physics beyond the SM was found.
2 The ATLAS Detector
The ATLAS detector [15] is a multi-purpose detector at the LHC, consisting of several sub-detectors.
From the interaction point (IP) outwards there is an inner detector (ID), electromagnetic and hadronic calorimeters, and a muon spectrometer (MS). The ID, immersed in a 2 T axial magnetic field, provides tracking and vertex information for charged particles within the pseudorapidity1 (η) region |η|<2.5.
It consists of three different tracking detectors. From small radii outwards, these are: a silicon pixel detector, a silicon microstrip tracker (SCT) and a transition radiation tracker (TRT).
The calorimeter provides coverage over the range|η|<4.9. It consists of a lead/liquid-argon electro- magnetic calorimeter (ECal) at smaller radii surrounded by a hadronic calorimeter (HCal) at larger radii
1The right-handed coordinate system of ATLAS has its origin at the nominal IP, which is centered in the beampipe. The z-axis lies along the beampipe axis and thex-axis points from the IP to the center of the LHC ring. Cylindrical coordinates(r,φ) are most often used with the azimuthal angleφrunning from 0 to+πin the top half of the detector and 0 to−πin the bottom half of the detector. The boost-covariantηis used in place of the polar angleθ, and the two are related byη=−ln(tan(θ/2)).
comprising a steel and scintillator-tile system in the barrel region (|η|<1.7) and a liquid-argon system with copper absorbers in the endcaps (1.5<|η|<3.2). The ECal spans the range 1.5 m<r<2.0 m in the barrel and 3.6<|z|<4.25 m in the endcaps. The HCal covers 2.25 m<r<4.25 m in the barrel and 4.3 m<|z|<6.05 m in the endcaps. There is also a forward calorimeter, the FCal, with coverage between 3.1<|η|<4.9 which uses copper absorbers for the first layer, and tungsten absorbers for the second and third layers. Muon identification and momentum measurement are provided by the MS that extends to|η|=2.7. It consists of a three-layer system of gas-filled precision-tracking chambers. The region|η|<2.4 is also covered by separate trigger chambers.
A sequential three-level trigger system selects events to be recorded for offline analysis. The first level is consists of custom hardware that implements selection on jets, electrons, photon, taus, muons, and missing energy or large total transverse energy. The second and third levels add charge-particle track finding and refine the first level selections with progressively more detailed algorithms.
3 Data and Simulation Samples
All data used in this analysis were collected during the 2012 8 TeV LHC run. After detector data quality requirements are applied, the sample corresponds to an integrated luminosity of 20.3 fb−1. The HV Monte Carlo (MC) samples are generated with PYTHIA 8.165 [16] to simulate gluon fusiongg→ΦHS
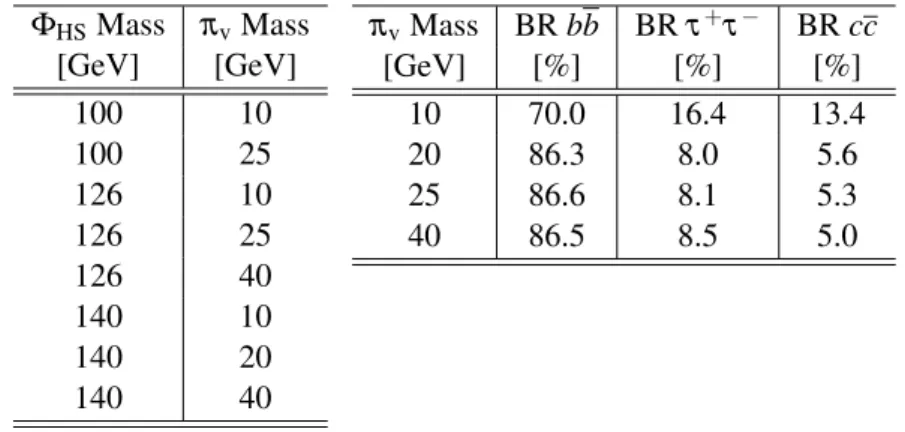
and theΦHS decayΦHS→πvπv for differentΦHSandπvmasses (Table 1). TheΦHS was simulated in Pythia by replacing the Higgs boson’s mass, production and decays with those of theΦHS. The 126 GeV ΦHS samples were produced with a cross section calculated at NNLL QCD and at NLO EW assuming SM Higgs properties [17]. After generation the events are passed through a detailed simulation of the detector response with GEANT4 [18, 19] and then the same reconstruction algorithms as are used on the data. GEANT4 needed no modification to simulate the signal as all decay particles are SM particles. All kinematically allowed decay modes are open to theπv→ f f decay, however the dominant decay mode is tobbpairs. All MC sample samples are reweighted to reproduce the number of interactions per crossing observed in the data.
ΦHSMass πvMass
[GeV] [GeV]
100 10
100 25
126 10
126 25
126 40
140 10
140 20
140 40
πvMass BRbb BRτ+τ− BRcc
[GeV] [%] [%] [%]
10 70.0 16.4 13.4
20 86.3 8.0 5.6
25 86.6 8.1 5.3
40 86.5 8.5 5.0
Table 1: TheΦHS mass and πv mass of each benchmark Hidden Valley model generated. The decay branching fractions of theπv as a function of theπvmass are also listed.
4 Trigger and Event Selection
Candidate events are collected using a dedicated trigger, called theCalRatiotrigger, which looks specifi- cally for long-lived neutral particles that decay near the outer radius of the ECal or within the HCal [20].
The trigger is tuned to look for events containing at least one narrow jet with little energy deposited in the ECal and no charged tracks pointing towards the jet. The trigger first selects only narrow jets by requiring at least 40 GeV of transverse energy in the calorimeter in a 0.2×0.2 (∆η×∆φ) region us- ing topological jets [15], in contrast to the default algorithm in which the energy in a 0.4×0.4 region is summed. The 40 GeVET threshold requirement is fully efficient at an offline jetET of 60 GeV. To select jets with a high fraction of their energy in the HCal the trigger then requires these narrow jets to have log10(EH/EEM)>1.2, whereEH/EEM is the ratio of the energy deposited in the HCal (EH) to the energy deposited in the ECal (EEM). The trigger also requires no tracks withpT>1.0 GeV in the region 0.2×0.2 (∆η×∆φ) around the jet axis. Finally, the third level of the trigger uses the slower and more accurate anti-ktalgorithm [21] withR=0.4 to reconstruct the jet and requires the jet to have a minimum of 35 GeV of transverse energy (ET>35 GeV).
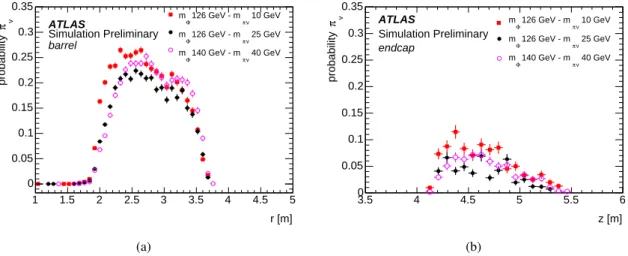
The probability (επv) for a singleπvto fire the trigger in simulation is shown in Fig. 1, for the barrel (a) and endcap region (b) of the calorimeter in several different signal samples. The average probability is about 20% forπv decays occurring at radii between 2 and 3.5 m in the barrel, and about 6% forπv decays with |z|between 4.0 and 5.5 m in the endcaps. The turn on takes place before the start of the HCAL as a the log10(EH/EEM)cut will allow for a small amount of energy in the ECal. The probability falls towards the end of the HCal because too much of the energy escapes the HCal to pass the jet ET requirement. Efficiency is lower in the endcap because most events fail the isolation criteria due to the increased occupancy from pile-up.
r [m]
1 1.5 2 2.5 3 3.5 4 4.5 5
vπprobability
0 0.05 0.1 0.15 0.2 0.25 0.3 0.35
ATLAS
Simulation Preliminary
10 GeV
πv
126 GeV - m mΦ
25 GeV
πv
126 GeV - m mΦ
40 GeV
πv
140 GeV - m mΦ
barrel
(a)
z [m]
3.5 4 4.5 5 5.5 6
vπprobability
0 0.05 0.1 0.15 0.2 0.25 0.3 0.35
ATLAS
Simulation Preliminary
10 GeV
πv
126 GeV - m mΦ
25 GeV
πv
126 GeV - m mΦ
40 GeV
πv
140 GeV - m mΦ
endcap
(b)
Figure 1: The probability (επv) for a singleπv to pass the trigger in the barrel (a) and in the endcaps (b) as a function of the triggerπv radial decay position (orzposition in the endcaps). επv is the number of πvfiring the CalRatio trigger and decaying at given length (rorz) divided by the number ofπvgenerated at that decay length. These three samples are shown to demonstrate how the boost of theπv affects the efficiency.
All events in this analysis are required to pass the CalRatio trigger. Events must also contain a reconstructed primary vertex consisting of at least three tracks with pT>1 GeV. Events are rejected if any reconstructed jets show evidence of being caused by a beam-halo interaction (a so-called Line Of Fire event [20]). A missing transverse momentum requirement, ETmiss < 50 GeV, is applied to reject non-collision events, such as cosmic rays or beam-halo interactions.
In the offline selection, jets are reconstructed with a standard anti-kt algorithm withR=0.4, starting from calorimeter energy clusters calibrated using the local cluster weighting method [22]. Jets are then calibrated using an energy- andη-dependent simulation based calibration scheme. Jets are rejected if they do not pass the standard ATLAS good-jet criteria with the exception of requirements that reject
jets with small electromagnetic energy fraction (EMF). At least one jet must match a jet that fired the CalRatio trigger. The jet matching the trigger must pass anET>60 GeV requirement while a second jet must satisfy anET>40 GeV requirement. If more than one jet fired the CalRatio trigger then only the leading jet is required to passET>60 GeV.
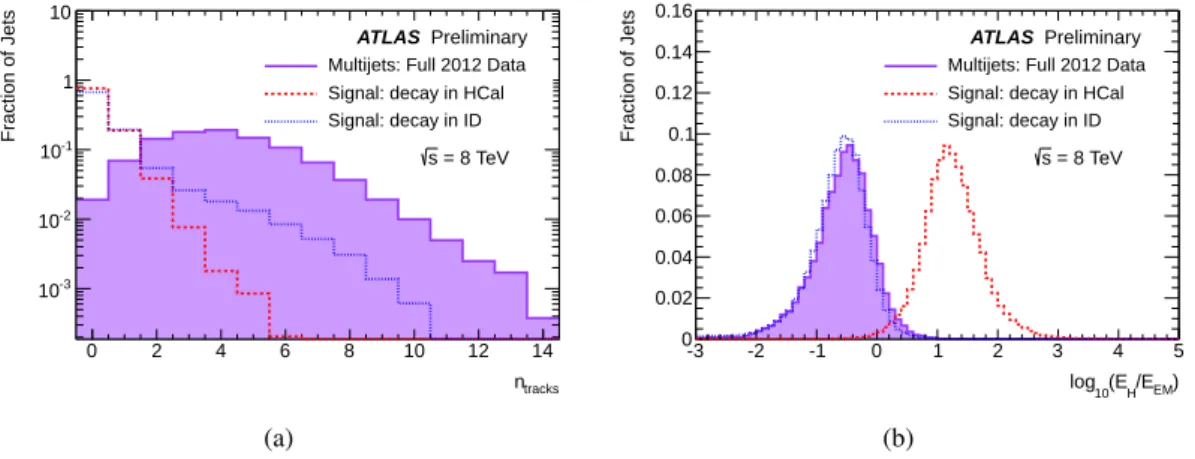
Individually, all jets must satisfy|η|<2.5, have log10(EH/EEM)>1.2, and have no good tracks in the ID with pT>1.0 GeV in a region∆R<0.2 centered on the jet axis. A good track must have≥2 hits in the pixel detector and a total of≥9 hits in the pixel and SCT detectors. Fig. 2a shows the distribution of the number of tracks associated with each jet and Fig. 2b shows the log10(EH/EEM)of each jet for SM multijets compared to jets resulting fromπv decays in the HCal and ID.
tracks
n
0 2 4 6 8 10 12 14
Fraction of Jets
10-3
10-2
10-1
1 10
Multijets: Full 2012 Data Signal: decay in HCal Signal: decay in ID
ATLAS Preliminary
= 8 TeV s
(a)
EM)
H/E
10(E log
-3 -2 -1 0 1 2 3 4 5
Fraction of Jets
0 0.02 0.04 0.06 0.08 0.1 0.12 0.14 0.16
Multijets: Full 2012 Data Signal: decay in HCal Signal: decay in ID
ATLAS Preliminary
= 8 TeV s
(b)
Figure 2: Distribution of the number of charged tracks (ntracks) with pT>1.0 GeV in a cone of∆R<0.2 around the jet axis (a) and distribution of jet log10(EH/EEM)(b) with jet|η|<2.5, pT>40 GeV, and
−5 ns<t <5 ns. The Signal: decay in HCAL distributions, created from the mΦ =126 GeV and mπv=10 GeV sample, are for jets resulting from πv decaying in the hadronic calorimeter while the Signal: decay in IDdistributions are forπvjets decaying in the ID. The filled histogram is the multijet data sample used to evaluate the multijet contribution to the background.
Jets caused by cosmic rays and beam-halo interactions are often out-of-time. The jet timing is calcu- lated by making an energy-weighted average of the timing for each cell in the jet. Each cell is defined to have a time of 0 ns if its energy is recorded at a time consistent with the arrival of aβ =1 particle from the IP. The timing of each jet is required to satisfy−1<t<5 ns.
The analysis requires that exactly two jets satisfy these requirements. The second jet requirement significantly reduces the SM multijet background contribution, as described below. Table 3 lists the final number of expected events in each signal MC sample. The final number of events selected in data is 24.
5 Background Estimation
The largest contribution to the expected background comes from SM multijet events. Cosmic ray inter- actions contribute at a much lower level, and beam-halo interactions make a negligible contribution as will be discussed below.
To estimate the multijet background contribution, a multijet data sample is used to derive the prob- ability that a jet passes the trigger and analysis selection. To obtain a raw background prediction, these jet probabilities are applied to a data sample that represents the multijet background before application of jet-level analysis selection. A correction to account for two-jet correlations is applied to this raw prediction to yield the final multijet background estimate.
The jet probability is determined using a multijet data sample of events that pass single-jet triggers with anETthreshold of 15 GeV or higher. The events are required to pass the analysisETmissrequirement and have at least two back-to-back (∆φ>2.0) jets withET>40 GeV and−2.5<η <2.5. One jet is required to pass standard ATLAS good-jet criteria. The second is used to measure two probabilities, one, calledP, for a jet to pass the trigger and theET>60 GeV jet requirement and the other, calledQ, for a jet to satisfy the requirementET>40 GeV. For bothPandQthe jet must also pass the log10(EH/EEM), track isolation, and all other analysis jet selection requirements including the standard ATLAS good-jet criteria. The probabilities are determined as a function of jetETandη. The jetETandηdependence must be calculated independently due to the small statistics of the sample, leading to a systematic uncertainty to account for any potential correlation. To calculate this systematic uncertainty the change in the mean ET as a function ofη and the change in the meanη as a function ofETis measured in the multijet data sample. The maximum variation is 2% for bothET andη. TheET orη of each jet are systematically shifted by this amount asPandQare recalculated. The newPandQdistributions are used to estimate the multijet background as described below, and the maximum variation in the result, corresponding to 6%, is used as the systematic uncertainty.
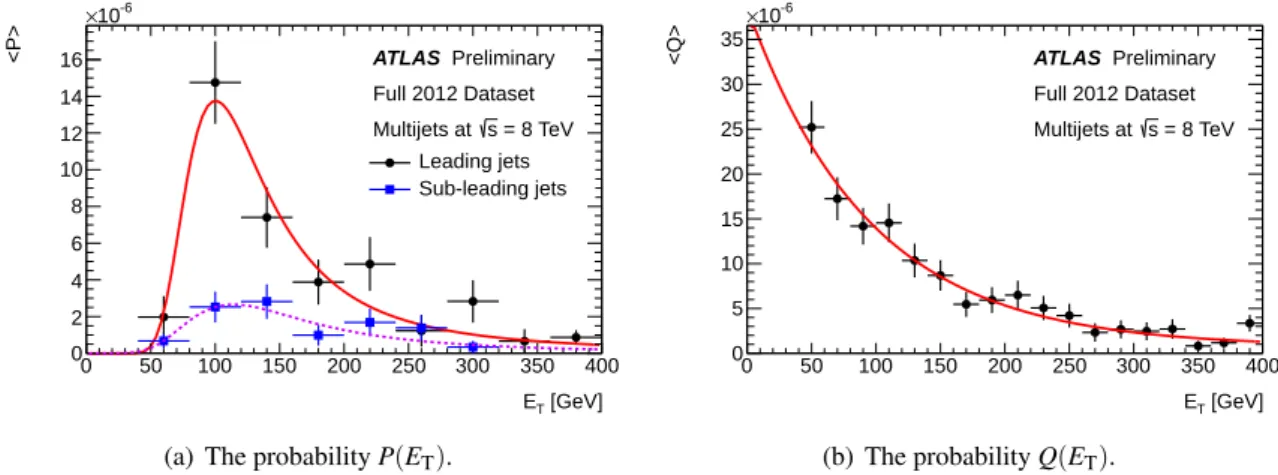
The probabilities as a function ofETare fitted to a Landau function forPand to an exponential func- tion forQ. Theη dependence is strongly correlated with the distribution of material in the calorimeters and cannot be well described by any simple functional form; thus the probability is obtained directly from the distribution. ThePvs.ETparametrization is additionally split into leading jet and sub-leading jet samples because the probability is different for the two types of jets. This effect is also present for Q, however it is accounted for by the correction for jet correlations discussed below. Plots ofP(ET)and Q(ET)are shown in Fig. 3. The peak present in P(ET) is the result of the trigger turn on for the full trigger chain. The background dependence onPis dominated by leading jets.
[GeV]
ET
0 50 100 150 200 250 300 350 400
<P>
0 2 4 6 8 10 12 14 16
10-6
×
Leading jets Sub-leading jets ATLAS Preliminary Full 2012 Dataset
= 8 TeV s Multijets at
(a) The probabilityP(ET).
[GeV]
ET
0 50 100 150 200 250 300 350 400
<Q>
0 5 10 15 20 25 30 35
10-6
×
ATLAS Preliminary Full 2012 Dataset
= 8 TeV s Multijets at
(b) The probabilityQ(ET).
Figure 3: The probability that a jet from the multijet data sample will pass the trigger and all jet re- quirements including theET>60 GeV requirement is shown in (a). A Landau function is fitted to the leading and sub-leading jet distributions separately (solid and dashed lines). The probability to pass all jet requirements including the ET >40 GeV requirement as a function of jetET is shown in (b). An exponential function is fitted to the distribution (solid line). TheETrequirement is ignored when fitting to allow the curve to best match the shape of the data, but is used explicitly whenPandQare applied to a jet.
The probability P is verified using the CalRatio triggered dataset. The CalRatio triggered events are required to pass the same base event selection used to derive the single-jet probabilities as well as the requirements for calculatingP. The CalRatio triggered dataset contains 501387 events that fired the
unprescaled CalRatio trigger and passed the required selection, and the single-jet probabilities predict 513000±94000 (statistical) events.
To calculate the raw multijet background prediction the probabilitiesPandQare applied to jets in events selected by the 15 GeV single jet trigger. These single-jet probabilities are combined into an event probability using a combinatoric calculation that requires at least one jet in the event fire the trigger and only two jets pass all the jet selection criteria. The event probability is scaled to account for single-jet trigger prescales, yielding a weight for each event. The sum of all weights in the data sample yields a raw background prediction of 13.2±2.9 (statistical + systematic) events. The uncertainty is dominated by the low statistics for jets firing the CalRatio trigger in multijet events.
The log10(EH/EEM)and track isolation values of one jet are correlated with those of the second jet.
The single-jet probabilities above ignore this correlation. A scale factor to account for the correlation is calculated in data by examining regions in the log10(EH/EEM) and number-of-tracks (ntrack) plane that are outside the signal region (log10(EH/EEM)>1.2 andntrack=0). The log10(EH/EEM) binning is chosen such that binning is uniform in EMF2, andntrackranges from 0 to 7. The regions outside the signal region are expected to have very little signal contamination.
In each region the number of events observed in the CalRatio triggered dataset to the raw prediction is calculated. Two series of ratios are calculated, one as a function of log10(EH/EEM)and one as a function ofntrack. To determine the trend in the ratio as a function of log10(EH/EEM)the ntrack requirement is held constant: a jet is required to have 5 or 6 tracks. The ratio is then determined for several, non- overlapping ranges of log10(EH/EEM). The same procedure is used forntrack by requiring jets to have 0.55<EMF <0.65.
Both sets of ratios are fitted to allow extrapolation into the signal region. The product of the two ratios in the signal region yields a scale factor to correct for the correlation between jets. The assumption that the two contributions are uncorrelated is tested by a cross-check discussed below. The calculated scale factor is 1.8±0.5. The uncertainty on the scale factor is due to limited statistics.
To verify the procedure eight other bins on the log10(EH/EEM)andntrackplane were chosen and the full background prediction method was applied. Because signal contamination is negligible outside of the signal region, the predicted number of events can be directly compared to the number of events in the same log10(EH/EEM)-ntrack region in the CalRatio triggered data. In all cases the prediction was consistent with data to within one sigma.
The final multijet prediction is 23.2±8.0 (statistical + systematic) events in the signal region. The uncertainty is dominated by the statistical uncertainty, which is in turn dominated by the small statistics of the sample of jets matching the CalRatio trigger in the multijet data sample. The systematic contribution comes from the correlation betweenETandηas well as from the inclusion of a requirement on∆φ(not used in the signal selection) in the determination ofPandQ.
Particles from a cosmic ray shower may pass through and deposit energy in the calorimeter with- out passing through the ID. These energy deposits can be reconstructed as trackless jets. The overall contribution to the expected background is reduced by the jet-timing andETmissrequirement.
The cosmic ray background has been studied using a trigger similar to the CalRatio trigger, but active only when the detector is empty of proton-proton collisions. Each proton beam is divided up into slots, most of which contain protons. An empty crossing occurs when two of the empty slots coincide in the center of the detector, and five slots on either side in each beam are also empty of protons. Data gathered from these empty crossings is used to study backgrounds that are not beam related.
The analysis selection, with the exception of the jet timing requirement and the good vertex re- quirement, are applied to all empty-crossing triggered events. The−1<t<5 ns timing requirement is removed to increase statistics to give a more accurate determination of the background. A simple scaling can be used to predict the expected cosmic ray event rate within the timing window because the arrival
2log10(EH/EEM) =log10((1−EMF)/EMF).
time of cosmic ray muons is uniformly distributed. It is found that about 5% of cosmic ray events firing the trigger and containing two jets are events where both jets satisfy the−1<t<5 ns requirement.
Two additional corrections are applied to determine the final background prediction due to cosmic ray events. The first accounts for the different live-times of the triggers. The number of empty crossings is 2.9 times smaller than the number used to collect the full dataset of 20.3 fb−1. The second correction weights each event to account for soft tracks due to pile-up and underlying-event effects that would have caused the jet to fail the track isolation requirement had it occurred in a collision environment. To determine the weights a trigger that selects random collision events is used to determine the probability as a function ofη that a track withpT>1 GeV is present in a∆R<0.2 cone anywhere in the detector as a function ofη. This probability is applied to each jet in each event to determine an event weight. The event weights range from 0.55 to 0.63. Combining all the corrections results in a predicted number of cosmic ray events of 0.3±0.2 (statistical).
Another possible background contribution comes from a beam halo muon that undergoes bremsstrahlung in the HCal. Two selection criteria reduce this type of background. A jet-timing requirement is imposed because most of the jets produced by beam-halo interactions are not in time coincidence with jets from ppinteractions. In addition, events are rejected when track segments in the endcap muon chambers, from the entering beam halo muon, align inφ with a jet. These two requirements reduce the background to a negligible level with no discernible effect on the signal.
Unpaired isolated bunch-crossings, i.e. bunch-crossings where only a single beam is present, can be used to study beam halo events. To estimate this background, artificial events are created by sampling two jets from a collection of jets passing both this trigger and the leading jet requirements from unpaired isolated bunch-crossings. All possible pairs of jets are used and the ETmiss <50 GeV requirement is applied to each constructed event. The number of jets passing the jet analysis selection and the fraction of constructed events satisfying theETmissrequirement are combined to estimate the background. This method, which also accounts for cosmic ray muon contamination, predicts 0.07±0.07 events. The large uncertainty is due primarily to the small statistics for jets passing all required cuts.
Backgrounds may also be present from combinations of these non-beam interactions: a beam-halo jet plus a multi-jet, or a beam-halo jet plus a jet due to a cosmic ray muon. After study, all were found to be negligible.
6 Systematic Uncertainties
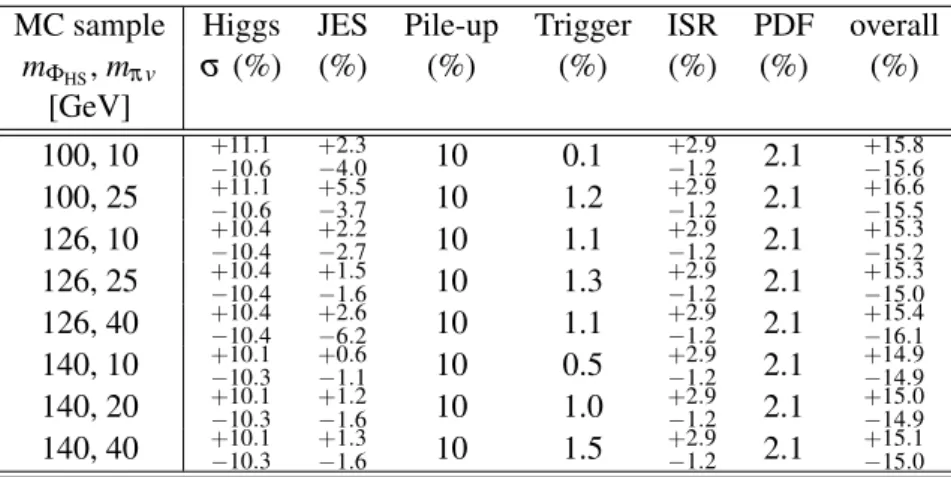
Table 2 presents a summary of systematic uncertainties associated with the signal sample. The overall uncertainty, taken as the sum in quadrature of all positive and negative contributions respectively, is listed in the last column. The signal MC statistical uncertainty is shown in Table 3 and it is accounted for in the statistical analysis. The overall normalization uncertainty of the integrated luminosity is 2.8%, found by following the procedure in Ref. [23]. The uncertainties on the Higgs boson production cross sections, which are equal to the uncertainties on theΦHSproduction cross sections, at √
s= 8 TeV are 10% [17].
The uncertainty on the signal MC samples due to parton distribution functions (PDF) is calculated by reweighting each event using three different PDF sets (MSTW2008nlo68cl [24], CT10 [25], and NNPDF2.3 [26]) and their associated error sets. The RMS change in acceptance for the error sets of each PDF are calculated, and combined with the difference in acceptances for each of the three PDFs.
Pile-up, extra collision events in the same bunch crossing as a hard scatter interaction, primarily affects the acceptance by adding extra tracks and degrading a jet’s track isolation. All MC samples are re-weighted to reproduce the observed distribution of the number of interactions per bunch crossing in the data. To determine if pile-up is simulated properly in the MC samples, a direct data - MC comparison on multijet samples is performed. The jetET, EMF,η,φ, associated tracks and timing distributions as a function of the mean number of pile-up interactions are compared in data and MC. Their ratios are
fitted with linear functions and the slopes (per unit pile-up) are taken as variations to be propagated in the signal MC samples.
The jet energy scale (JES) uncertainty is evaluated as a function of the jet EMF andη, following the same strategy used in thein situjet energy intercalibration [22]. The JES is rederived for low EMF jets for this analysis. The relative jet calorimeter response is studied by balancing the transverse momenta of dijets. The systematic uncertainty is obtained by comparing the pT-balance in data to the pT-balance in MC. This difference is used to calculate a difference in the JES in data and MC and is propagated to the signal MC samples to get a systematic uncertainty on the acceptance. This study also provided a useful performance comparison between data and MC on jets that look a lot like signal jets.
The simulation of the trigger is verified by comparing the performance of the trigger in data with the performance in MC, studying each trigger requirement individually: the jet ET requirement, the log10(EH/EEM) requirement, and the track isolation requirement. The comparison is done using the same multijet sample used in the evaluation of the multijet background. The difference between the performance for each requirement is applied in turn and a new acceptance is determined. The differences from the nominal acceptance are added in quadrature to determine the systematic uncertainty.
The simulation of Initial State Radiation (ISR) cannot be directly verified because it is difficult to identify uniquely ISR jets in data [27]. An incorrect ISR rate in the simulation will impact the acceptance by altering the number of jets in the event and by altering the boost of the Higgs boson. Two studies are performed, and their errors are summed. To study these effects, jets in MC are labeled as containing ISR if they contain a gluon with pT>2.0 GeV. The first effect is determined by altering the jet population event-by-event so that the number of ISR jets are halved or doubled. Jets initiated by aπvare not directly altered, but an added ISR jet may overlap with one of these jets. The acceptance is recalculated. Second, the ISR results in a non-zeropTof theΦHS. From Ref. [27], the Higgs pTspectrum has an uncertainty of 5%. It is expected that the uncertainty of thepTspectra of theΦHSshould behave similarly. To calculate the systematic uncertainty associated with this effect, the pT of ISR jets is conservatively varied by 5%
and the change in acceptance is observed.
The changes in acceptance from both sources of ISR uncertainty are taken as correlated systematic errors and added to get the total systematic for ISR simulation.
The incorrect simulation of Final State Radiation (FSR) will have only a negligible effect on the analysis’ acceptance. FSR can occur on a prompt or displaced jet. But even if displaced, the extra jet cannot degrade track isolation or deposit extra energy in the ECal if theπvhas decayed in the HCal.
MC sample Higgs JES Pile-up Trigger ISR PDF overall mΦHS,mπv σ(%) (%) (%) (%) (%) (%) (%)
[GeV]
100, 10 +11.1−10.6 +2.3−4.0 10 0.1 +2.9−1.2 2.1 +15.8−15.6 100, 25 +11.1−10.6 +5.5−3.7 10 1.2 +2.9−1.2 2.1 +16.6−15.5 126, 10 +10.4−10.4 +2.2−2.7 10 1.1 +2.9−1.2 2.1 +15.3−15.2 126, 25 +10.4−10.4 +1.5−1.6 10 1.3 +2.9−1.2 2.1 +15.3−15.0 126, 40 +10.4−10.4 +2.6−6.2 10 1.1 +2.9−1.2 2.1 +15.4−16.1 140, 10 +10.1−10.3 +0.6−1.1 10 0.5 +2.9−1.2 2.1 +14.9−14.9 140, 20 +10.1−10.3 +1.2−1.6 10 1.0 +2.9−1.2 2.1 +15.0−14.9 140, 40 +10.1−10.3 +1.3−1.6 10 1.5 +2.9−1.2 2.1 +15.1−15.0
Table 2: Summary of systematic uncertainties for the Higgs production cross-section, jet energy scale, pile-up, trigger, initial state radiation and the choice of parton distribution function, as a percentage of the signal yield. The last column reports the overall systematic uncertainty (including the luminosity).
7 Results and Exclusion Limits
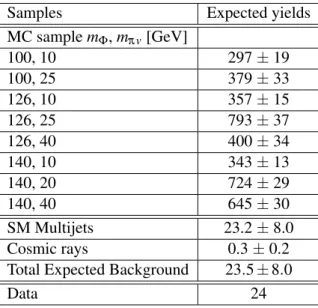
The global acceptance of the selected event topology ranges from 0.06% to 0.32% in the MC samples, and is a function ofmΦ,mπv and the proper decay length of theπv. Table 3 lists the expected number of events from all signal MC samples and the background expectation in 20.3 fb−1. ThemΦ=126 GeV mass samples use the SM Higgs boson cross sections of σSM = 19.0 pb for the gluon fusion process:
other production modes are ignored. The mΦ =100 GeV and 140 GeV samples use a cross-section of 29.7 pb and 15.4 pb, respectively. The number of events observed in data, 24, is also shown for comparison. No excess of events is observed since the expected background is 23.5±8.0. The CLs method [28] is used to derive an upper limit on the σ×BR for the ΦHS→πvπv process. A profile likelihood is used as the test statistics and a frequentist calculator is used to generate toy data. The likelihood includes a Poisson probability term describing the total number of observed events. Systematic uncertainties are incorporated as nuisance parameters through their effect on the mean of the Poisson functions and through convolution with their assumed Gaussian distributions. The number of expected events in signal MC, together with the expected background estimation, the observed collision events and all the systematic uncertainties are provided as input for computing the CLs value, which represents the probability for the given observation to be compatible with the signal + background hypothesis.
Samples Expected yields
MC samplemΦ,mπv[GeV]
100, 10 297±19
100, 25 379±33
126, 10 357±15
126, 25 793±37
126, 40 400±34
140, 10 343±13
140, 20 724±29
140, 40 645±30
SM Multijets 23.2±8.0
Cosmic rays 0.3±0.2
Total Expected Background 23.5±8.0
Data 24
Table 3: Summary of expected number of events, expected background present in the data sample, and the observed number of events in 20.3 fb−1. The error on the signal samples is statistical only, the error on the expected background is statistical and systematic. All results are normalized for a proper decay length of theπv of 1.5 m. The expected yields assume a SM cross section formΦ=126 GeV of σSM=19.0 pb and 29.7 pb and 15.4 pb formΦ=100 GeV andmΦ=140 GeV respectively. A 100%
branching ratio forΦHSis assumed.
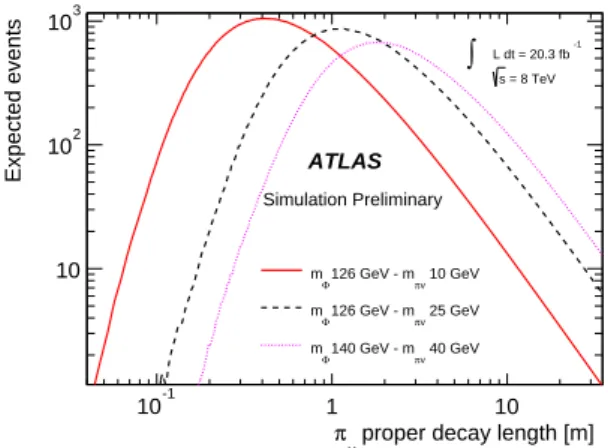
The acceptance is a function of theΦHSmass, theπvmass andπvproper decay length. To extrapolate the number of expected events at different proper decay lengths, a large sample ofπvdecays is generated in a range from 0 to 35 m, 2,000,000 events for each proper decay length. The resulting efficiencies are then converted into the number of final events shown in Fig. 4. Finally, Fig. 5 and Fig. 6 show the observed limit distribution for the three 126 GeVΦHSsamples and for the 100 and 140 GeVΦHSsamples respectively. The derived 95% CL excluded ranges of proper decay lengths are listed in Table 4 for the mΦ=126 GeV samples, under the alternative assumptions of a 30% BR or a 10% BR forΦHS→πvπv.
proper decay length [m]
πv
10-1 1 10
Expected events
10 102
103
10 GeV
πv
126 GeV - m mΦ
25 GeV
πv
126 GeV - m mΦ
40 GeV
πv
140 GeV - m mΦ
ATLAS Simulation Preliminary
-1 L dt = 20.3 fb
∫
= 8 TeV s
Figure 4: Number of events expected to pass the analysis selection in 20.3 fb−1as a function of theπv
proper decay length for threeΦHSandπvmass combinations. FormΦ=126 GeV the SM cross section σSM=19.0 pb was used. FormΦof 140 GeV a cross-section of 15.4 pb was chosen. A 100% branching ratio forΦHS→πvπvis assumed.
proper decay length [m]
v
π
10-1 1 10
SMσ / σ95% CL Upper Limit on -110 1
10 GeV πv 126 GeV - m mΦ
25 GeV πv 126 GeV - m mΦ
40 GeV πv 126 GeV - m mΦ
10 GeV πv 126 GeV - m mΦ
25 GeV πv 126 GeV - m mΦ
40 GeV πv 126 GeV - m mΦ
10 GeV πv 126 GeV - m mΦ
25 GeV πv 126 GeV - m mΦ
40 GeV πv 126 GeV - m mΦ
ATLAS Preliminary
BR 30%
BR 10%
-1 L dt = 20.3 fb
∫
= 8 TeV s
Figure 5: Observed 95% CL limits onσ/σSMformΦ=126 GeV as a function of theπv proper decay length: the solid line is for mπv=10 GeV, the dashed line is formπv =25 GeV, the dotted line is for mπv=40 GeV. Assuming σSM =19.0 pb, the horizontal solid line corresponds to BR = 30% and the horizontal dashed line to BR = 10%.
MC sample excluded range excluded range mΦ,mπv 30% BRΦHS→πvπv 10% BRΦHS→πvπv
[GeV ] [m] [m]
126, 10 0.10 - 4.38 0.13 - 2.30
126, 25 0.27 - 10.01 0.37 - 5.12
126, 40 0.54 - 12.11 0.86 - 5.62
Table 4: Ranges ofπv proper decay lengths excluded at 95% CL assuming a 30% and a 10% BR for a mΦ=126 GeV.
v proper decay length [m]
π
10-1 1 10
BR [pb]×σ95% CL Upper Limit on -1
10 1 10 102
10 GeV πv 100 GeV - m mΦ
25 GeV πv 100 GeV - m Φ
ATLAS Preliminary m
BR (100%) = 29.7 pb
× σ
BR (10%) = 2.97 pb
× σ -1 L dt = 20.3 fb
∫ s = 8 TeV
(a) Observed 95% CL limits formΦ=100 GeV.
proper decay length [m]
πv
10-1 1 10
BR [pb]×σ95% CL Upper Limit on
1 10 102
10 GeV πv 140 GeV - m mΦ
20 GeV πv 140 GeV - m mΦ
40 GeV πv 140 GeV - m mΦ
ATLAS Preliminary
BR (100%) = 15.4 pb
× σ
BR (10%) = 1.54 pb
× σ -1 L dt = 20.3 fb
∫ s = 8 TeV
(b) Observed 95% CL limits formΦ=140 GeV.
Figure 6: Observed 95% CL limits on σ×BR [pb] for mΦ=100 GeV (a) andmΦ=140 GeV (b) as a function of the πv proper decay length. In (a) the solid line is formπv=10 GeV, the dashed line is formπv=25 GeV. In (b) the solid line is formπv=10 GeV, the dashed line is formπv=20 GeV, the dotted line is for mπv=40 GeV sample. For reference, the solid horizontal line in (a) corresponds to σ=29.7 pb and in (b) corresponds toσ=15.4 pb, with the broken line plotted a decade below the solid line in each case.
8 Summary and Conclusions
A search for the decay of a light scalar boson (100−140 GeV) to a pair of long-lived neutral particles decaying in the ATLAS hadronic calorimeter is presented. The analysis is based on 20.3 fb−1 of pp collisions at √
s= 8 TeV collected in 2012 by the ATLAS experiment at the LHC.
No significant excess of events is observed over the background estimate, which is dominated by multijet events. Limits are set on the πv proper decay lengths for different light scalar and πv mass combinations.
References
[1] S.Chang, P.J. Fox and N.Weiner JHEP0608(2006) 068.arXiv:0511250 [hep-ph].
[2] S. Chang, R. Dermisek, J. F. Gunion and N. Weiner, Ann. Rev. Nucl. Part. Sci.58, (2008) 75-98.
[3] M. J. Strassler and K. M. Zurek, Phys. Lett. B651, (2007) 374–379,arXiv:0604261 [hep-ph].
[4] M. J. Strassler and K. M. Zurek, Phys. Lett. B661, (2008) 263–267,arXiv:0605193 [hep-ph].
[5] F. Englert and R. Brout, Phys. Rev. Lett.13, (1964) 321 . [6] P. Higgs, Phys. Lett.12, (1964) 132.
[7] G.S. Guralnik, C. R. Hagen, T. W. B. Kibble, Phys. Rev. Lett.13, (1964) 585.
[8] ATLAS Collaboration, Phys. Lett. B 716 (2012) 1,arXiv:1207.7214 [hep-ex].
[9] CMS Collaboration, Phys. Lett. B 716 (2012) 30,arXiv:1207.7235 [hep-ex].
[10] ATLAS Collaboration, New J. Phys. 13 (2011) 053033,arXiv:1012.5104.
[11] ATLAS Collaboration, Phys. Rev. Lett. 108, 251801,arXiv:1203.1303 [hep-ex].
[12] CMS Collaboration, JHEP 02 (2013) 085,arXiv:1211.2472 [hep-ex].
[13] D0 Collaboration, V. Abazov et al., Phys. Rev. Lett.103, (2009) 071801,arXiv:0906.1787.
[14] CDF Collaboration, T. Aaltonen et al., Phys. Rev. D85, (2012) 012007,arXiv:1109.3136.
[15] ATLAS Collaboration, JINST3(2008) S08003.
[16] T. Sjostrand, S. Mrenna, P. Skands, Comput.Phys.Commun.178:852-867 (2008), arXiv:hep-ph/0710.3820
[17] LHC Higgs Cross Section Working Group, S. Dittmaier, C. Mariotti, G. Passarino, and R. Tanaka (Eds.), CERN-2011-002 (CERN, Geneva, 2011),arXiv:1307.1347 [hep-ex].
[18] ATLAS Collaboration, Eur. Phys. J. C 70 (2010) 823–874, arXiv:1005.4568v1 [physics.ins-det].
[19] GEANT4 Collaboration, S. Agostinelli et al., Nucl. Instrum. Meth.A506(2003) 250–303.
[20] ATLAS Collaboration, JINST 8 (2013) P07015,arXiv.org:1305.2284 [hep-ex].
[21] M. Cacciari, G. P. Salam and G. Soyez,, JHEP 04 (2008) 0633,arXiv:0802.1189 [hep-ph].
[22] ATLAS Collaboration, Eur. Phys. J. C73, 3, (2013) 2304,arXiv:1112.6426 [hep-ex].
[23] ATLAS Collaboration, Eur. Phys. J. C73 (2013) 2518,arXiv:1302.4393 [hep-ex].
[24] A.D.Martin, W.J.Stirling, R.S.Thorne, G.Watt, Eur. Phys. J. C63 (2009) 189-285, 0901.0002, arXiv:0901.0002 [hep-ex].
[25] J. Gaoet. al, Phys. Rev.D89(2014) 033009,arXiv:1302.6246 [hep-ex].
[26] R. D. Ballet. al, Nucl. Phys. B867(2013) 244,arXiv:1207.1303 [hep-ex].
[27] D. de Florian, G. Ferrera, M. Grazzini, D. Tommasini, JHEP 1111 (2011) 064,arXiv:1109.2109 [hep-ex].
[28] A. Read, J. Phys. G28, (2002) 2693.
![Figure 6: Observed 95% CL limits on σ× BR [pb] for m Φ = 100 GeV (a) and m Φ = 140 GeV (b) as a function of the π v proper decay length](https://thumb-eu.123doks.com/thumbv2/1library_info/4017012.1541482/12.892.449.759.123.346/figure-observed-limits-gev-function-proper-decay-length.webp)