STUDY ON
MACROREGIONAL
STRATEGIES AND THEIR LINKS WITH COHESION POLICY
DATA AND ANALYTICAL REPORT FOR THE EUSAIR
NOVEMBER 2017
EUROPEAN COMMISSION DIRECTORATE-GENERAL REGIONAL AND URBAN POLICY
STUDY ON
MACROREGIONAL
STRATEGIES AND THEIR LINKS WITH COHESION POLICY
DATA AND ANALYTICAL REPORT FOR THE EUSAIR
ADDRESS COWI A/S Parallelvej 2
2800 Kongens Lyngby Denmark
TEL +45 56 40 00 00 FAX +45 56 40 99 99 WWW cowi.com
CONTENTS
1 Introduction to the Report 9
1.1 The EUSAIR – Background 9
2 State of the Macro-Regions (Task 1) 14
2.1 Introduction to Task 1 14
2.2 Methodological Framework for Task 1 15
2.2.1 Macro-regions 15
2.2.2 Indicator Analysis 16
2.2.3 Composite Benchmarks 17
2.3 Macroeconomic Overview 22
2.3.1 Economic Performance 23
2.3.2 Employment 27
2.3.3 Social Progress Index 30
2.4 Macro-regional Economic Integration 32
2.4.1 Labour Integration 34
2.4.2 Trade Integration 37
2.4.3 Capital Integration 39
2.4.4 Energy Integration 42
2.4.5 Accessibility Potential 45
2.4.6 Transnational Cooperation 48
2.5 Competitiveness 50
2.5.1 Overall Competitiveness 51
2.5.2 Business 60
2.5.3 Transport 64
2.5.4 Tourism 68
2.5.5 Fisheries 75
2.5.8 Blue Growth 77
2.5.9 Energy 79
2.5.10 Climate Change: Adaptation 86
2.5.11 Climate Change: Mitigation 89
2.5.12 Environment: Air Quality 92
2.5.13 Environment: Air Pollution 94
2.5.14 Environment: Waterbodies 96
2.5.15 Biodiversity: Natura 2000 101
2.5.16 Diversity of Land Cover (Shannon Evenness
Index) 104
2.5.17 Biodiversity: Coverage of marine protected
areas in Europe’s seas 106
2.5.18 Eco-Innovation Scoreboard 108
2.5.19 Resource Efficiency (composite of Eco
Innovation Scoreboard) 110
2.5.20 Bathing Water Quality 112
2.5.21 Agricultural Impact 114
2.6 Political, Institutional & Governance Indicators 118
2.6.1 Governance 120
2.6.2 Public Institutions 123
2.6.3 Voice and Accountability 125
2.6.4 Human Trafficking 127
2.6.5 Number of Drug Seizures 129
2.7 Meta-analysis 131
2.7.1 Macroeconomic Indicators 131
2.7.2 Macro-regional Integration 132
2.7.3 Competitiveness 133
2.7.4 Political, Institutional and Governance
arrangements 135
3 Review of the Macro-regional Strategies (Task
2) 138
3.1 Introduction to Task 2 138
3.2 Methodology for Task 2 139
3.3 Review of the EUSAIR (Task 2a) – Summary 145 3.4 Achievements of the EUSAIR (Task 2b) 147
3.4.1 Achievements – content-wise 147
3.4.2 Achievements – process-wise 151
3.5 Comparison of objectives of the EUSAIR with
achievements (Task 2c) 156
3.6 EUSAIR and ESIF (Task 2d) 159
3.7 EUSAIR TSG 4 – fact sheet 164
APPENDICES
Appendix A TASK 2a: Review of the EUSAIR
A.1 Introduction
A.2 Methodological Framework A.3 Blue Growth
A.4 Connecting the Region
A.5 Environmental Quality
A.6 Sustainable Tourism
Appendix B List of literature
List of Abbreviations
Abbreviation Stands for
AG Action Group
AP Action Plan
BSAP Baltic Sea Action Plan BSLF Baltic Sea Labour Forum
BSN Baltic Science Network
BSR Baltic Sea Region
BSR Stars PA Innovation (EUSBSR) flagship
BUP Baltic University Programme
CBC Cross Border Cooperation
CBSS The Council of the Baltic Sea States
CEF Connecting Europe Facility
CF Cohesion Fund
CISE Common Information Sharing Environment
DG Directorate-General
EAFRD European Agricultural Fund for Rural Development
EC European Commission
ECTS European Credit Transfer System
ECVET European Credit system for Vocational Education and Training
EFTA European Free Trade Association EMFF European Maritime and Fisheries Fund
ERASMUS+ EU Programme for Education, Training and Sport ERDF European Regional Development Fund
ESF European Social Fund
ESIF / ESI funds European Structural and Investment Funds ETC European Territorial Cooperation
EU European Union
EUSAIR European Union Strategy for the Adriatic-Ionian Region
EUSALP European Union Strategy for the Alpine Region EUSBSR European Union Strategy for the Baltic Sea Region EUSDR European Union Strategy for the Danube Region EWTCA East West Transport Corridor Association
HAC Horizontal Action Coordinator (EUSBSR)
HELCOM Baltic Marine Environment Protection Commission
HLG High Level Group
IALA Navigation in the IMO, International Association of Marine Aids to Navigation and Lighthouse Authorities
ICPDR International Commission for the Protection of the Danube River
IHO International Hydrographic Organisation IMO International Maritime Organisation
MA Managing Authority
MRS Macro-regional strategy/-ies
MS European Union Member States
MSFD Marine Strategy Framework Directive
NCs National Coordinators
NCM Nordic Council of Ministers
NDEP Northern Dimension Environmental Partnership NEFCO Nordic Environment Finance Corporation
NGO Non-governmental organisation
NUTS Nomenclature of territorial units for statistics
OP Operational Programme
OVI Objectively Verifiable Indicators
PA Policy Area / Priority Area / Pillar / Action area PA Education Policy Area Education (EUSBSR)
PA Innovation Policy Area Innovation (EUSBSR) PA Nutri Policy Area Nutrition (EUSBSR) PA Safe Policy Area Safety (EUSBSR) PA Transport Policy Area Transport (EUSBSR) PAC Policy / Priority Area Coordinator
RDP Rural Development Programme
S2W School to Work (PA Education (EUSBSR) flagship)
SG Steering Group
SME Small and medium-sized enterprises
SWD Commission Staff Working Document
TEN-T The Trans-European Transport Networks
TO Thematic objective
TNK Transnational Component
TSG Thematic Steering Group
VET Vocational Education and Training
WFD Water Framework Directive
1 Introduction to the Report
The 'Study on macro-regional strategies and their links with cohesion policy' consists of four task, which are summarised and concluded upon in the Final Report. The first two tasks (Task 1 and Task 2) have been reported on individually, and the present report contains the data and analysis for these two tasks for the European Union Strategy for the Adriatic and Ionian Region (EUSAIR).
This report begins with a brief section presenting the EUSAIR, followed by
›
the first major part (section 2) of the report, which contains the data and analytical report for Task 1, i.e. a description and an analysis of the overall context of the Adriatic and Ionian macro-region;›
thereafter, the second major part (section 3) contains the data and analytical report for Task 2, analysing the overall achievements of the EUSAIR and an evaluation of its contribution to strengthening the territorial cohesion objective of the EU. Task 2 is divided into the following four sub- tasks:›
Task 2a: Review of the EUSAIR›
Task 2b: Achievements of the EUSAIR›
Task 2c: Comparison of objectives of the EUSAIR with achievements›
Task 2d: EUSAIR and ESIF1.1 The EUSAIR – Background
The European Commission has in cooperation with the eight countries and stakeholders prepared the EU Strategy for the Adriatic and Ionian Region (EUSAIR). The third macro-regional strategy builds on the experiences and learnings from the existing macro-regional strategies (EUSBSR and the EUSDR.
Data and analysis report for Task 1 and Task 2
Structure of the report
The members of the strategies consist of four EU Member States and four (potential) candidate/pre-accession countries and the strategy intends to address the current differences in economic and administrative capacity of the region. The EUSAIR overall aim is to enhance the level of interconnection among the EU Member States and the non-EU countries, and at increased EU
integration.
This is attempted by addressing the common challenges and opportunities of the region through cooperation and coordination, thereby looking for potential synergies. The strategy has four transnational/transboundary areas: blue growth, transport and energy networks, environmental quality and sustainable tourism – with the objective of promoting "economic and social prosperity and growth in the region by improving its attractiveness, competitiveness and connectivity".1
Eight members of the Adriatic and Ionian Region are part of the EUSAIR as shown in the list below.
Table 1-1 Countries and key features of the EUSAIR
Countries and regions Key features
Four EU Member States
Croatia
Greece
Italy (14 regions)
Slovenia
Candidate and potential candidate countries:
Albania
Bosnia and Herzegovina
Montenegro
Serbia
Representing 70 million inhabitants or nearly 14% of the EU population
4 EU Member States as well as 4 non- EU members
1 http://www.adriatic-ionian.eu/about and COMMISSION STAFF WORKING DOCUMENT, Supportive Analytical Document, accompanying the document COMMUNICATION FROM THE COMMISSION TO THE EUROPEAN PARLIAMENT, THE COUNCIL, THE EUROPEAN ECONOMIC AND SOCIAL COMMITTEE AND THE COMMITTEE OF THE REGIONS concerning the European Union Strategy for the Adriatic and Ionian Region {COM(2014) 357 final}
{SWD(2014) 190 final}, SWD(2014) 191 final
Figure 1-1: The EUSAIR by NUTS2/Statistical Regions
The EUSAIR strategy includes four thematic pillars and a number of topics under each pillar, which are implemented through actions, as well as two cross-cutting aspects applicable across all pillars.
Table 1-2 EUSAIR: objective, policy areas and horizontal actions
Thematic pillars Topics Actions Cross-cutting aspects
1. Blue Growth 1. Blue technologies 2. Fisheries and aquaculture
3. Maritime and marine governance and services
No specific progress described in the progress report
Strengthening R&D, Innovation and SMEs Capacity building, including communication
2. Connecting the Region
1. Maritime transport
2. Intermodal connections to the hinterland 3. Energy networks
No specific progress described in the progress report 3. Environmental
Quality
1. The marine environment
2. Transnational terrestrial habitats and biodiversity.
No specific progress described in the progress report
4. Sustainable Tourism
1. Diversified tourism offer
2. Sustainable and responsible tourism management
No specific progress described in the progress report
The strategy and first action plan was adopted by the Council in October 2014.
The action plan builds on the experiences from the EUSBSR and EUSDR, incorporates the Maritime Strategy for the Adriatic and Ionian Seas, and is meant to "serve as a source of inspiration for the bodies in charge of turning the Action Plan as it now stands into a concrete tool for implementing the
Strategy".2
Governance of the EUSAIR consists of a number of actors and institutions as listed in Table 1-3. The Thematic Steering Groups and the Pillar Coordinators are key implementers of the strategy.
Table 1-3 Roles and responsibilities in the EUSAIR3 Actors/roles Description
EUSAIR Governing Board (GB)
Coordination level – Coordinates work of the four TSGs, provides strategic guidance for management and implementation of the strategy, co-chaired by the European Commission. Includes:
›
National coordinators›
Pillar Coordinators.›
Commission services: DG REGIO, DG MARE and DG NEAR. Other Directorates-General (DGs) may participate as appropriate.›
A representative of the European Parliament.›
A representative of the Committee of the Regions accompanied by a representative of its Adriatic-Ionian Interregional Group.›
A representative of the European Economic and Social Committee.›
The Permanent Secretariat of the Adriatic-Ionian Initiative.›
Representatives of the Managing Authority of Interreg ADRION and of the EUSAIR Facility Point under the programme.National Coordinators Two formally appointed representatives of each country (from MoFA and the national authority responsible for EU funds)
Pillar Coordinators of policy areas/horizontal actions (PAC and HAC)
Coordinate the pillars – 2 formally appointed officials from an EU-MS and a non-EU state (except for pillar 2, which has 4 coordinators), chairing the Thematic Steering Groups.
Thematic Steering Groups (TSG)
Implementation level – Implement the strategy in relation to the respective pillars, considering which projects/action best contribute to achieving the strategy's objectives.
2 COMMISSION STAFF WORKING DOCUMENT, Action Plan, Accompanying the document:
COMMUNICATION FROM THE COMMISSION TO THE EUROPEAN
PARLIAMENT, THE COUNCIL, THE EUROPEAN ECONOMIC AND SOCIAL COMMITTEE AND THE COMMITTEE OF THE REGIONS concerning the European Union Strategy for the Adriatic and Ionian Region; SWD(2014) 190 final
3 Roles and responsibilities of the institution implementing EUSAIR Strategy and action
plan
Governance
STATE OF THE
MACRO-REGIONS
EUSAIR (TASK 1)
2 State of the Macro-Regions (Task 1)
2.1 Introduction to Task 1
This report presents the results of Task 1 of the 'Study on Macro-Regional Strategies and their links with cohesion policy' for the Adriatic and Ionian Sea Macro-regional Strategy. Three other reports of the same structure cover the remaining three macro-regions: the Baltic Sea, the Alpine and the Danube Strategy.
This report provides an 'indicator-based description and analysis of the overall context of [the] macro-regions'4. This report aims further to provide a context that is detached from the Macro-regional Strategy concept and does not provide an evaluation of the Macro-regional strategies objectives; which is addressed in the Task 2 report. The description and analysis is structured along four specific headlines: macro-economic overview; macro-regional integration;
competitiveness; and the political, institutional and governance context. There is a chapter on each of these dimensions, followed by a synthesised meta-analysis.
Prior to these indicator-based chapters, the report provides a brief methodological overview.
For each indicator that is described, the report first provides a graphical
illustration of the indicator values. This is followed by a description and analysis of the indicator values in question.
4 The study Specifications
2.2 Methodological Framework for Task 1
2.2.1 Macro-regions
The concept of Macro-regions refers to a grouping of regions that principally share a common functional context, such mountains, sea-basins, or river-basins, and 'in which the priorities and objectives set out in the corresponding strategy can be properly addressed'5. While this grouping of territories into macro-regions thus follows a functional logic, it remains an artificial construct in terms of a governance or territorial unit. Therefore, contextual information for a macro- region as a whole is not readily available. This is reflected in the fact that no selection of relevant information is available on an aggregated level.
The family of reports under Task 1 aims at filling this gap. They seek to provide a set of relevant information that closes this gap and draws valid inferences on the overall context of the macro-region in question.
More specifically, the context of the macro-regions is described through a set of indicators on four dimensions (macroeconomic overview, integration,
competitiveness and the institutional / governance context). The four types of indicators provide a research framework upon which the Task builds, and essentially reflect the EU’s principal policy of Economic-, Social-, and Territorial Cohesion as follows:
›
Macroeconomic indicators reflect the (socio) economic context of the individual economies as well as the macro-region as a whole. Further, they also serve as overview indicators on the overall social- and economic cohesion.›
Macro-regional economic integration indicators describe the intensity of cooperation, integration and (economic, cultural) exchange among the countries of a macro-region, and essentially reflect the state of territorial cohesion.›
Competitiveness indicators provide a more detailed insight into the (broadly defined) competitiveness of countries and macro-regions on various aspects. These indicators provide inference on factors that affect the three Cohesion objectives.›
Political, institutional and governance indicators mirror the political state of a macro-region in terms of governments’ accountability or effectiveness of legislation. These indicators mirror the likely capacity to effectively pursue interventions on the economic, social as well as territorial cohesion.
5 Study specifications The Macro-Regional
Framework
Indicators to provide an overall context of the Macro-regions
The reports provide a picture of the status of the macro-region in question, of the developments inside the macro-regions and when possible (i.e. data allows) a comparison of the current results with the results of the past. The family of Task 1 reports thus explores and analyses the overall context of the four
existing Macro-Regional Strategies (MRS), namely the EU Strategy for the Baltic Sea Region (EUSBSR), the EU Strategy for the Danube Region (EUSDR), the EU Strategy for the Alpine Region (EUSALP) and the EU Strategy for the Adriatic and Ionian Region (EUSAIR). The analysis is thus as such detached from the contents of each of the macro-regional strategies. Rather, it focuses on the comparable assessment of the socioeconomic and macro-regional integration status within the macro-regions, as well as on the comparable investigation of their performance regarding competition and efficient institutions and
governance.
2.2.2 Indicator Analysis
A first step of Task 1 focused on the construction of a set of indicators which are relevant to macro-regions on a macro-regional level. For this, indicators were first identified by the consultant, and the final selection was done in close cooperation with DG REGIO. Consultations with DG REGIO and members of the Steering Committee served to ensure an eventual comprehensive and relevant picture of the macro-regions.
For the identification of indicators statistical units had to be considered. Given that the macro-regions in some cases consist of regions and not entire
countries, the geographical level of the analysis is principally conducted at level 2 of the Nomenclature of territorial units for statistics (NUTS-2), as defined by the EU. However, in some cases data are not available at NUTS-2 level of aggregation but at NUTS-1 level or country level only. In these cases the missing information for the NUTS-2 level has been substituted by data from the first available aggregation level above it, i.e. if statistical information on a measure was available at NUTS-1 level, the same performance measure was assumed to apply at the NUTS-2 level. For some variables only country-specific information was available. This applies for example to the macro-regional integration indicators.
The statistical units for regions outside the EU were chosen according to the countries’ own aggregation at NUTS-2 level (equivalent to SR36) as defined by the EU. Only very few data were available at a level comparable with the NUTS- 2 level of the EU. Furthermore, most analysed countries outside the EU are quite small, and most data for the regions outside the EU have therefore been chosen at country level of aggregation.
6 The NUTS classification is defined only for the Member States of the EU. Eurostat, in agreement with the countries concerned, also defines a coding of statistical regions (SR) for countries that do not belong to the EU but are either candidate countries, potential candidate countries or countries belonging to the European Free Trade Association (EFTA). Eurostat and Serbia have not yet agreed on statistical regions for the country.
Choosing macro- regionally relevant indicators
Emphasis on regional indicators where possible
The main sources of data used in this report are the Eurostat-Database supplemented with data from the World Bank Database, OECD, UNCTAD, COMTRADE, EEAA, ESPON project. Most NUTS-2 data are published with a time lag of one or two years. In order to create a common basis across the macro- regions and the themes, the description and analysis are generally based on data available for the year 2015 or the latest available data for all considered regions. When possible, a comparison is provided between the latest available year data and the data for 2008 for the Baltic Sea and Danube macro-regions.
The year 2008 also is the year just before the creation of these two macro- regional strategies. For the two newer macro-regions, the Alpine and Adriatic Ionian macro-regions it is the year 2011 that is compared to 2015. The year 2011 is the year just before the creation of the Alpine and Adriatic Ionian macro- regions and it offers a timespan long enough in order for changes to become visible.
Each of the quantitative and qualitative indicators identified as best describing the socio- economic context, integration, as well as the competitiveness, institutional and governance situation of the four macro-regions was subject of an assessment against the RACER framework. RACER stands for “Relevant, Acceptable, Credible, Easy, Robust” and enables a judgement on each indicator’s properties and qualities. Each RACER criterion has been assessed on a three- level scoring scale (green: criterion completely fulfilled; orange: criterion partly fulfilled; red: criterion not fulfilled). Based on the strengths and weaknesses of each of the quantitative and qualitative indicators across all the RACER criteria, a list of indicators was selected out of a pool of indicators considered.
The indicators which complied with all RACER criteria (green overall) have been definitely included into the set of selected indicators; those, which did not comply with all RACER criteria (a mix of green, red and yellow) and were not of high importance for the considered macro-region have been left outside.
2.2.3 Composite Benchmarks
As it is not possible to monitor all dimensions of a macro-region with one single indicator, a larger number of indicators has been selected. An additional challenge is that a macro-region’s picture comprises the four dimensions (macro-economic, macro-regional integration, competitiveness and political- institutional- governance) but each dimension cannot be captured by one single quantitative indicator.
In order to cope with this challenge, all indicators with a common theme have been aggregated into composite indices. Composite indices bundle separate (component) indicators into one index which allows the values of the whole bundle expressed as only one measure7; examples of such indices are the Human Development Index, Environmental Sustainability Index, and stock
7 See http://www.investopedia.com/terms/c/compositeindex.asp Composite Indices
indices like the NASDAQ Index. In the course of gathering indicator data, the data have been grouped into sets of related indicators according to appropriately identified themes. Themes have been chosen so that the indicators together represent an “essential feature” of and within a macro-region. The individual indicators have been aggregated without any weights and each composite index hence represents the unweighted average of all indicators.
Different indicators generally apply different scales, such as percentages, currencies or categorical data (e.g. chemical status of waterbodies). The
aggregation of such different scales only makes sense for comparable variables.
Each indicator therefore needs to be normalised (to a common scale) before these can be combined into a composite index. For this aggregation, the proprietary ‘emb’ model (equilibrated medial benchmarking) has been applied8. The benchmarking analysis focuses on the four macro-regions and the four dimensions inside each macro-region compares countries and/or NUTS-2 regions inside the individual macro-region based on a common reference framework of EU countries. The reference framework for each component indicator or composite index is delineated by the “top performer” of EU28 countries (benchmarked at 150), the “lowest performer” (50) and the median performer(s) at 1009. A high benchmarking score always reflects a more
“desirable” situation. Taking unemployment rates as an example, higher scores reflect lower unemployment rates. In this way, the benchmarking results can always be read as showing whether – and to what extent – they are above or below the median in the EU at country level. This common framework enables observations to be made across different regions, even though the main focus remains within each macro-region.
The benchmark is always scaled on a country level against all EU28 Member States. The benchmarking score hence indicates a country’s or a region’s relative position to all EU28 countries. This means in turn that one can observe values above 150 and below 50 in the cases summarised in the table below.
8 For the Proprietary Method of constructing indices from multiple indicators refer to: Fink, M. et al. (2011), Measuring the impact of flexicurity policies on the EU labour market, IHS Research Report, commissioned by DG EMPL (Employment, Social Affairs and Inclusion).
9 The median is the point in a dataset in which a split of that dataset results in two sets with an equal number of data points. See http://www.investopedia.com/
terms/m/median.asp for more details Composite
Benchmarks
Table 2-1: Cases with benchmarking scores above 150 and below 50
Case Explanation
Regional analyses (NUTS-2 level)
A NUTS-2 region may out-/underperform its country. Such as Stockholm (SE), performing higher than Sweden as a whole.
Non-EU countries A non-EU country is not included in the benchmarking scale. Thus, a country like Ukraine may score above 150 or below 50, as they are not included in the scaling.
Macro-regional Integration analyses
Countries that are stronger/weaker integrated in a macro-region than the EU’s ‘top performing’/’bottom performing’ country is integrated in the EU28 (see paragraphs below).
For example, Germany’s trade integration with countries in the Danube region comprises only a small share of its trade with all EU28 countries and is at the same time lower than that of the EU’s
‘bottom performer’.
The chapter on integration includes new integration indices. These IHS- proprietary indices cover respectively Labour Integration (three indices plus a composite of these 3 components), Capital Integration (Foreign Direct
Investment (FDI), Energy Integration, and Trade Integration. Each of these seven indices is constructed on a similar principle, which is outlined as follows.
When the amount or value of labour, capital etc. supplied by a country to another country (a ‘partner’), or, equivalently, received from a partner, increases, it can be said that the level of integration between the two has increased. Considering a particular group of countries, the focus is on the bilateral flows between them. For the task of estimating integration within macro-regions, i.e. between individual countries belonging to the macro-region in question, the first step is the development of a “Bilateral Flow Matrix”, as shown in the table below.
Table 2-2: Energy Integration Example (Baltic Sea), energy exports (kTOE)
Partner Denmark Germany Estonia Latvia Lithuania Poland Finland Sweden Denmark 0.0 1,917.4 0.0 0.0 0.0 0.0 505.6 3,503.5
Germany 3.5 0.0 0.0 0.0 0.0 916.5 0.0 0.0
Estonia 0.0 0.0 0.0 522.7 0.0 0.0 25.6 0.0
Latvia 0.0 0.0 0.4 0.0 293.9 0.0 0.0 0.0
Lithuania 0.0 0.0 79.7 14.4 0.0 51.4 0.0 0.0
Poland 0.0 251.7 0.0 0.0 5.6 0.0 0.0 1.7
Finland 0.0 0.2 432.8 0.0 0.0 0.0 0.0 0.1
Sweden 477.6 168.3 0.0 0.0 0.0 302.0 1,484.4 0.0
Immediately, certain strong relationships between certain country-pairs are visible. What such a table of absolute values does not make clear is the
‘importance’ of a bilateral relationship for a specific country. A second step Integration Indices
therefore converts the data to a relative share of all its exports (or foreign investments, migration flows, remittances) (in worldwide).
Table 2-3: Energy Integration Example, Share of total exports to partner country (in %) Partner Denmark Germany Estonia Latvia Lithuania Poland Finland Sweden
Denmark 0.0 11.8 0.0 0.0 0.0 0.0 3.1 21.5
Germany 0.0 0.0 0.0 0.0 0.0 1.5 0.0 0.0
Estonia 0.0 0.0 0.0 24.8 0.0 0.0 1.2 0.0
Latvia 0.0 0.0 0.0 0.0 13.8 0.0 0.0 0.0
Lithuania 0.0 0.0 0.9 0.2 0.0 0.6 0.0 0.0
Poland 0.0 1.2 0.0 0.0 0.0 0.0 0.0 0.0
Finland 0.0 0.0 5.8 0.0 0.0 0.0 0.0 0.0
Sweden 2.6 0.9 0.0 0.0 0.0 1.6 8.1 0.0
The new integration index provides a common basis for measuring integration in each of the four macro-regions, just as the case for every other indicator
considered in this study. Given that the number of countries in the macro- regions vary, the total share of e.g. energy exports to the macro-region would grow with the number of member countries. Therefore, to provide a measure of integration that is not affected by the size of a macro-region, the chosen measure for each country’s degree of integration within its macro-region is its per partner share (ppShare); i.e. the average flow to a destination country.
Table 2-4: Energy Integration Example, resulting per partner share Partner ppShare
Denmark 5.21 Germany 0.22 Estonia 3.72 Latvia 1.98 Lithuania 0.23 Poland 0.18 Finland 0.83 Sweden 1.90
In the case of integration indices, the procedure to establish the benchmark is identical in formation as for the other indices, except that in this case the bilateral flow matrix is 28 x 28 for the EU28. Thus, the benchmark is defined by the average share that each Member State exports to the EU28 countries. This results in a per partner share of each Member State, but to the whole EU28, instead of a macro-region.
In other words, using the per partner share as a unit of measure enables the degree of integration within each macro-region to be benchmarked against the degree of integration in the EU as a whole. This provides a deep insight into the question of whether the common geographical basis (and more) for the macro- regions is actually, and to what extent, of particular relevance compared to the Benchmarking
Integration Indices
entire setting of all EU countries, which may in general cover a more or less contiguous area, but which course also comprise (even more) multiple regional contexts.
As mentioned in Table 2-1 above, there are many cases found to score well below 50 or well above 150. This is entirely consistent: The reason, expressed mathematically, is that the two-dimensional flow matrices gives rise to country index values in macro-regions that are not subsets of the EU index; for non- integration indices, in contrast the (EU) country indicator values form by definition a subset of the EU28.
Each composite index is accompanied by a figure that consists of two maps and one bar chart. Both maps show the composite index values for each NUTS region in differing colour schemes. The first map provides a coloured illustration of the scores on a scale from 50-150 and reflects how a given region performs on the EU28-wide level (i.e. 100 reflects the EU28 median). Any regions scoring outside this defined range are displayed as 50 or 150.
The scale of the second map is in turn defined by the lowest and highest composite index scores found for the macro-region and seeks to highlight the differences between the high and low performing regions of that macro-region more clearly. As a result, the range of this scale depends on the maximum and minimum scores for each individual composite index in a given macro-region.
The bar chart identifies the two regions with the highest and lowest composite index scores in each country, accompanied by the (benchmarked) scores of the index’s components. The colouring scale ranges from 50 to 150.
Synchronous to this report, a digital toolbox has been developed. The digital toolbox comprises a set of data files for each of the four macro-regions. Each file contains data sheets for each indicator used to assess the context of the macro- regions. As mentioned above, data has been organised separately for the appropriate NUTS regions and countries in each of the four macro-regions, and each indicator, or composite, corresponds to an excel sheet for each macro- region. The excel sheets have been grouped according to the four dimensions (macro-economic, macro-regional integration, competitiveness and political- institutional- governance). Furthermore, within each dimension, sheets have been grouped according to agreed aggregated compositions i.e. as composite indices).
An index page (usually on the first data sheet of each file) will enable users to directly find the data sheet for a named indicator (by clicking on an excel hyperlink).
A second set of excel files has been established for documenting the results of the benchmarking process. There is a file for each individual macro-region. This contains datasheets corresponding to indicators, grouped according to the above-mentioned four dimensions. Within these, they are further grouped according to the agreed aggregated composition of composite indices.
Illustrative Maps
Digital Toolbox
2.3 Macroeconomic Overview
In this chapter the overall macroeconomic state of the macro-region is assessed through analyses focused on three major themes: economic performance, employment, and social equality. The macroeconomic indicators are used to reflect the (socio) economic context of the individual economies as well as of the macro-region as a whole.
The table below provides an overview of the indices that are presented in this chapter:
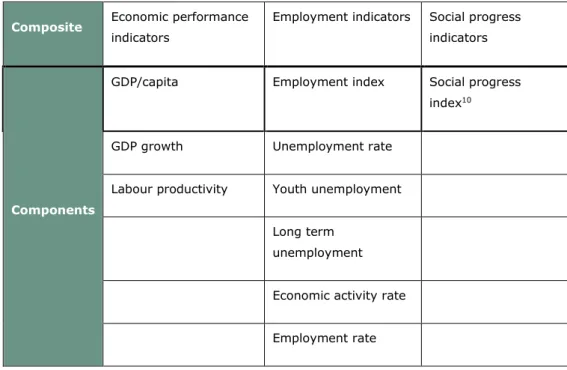
Table 2-5: Overview of macro-economic overview indicators Composite Economic performance
indicators
Employment indicators Social progress indicators
Components
GDP/capita Employment index Social progress index10
GDP growth Unemployment rate
Labour productivity Youth unemployment
Long term unemployment
Economic activity rate
Employment rate
10 A composite index based on 53 indicators covering basic human needs, conditions for well-being and opportunity to progress
2.3.1 Economic Performance
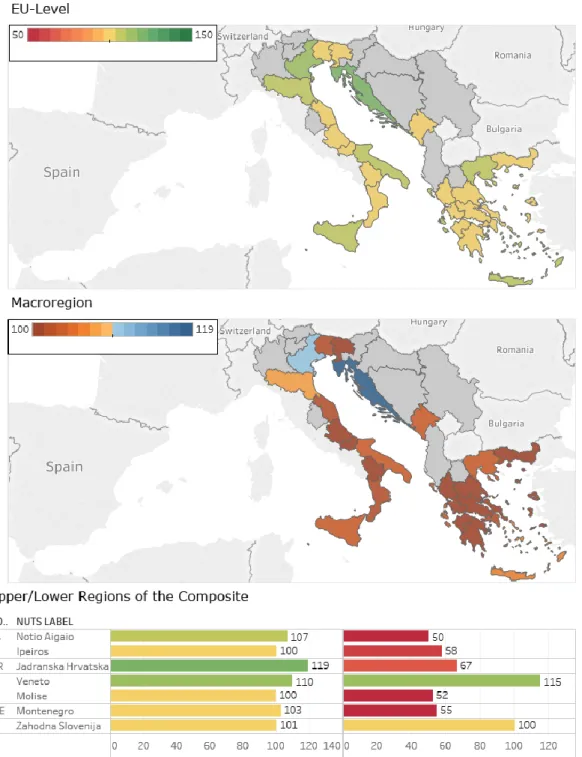
Figure 2-1: Economic Performance by NUTS-2 in 2015, on an EU-wide (top) and Macro- regional (middle) comparison. The bottom figure shows the Upper/Lower Regions, including their components
Text Box 2-1: Explanation of indicators: ‘Economic Performance’
To assess the economic performance on NUTS-2 regions inside the macro-region three indicators: regional Gross Domestic Product (GDP) per capita (at purchasing power parity), Real GDP growth rate and Labour Productivity have been bundled into one composite indicator: Economic performance index.
Regional gross domestic product (GDP) is used for the measurement and comparison of the economic activity of regions. It is the most important indicator used in the EU's regional policy for the selection of regions eligible for support under the investment for growth and jobs goal of the EU. GDP is the standard measure of the value of the production activity (goods and services) of resident producer units.11 For this indicator regional data are available with a time lag of two years. Thus regional GDP data for the reference year 2015 have been released at the beginning of 2017. Real GDP is usually a proxy for economic prosperity. GDP per capita, however, does not reflect the equality of distribution of that prosperity, so it is not representative for many social issues.
The real percentage-growth rate of gross value added (i.e. Real GDP growth) allows the identification of the most and less dynamic regions in the EU and the non-EU regions inside the macro-region.
Labour Productivity has been calculated as Regional Gross Value Added (GVA) per employee. According to the OECD, Labour Productivity measures “how efficiently
production inputs, such as labour and capital, are being used in an economy to produce a given level of output.” Productivity is considered a major source of economic growth and competitiveness. It is used as a main indicator to assess a country’s performance and to perform international comparisons. Over time a country’s ability to raise its standard of living depends to a great extent on its ability to raise its output per worker. There are different measures of productivity.
An investigation of growth-generating economic activities on the regional level requires the availability of relevant regional indicators. Compared to data on the national level, the availability of regional data is much more limited. Moreover, regional data are published with sizable time lags which in the case of national accounts may amount to two years.
The composite indicator Economic performance shows a mixed picture regarding the economic development of the NUTS-2 regions of the Adriatic/Ionian macro- region (see Figure 2-1). The North-Western part of the macro-region performs well; i.e. above the EU28 median performance. The Eastern part of the macro- region belongs in contrast to those regions performing below the EU28 median.
Overall, it can be seen that the economic performance differs between the urban and rural regions. Concerning urban regions all the highest performers in 2011 and 2014 are the three NUTS-2 regions in Northern Italy (Provincia Autonoma di Bolzano, Lombardia, and Provincia Autonoma di Trento). Urban regions in the middle range are the Italian NUTS-2 regions located in the Northern and Central
11 https://www.oenb.at/en/Statistics/Standardized-Tables/Economic-and-Industry- Indicators/Economic-Indicators/nominal-gpd-growth-expenditure-side.html
part of the country (e.g. Emilia-Romagna, Veneto, Friuli-Venezia Giulia), but also in the regions Attiki in Greece and Zahodna Slovenija in Slovenia. All of these are urban regions with a high population density. The lowest performers in the macro-region are all located in Greece, Croatia, and Albania12. These are regions with a high share of rural population.
The ongoing fiscal consolidation and credit constraints in Greece as a result of the debt crisis, with contracting consumption and investment is thus mirrored in declining economic performance when measured by the composite index.
Croatia was confronted with a six year recession, following the economic crisis and the country has experienced negative GDP growth over the entire period from 2009 to 2014. The long lasting recession was due to deep structural problems and difficulties in adjusting the economy after the initial recession. In Slovenia, the value of this indicator exhibits a decline for the NUTS-2 regions.
This is due to a long lasting banking crisis in Slovenia.
As the data available for the EU candidate and potential candidate countries for the investigated indicators (Table 6) differ from the data available for the EU- countries in the macro-region, these data have not been included in the
composite indicator. The data are presented and analysed below. No comparable data were available for the candidate and potential candidate countries for the indicator labour productivity.
Table 2-6: GDP per capita in (potential) candidate countries GDP per capita (current
prices) (EUR) GDP per capita in PPS (%, EU-27=100)
2011 2014 2011 2014
Albania 3,191 3,440 29 28
Montenegro 5,211 5,436 41 39
Serbia 4,619 4,635 36 35
Bosnia and
Herzegovina 3,432 3,641 29 28
Source: Eurostat.
As the table above shows the non-EU countries in the macro-region show much lower levels of GDP per capita compared to the EU countries. At the same time GDP per capita decreased slightly in all countries in 2014 compared to 2011.
This was due to the modest GDP performance of these countries with low and negative growth rates (Table 2-7). All these countries need to implement structural reforms and improve their business and investment environment in order to boost GDP growth and make progress in the convergence process.
12 Albania is not part of the composite index due to incomplete data. However, Albania exhibits a real GDP per capita (at purchasing power parity) benchmark of 29 and a GDP growth close to the EU28 median.
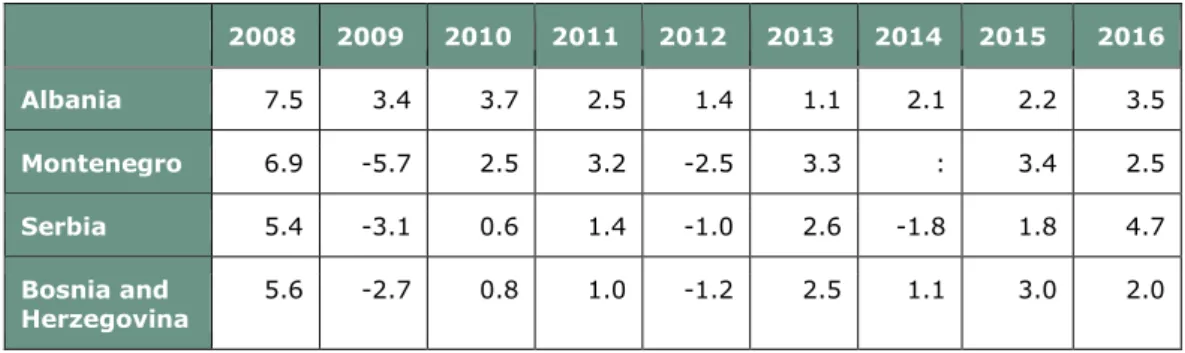
Table 2-7: GDP Growth rates in (potential) candidate countries, in %
2008 2009 2010 2011 2012 2013 2014 2015 2016 Albania 7.5 3.4 3.7 2.5 1.4 1.1 2.1 2.2 3.5 Montenegro 6.9 -5.7 2.5 3.2 -2.5 3.3 : 3.4 2.5 Serbia 5.4 -3.1 0.6 1.4 -1.0 2.6 -1.8 1.8 4.7 Bosnia and
Herzegovina 5.6 -2.7 0.8 1.0 -1.2 2.5 1.1 3.0 2.0 Source: Eurostat, ebrd, wiiw.
2.3.2 Employment
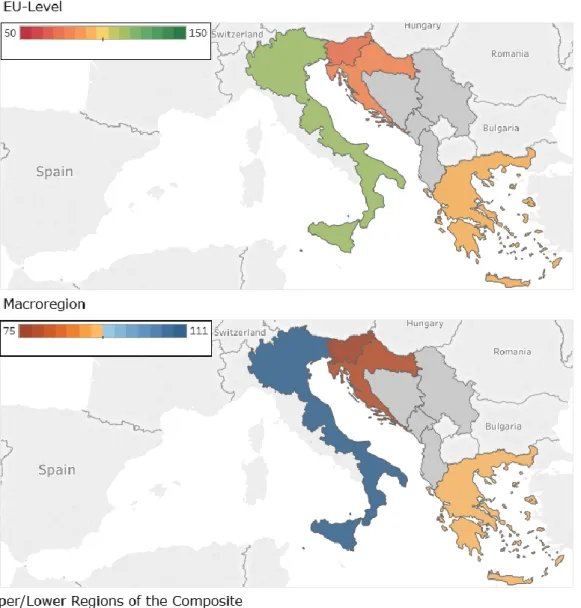
Figure 2-2: Employment by NUTS-2 in 2015, on an EU-wide (top) and Macro-regional (middle) comparison. The bottom figure shows the Upper/Lower Regions, including their components
Text Box 2-2: Explanation of the indicator: 'Employment'
Labour market statistics are crucial for many EU policies. There are significant labour market disparities within the EU territory as well as in candidate/neighbour countries. The first figure on the left shows the employment situation from the perspective of a
composite index based on the following indicators: i) Economic activity rate, which describes an economy’s ability to attract and develop a great share of human capital from its population; ii) Employment rate combined with Unemployment Rate, providing useful information about the ability to utilize available labour; iii) Youth unemployment rate, as an indicator showing the match between the existing skills within the young people and the employment opportunities offered by the regional economies; iv) and Long term unemployment rates, which indicate inefficient labour markets. More elaborate descriptions of the composite indicator can be found in the methodology.
Judged by the composite indicator, most regions of the macro-region are
confronted with employment challenges in 2015. Thus, within the EU as a whole, the lowest values of the employment composite index are seen in the NUTS-2 regions of Greece and Croatia; in most of Italy; and in one region of Slovenia. In the macro-region, there are only three NUTS-2 regions with a value above the EU-median: Bolzano/Bozen and Trento (IT) and Zahodna Slovenija (SI).
Furthermore, a couple of NUTS-2 regions in Italy (Lombardia, Veneto, Friuli- Venezia Giulia, and Emilia-Romagna) as well as the region Vzhodna Slovenija (SI) show values which are only slightly below the EU-median. Italy exhibits a dramatically non-cohesive picture, with Calabria (IT) scoring worse in several aspects than the EU’s “bottom”-performing Member State. On the other end of the scale, Bolzano/Bozen (IT) shows solid performances. Comparing the indicator values of 2015 with those for 2011 furthermore shows a deterioration of the performance in all the regions in the macro-region.
The performance below the median in these regions can be attributed to low activity and low employment, and high unemployment rates. These are to a certain extent due to the economic and financial crisis, but also the deeper structural problems in the Greek and Italian economy can be argued to have an impact. By tradition, the participation of female workforce is low in these countries. Many regions in Greece, Italy, and Croatia are also confronted with high youth unemployment rates. Youth unemployment rates are higher than 50 % in regions in Greece and Italy and higher than 40 % in Croatia. Following the economic and financial crisis, Croatia was confronted with a six year lasting recession. The return to growth was achieved in 2015.
As for the EU candidate and potential candidate countries for three of the above indicators (Table 2-8) the definitions differ from those for the indicators available for the EU-countries in the macro-region, these countries have not been
included in the composite indicator. The data are presented and analysed below.
The candidate countries Montenegro, Albania and Serbia, and potential candidate Bosnia-Herzegovina show a similar pattern as Italy, Croatia and Greece with low activity and employment rates and high unemployment. The lowest employment rates among these countries can be found in Bosnia- Herzegovina with 39 % in 2015, the highest in Albania and Serbia with 53 % and 52 % respectively. The unemployment rates show double digit values in all candidate and potential candidate countries, with the highest in Bosnia-
Herzegovina (28 %). The highest youth unemployment rates were recorded in Bosnia-Herzegovina (62 % in 2015) and in Serbia (43 % in 2015).
Table 2-8: Employment and Unemployment in (potential) candidate countries Economic
activity rate Unemployment Youth
unemployment Long term
unemployment Employment rate
2008 2015 2008 2015 2008 2015 2008 2015 2008 2015
Albania 62.0 64.2 13.0 17.1 27.2 39.8 8.5 11.3 53.8 52.9 Montenegro 61.2 62.6 16.8 17.5 : 37.6 13.4 13.6 50.8 51.4 Serbia 62.7 63.7 13.6 17.6 35.2 43.2 9.7 11.3 53.7 52.1 Bosnia and
Herzegovina 53.5 54.6 23.5 27.9 47.5 62.3 20.3 22.8 40.7 39.2 Source: Eurostat.
For the Western Balkan countries all three unemployment indicators show high levels. Moreover, they also exhibit a rising trend from 2008 to 2015 which hints to persistent structural problems on the labour markets of these countries.
These may be due to a mismatch between the available qualifications and the requirements of the employers and also to an active informal job market. The economic activity and employment rates are relatively low, whereas a gender gap can be observed. These rates are significantly lower for women compared to men. This is due to the traditional role of women and low availability of childcare facilities in these countries. In all Western Balkan countries informal
employment is high accounting to at least 30%.13
13 International Labour Organization (2011): A comparative Overview of Informal Employment in Albania, Bosnia and Herzegovina, Moldova and Montenegro. URL:
http://www.ilo.org/wcmsp5/groups/public/@europe/@ro-geneva/@sro- budapest/documents/publication/wcms_167170.pdf
2.3.3 Social Progress Index
Figure 2-3: Social Progress Index by NUTS-2 in 2016, on an EU-wide (top) and Macro- regional (middle) comparison. The bottom figure shows the Upper/Lower Regions, including their components
Text Box 2-3: Explanation of the indicator: ‘Social Progress Index’ 14
Social progress and economic development exhibit overall a correlation. Those regions with the highest GDP per capita in the Adriatic-Ionian macro-region are thus also the macro-region’s best performing regions in the Social Progress Index. That is, Provincia Autonoma di Bolzano/Bozen, Provincia Autonoma di Trento, Friuli Venezia Giulia, and Umbria in Italy with scores in the range of 93 to 113 points. These regions register the highest scores for the indicators Basic Human Needs and Foundations of Wellbeing. The lowest scores are to be found in the NUTS-2 regions Sterea Ellada, Peloponnisos in Greece and Puglia, Calabria and Sicilia in Italy with scores around 65 points. The indicators ‘Foundations of Wellbeing’ (i.e. ‘Access to Information and Communication’ and ‘Environmental Quality’) and ‘Opportunity’ (‘Personal Rights’) are responsible for the low index scores in these regions. These are also the regions with the lowest level of economic development. A correlation between the GDP per capita and
performance on social progress can be noticed for these regions. The remaining Greek and the Croatian regions show a slightly better performance with scores in the range of 70 to 93 points.
The Adriatic-Ionian macro-region is diverse when it comes to Social Progress.
Overall, there is a notable correlation with economic development. The
benchmarking scores range between 65 and 120, which implies that no region is a particularly high or low performer. The macro-region as a whole lags generally behind that of the EU28 countries, which also implies that from a social cohesion perspective the Adriatic-Ionian macro-region is behind.
The Regional Social Progress Index exists also in a global form and on a country basis. The global and regional version are however not comparable, and the
14 The index is published by the nonprofit organization Social Progress Imperative. A custom version for the EU regions has been developed in cooperation with the European Commission. See http://www.socialprogressimperative.org/custom-indexes/european- union/
TheSocial Progress Index measures the extent to which countries provide for the social and environmental needs of their citizens.
The Social Progress Index from 2016 bases on fifty-three indicators that cover the fields of Basic Human Needs (Nutrition and Basic Medical Care, Water and Sanitation, Shelter, Personal Safety), Foundations of Well-Being (Access to Basic Knowledge, Access to Information and Communications, Health and Wellness, Environmental Quality), and Opportunity to Progress (Personal Rights, Personal Freedom and Choice, Tolerance and Inclusion, Access to Advanced Education). A ranking of the values of Social Progress Index shows the relative performance of the countries included. For the purpose of this Task, this index has been re-scaled this report’s format.
scores base further on a different scale. 15 Serbia and Montenegro score 72.42 and 70.69 (out of 100 points) on the Social Progress Index respectively.
2.4 Macro-regional Economic Integration
The emergence of the “new trade theory” (Krugman, 1979)16 in late 1970 with its emphasis on economies of scale put economic integration in the centre of economic debate. According to this theory, companies in small countries tend to exhibit relatively high average costs, while companies in large countries can profit from lower average costs due to size advantages. 17
As a result, regional integration represents an important national policy
alternative for small economies in order to overcome the small size handicap. By joining a regional integration agreement, companies from a small domestic economy may enlarge and be better prepared to face competition from countries with larger domestic economies.18
However, while regional integration gives rise to new opportunities, new challenges may appear. These may take the form of strong restructuring at microeconomic level, with some companies disappearing and other companies growing bigger and becoming successful in international competition.19 In the restructuring process, relatively large and strong companies overtake their weaker competitors. An important role in this respect play mergers and acquisitions involving companies from different countries. Foreign direct investment (FDI) represents thus a channel in the integration process.
Companies with foreign participation, which are usually involved in vertical production networks, are also responsible for a large share of exports and
15 The Global Social Progress Index has the same methodological framework as its regional counterpart used for the EU Member States. The scoring of the Regional and Global version are however not comparable due to a different normalisation. The provided values are therefore in the original Social Progress format, and not comparable to the
benchmarked results. The scale of the original format is 0-100.
https://www.socialprogressindex.com/;
http://ec.europa.eu/regional_policy/sources/information/maps/methodological_note_eu_s pi_2016.pdf
16 Krugman, Paul R. (1979): Increasing returns, monopolistic competition, and international trade, URL:http://www.sciencedirect.com/science/article/pii/0022- 1996(79)90017-5.
17 Gustavson, Patrick & Koko, Ari (2004): “Regional Integration, FDI and Regional Development. European Investment Bank”. In: Papers of EiB-Conferences, Vol. 9, No. 1, pp. 122, Luxembourg.
18 Gustavson, Patrick & Koko, Ari (2004): “Regional Integration, FDI and Regional Development. European Investment Bank”. In: Papers of EiB-Conferences, Vol. 9, No. 1, pp. 122, Luxembourg.
19 Gustavson, Patrick & Koko, Ari (2004): “Regional Integration, FDI and Regional Development.
European Investment Bank”. In: Papers of EiB-Conferences, Vol. 9, No. 1, pp. 122, Luxembourg.
imports. However, integration may also lead to trade diversion and erosion of sovereignty.20
In the context of the EU’s long-term objectives, this chapter provides a context on the territorial cohesion of the macro-region, which is one of the three
cornerstones of Cohesion Policy next to economic and social cohesion21 , as well as the degree to which the Single Market22 is fulfilled within the macro-region.
For this analysis, various indicators have been chosen to provide a context of integration. The table below lists the chosen indicators. The macro-regional economic integration indicators chosen describe the intensity of cooperation, integration and (economic, cultural) exchange among the countries of the macro-region.
Table 2-9: Overview of Macro-regional economic Integration indicators
Composite Components
Labour Integration Intra macro-regional migration Mobile students from abroad Workers’ Remittance
Trade Integration Share of exports to macro-region out of total exports Capital Integration Inward FDI stocks
Energy Integration Exports of energy Accessibility Multimodal
Road Rail Air
Territorial Cooperation Number of organisations participating in INTERREG-IVB
20 https://www.globalpolicy.org/nations-a-states/political-integration-and-national- sovereignty-3-22.html
21 Territorial Cohesion, http://ec.europa.eu/regional_policy/en/policy/what/territorial- cohesion/
22 The European Single Market, https://ec.europa.eu/growth/single-market_en
2.4.1 Labour Integration
Figure 2-4: Labour Integration by country in 2015, on an EU-wide (top) and Macro- regional (middle) comparison. The bottom figure shows the Upper/Lower Regions, including their components
Text Box 2-4: Explanation of the indicator: ‘Labour Integration’
To get a picture on the status of labour integration in the macro-regions three indicators are selected: a) Bilateral estimates of migrant stocks in 2013, b) Bilateral Remittance Estimates for 2015 using Migrant Stocks, Host Country Incomes, and Origin Country Incomes (millions of US$) (October 2016 Version) both indicators provided by the World Bank and the c) Share of mobile students from abroad by education level, sex and country of origin, provided by Eurostat have been used to create a composite indicator.
Data on Migration and remittances are based on the Migration and Remittances Factbook 2016 published by the World Bank. It provides a comprehensive picture of emigration, immigration, and remittance flows for 214 countries and territories, and 15 country groups, drawing on authoritative, publicly available data. The data are collected from various sources, including national censuses, labour force surveys, and population registers.
According to the “Recommendations on Statistics of International Migration” by the United Nations Statistics Division (1998), “long-term migrants” are persons who move to a country other than that of their usual residence for a period of at least one year, so that the country of destination effectively becomes their new country of usual residence.
“Short-term migrants” are persons who move to a country other than that of their usual residence for a period of at least three months but less than one year, except for the cases where the movement to that country is for purposes of recreation, holiday, visits to friends and relatives, business, medical treatment, or religious pilgrimage (UN Statistics Division 1998).
A new notion of remittances introduced in the sixth edition of the IMF Balance of Payments and International Investment Position Manual (BPM6)23 is starting to be used by many countries (IMF 2010a). According to the new definition, personal remittances are the sum of two main components: “compensation of employees” and “personal transfers”.
Personal remittances also include a third item: “capital transfers between households,”
but data on this item are difficult to obtain and hence reported as missing for almost all countries.
Compensation of employees24, unchanged from BPM5, represents “remuneration in return for the labour input to the production process contributed by an individual in an
employer-employee relationship with the enterprise.” The definition of “personal transfers,” however, is broader than the old “worker’s remittances” – it comprises “all current transfers in cash or in kind made or received by resident households to or from non-resident households.” Therefore, “personal transfers” include current transfers from migrants not only to family members but also to any recipient in their home country. If migrants live in a host country for one year or longer, they are considered residents, regardless of their immigration status. If the migrants have lived in the host country for
23 IMF (2013): Sixth Edition of the IMF's Balance of Payments and International Investment Position Manual (BPM6). URL:
https://www.imf.org/external/pubs/ft/bop/2007/pdf/appx5.pdf
24 See footnote above
less than one year, their entire income in the host country should be classified as compensation of employees.25
Share of mobile students from abroad enrolled by education level, sex and field of education refers to students from abroad enrolled in tertiary education (level 5-8) in percentage of all students.
In the Adriatic Ionian macro-region the highest labour integration within the countries in the macro-region can be observed for Albania, Bosnia-Herzegovina, Montenegro, Croatia, Slovenia and Serbia. In these countries, the values of the integration index lie above the median for the macro-region and also well above the EU-median. In Greece, the value is below median for the macro-region but still above the European average. Italy exhibits the lowest labour integration with the countries in the macro-region with a value far below both the median of the macro-region and EU-median value26.
A close look at the migration, remittances and students’ mobility flows inside the macro-region, discloses some interesting integration patterns. Statistical
evidence shows that geographical proximity, historical and cultural ties and language advantages play an important role for labour integration. Family and friends network that migrants already have in the destination country is another contributing factor (Taylor, 1986)27. Thus there is a high degree of integration between Albania on the one side and Greece and Italy on the other side; there is a high degree of labour integration between Bosnia-Herzegovina on the one hand and Croatia, Serbia and Slovenia on the other hand; integration is the highest between Montenegro on the one hand and Serbia and Croatia on the other hand. Serbia is highly integrated with Croatia, Italy and Slovenia while Slovenia has the most ties with Croatia and to a lower extent with Serbia.
Italy’s labour integration with the other countries of the macro-region is very low whereas labour integration is high among the countries of former Yugoslavia.
Data reveals that the flow of migrants takes place to a larger extent from East to West (Italy, Greece) or from the new EU Member States and the candidate and potential candidate countries to the old EU Member States. The flow of
remittances follows an opposite direction. Statistical evidence shows that historical and family ties and language advantages prevail in the migration decision (as can be seen e.g. for the countries of former Yugoslavia).
25 IMF (2013): Sixth Edition of the IMF's Balance of Payments and International Investment Position Manual (BPM6). URL:
https://www.imf.org/external/pubs/ft/bop/2007/pdf/appx5.pdf
26 There were no data on students’ mobility available for Greece
27 Taylor, J. Edward, 1986. Differential migration, networks, information and risk. In:
Stark, Oded (Ed.), Migration, Human Capital and Development. JAI Press, Greenwich, CT
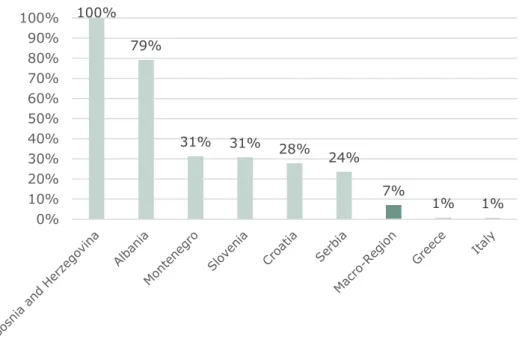
2.4.2 Trade Integration
Figure 2-5: Trade Integration by country in 2015, on an EU-wide (top) and Macro-regional (middle) comparison. The bottom figure shows the Upper/Lower Regions, including their components
Text Box 2-5: Explanation of the indicator: 'trade integration'
To measure Trade Integration, the analysis benchmarks a country’s share of exports to the macro-region out of its total exports. The result of the benchmark thus indicates the degree to which a country is able to sell its goods in the macro-region, and what importance the single market concept has on a macro-regional scale.
Next to the high economic importance of the macro-region associated with a high indicator score, the ‘functional’ definition of a macro-region through a common geographic feature is manifested through economic evidence.
The data was obtained from the COMTRADE Database of the United Nations, which provides comprehensive trade data.28
The (potential) EU candidate countries score high on the benchmark, as these are geographically secluded by EU countries. Albania has the highest trade integration within the countries of the Adriatic Ionian macro-region. A share amounting to nearly 70% of Albania’s exports have as destination the other countries in the macro-region (corresponding to a benchmark of 586; which is higher than the top performer in the EU28), of the majority is destined for Italy.
Montenegro follows with a share of 59% (and score of 467), with Serbia as the main trading partner.
The lowest trade integration in the macro-region present Italy and Greece. Only about 3% of the Italian and 18% of the Greek exports go to the other members of the macro-region. Due to its large size, the Italian economy has a more diversified pool of trade partners compared to the small countries in the macro- region, which explains the comparably very low benchmarking score. The Greek economy did in turn not yet recover from its economic crisis. With a share of exports to the macro-region amounting to 26.5%, Slovenia is the least integrated in this macro-region.
Another group of countries (Croatia, Serbia, and Bosnia-Herzegovina) exhibit shares of macro-region’s exports in total exports amounting to about 44%. Italy is in all three cases the main trade partner. Within their own geographic region, all three countries are further important trade partners for each other, due to the historical relations between these countries. In the context of EU accession, the strong integration of the (potential) candidate countries among each other as well as with the EU broadly indicates that the 1st EU acquis chapter of ‘Free movement of goods’ may be fulfilled.29 Trade integration increased since 2011 for Greece, Croatia, and Montenegro and remained at the same level for Slovenia.
28 UN COMTRADE, URL: https://comtrade.un.org/
29 See EU Neighbourhood Policy, Conditions for membership, EU Acquis, URL:
https://ec.europa.eu/neighbourhood-enlargement/policy/conditions-membership/chapters- of-the-acquis_en
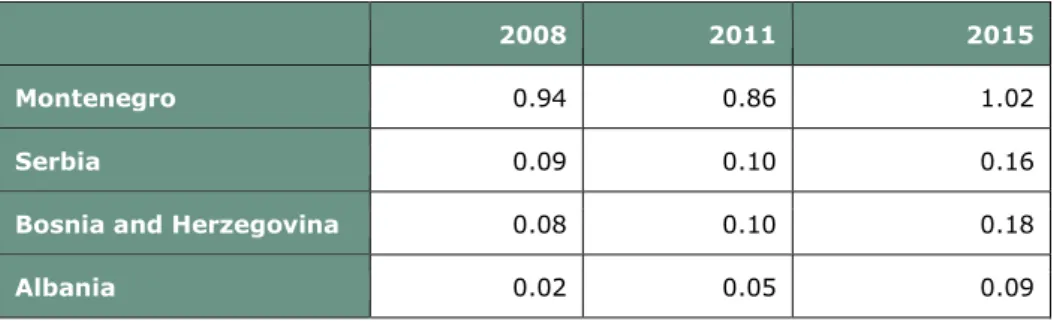
2.4.3 Capital Integration
Figure 2-6: Capital Integration by country in 2012, on an EU-wide (top) and Macro- regional (middle) comparison. The bottom figure shows the Upper/Lower Regions, including their components