NOVEMBER 2017
EUROPEAN COMMISSION DIRECTORATE-GENERAL REGIONAL AND URBAN POLICY
STUDY ON
MACROREGIONAL
STRATEGIES AND THEIR LINKS WITH COHESION POLICY
DATA AND ANALYTICAL REPORT FOR THE EUSDR
NOVEMBER 2017
EUROPEAN COMMISSION DIRECTORATE-GENERAL REGIONAL AND URBAN POLICY
STUDY ON
MACROREGIONAL
STRATEGIES AND THEIR LINKS WITH COHESION POLICY
DATA AND ANALYTICAL REPORT FOR THE EUSDR
ADDRESS COWI A/S Parallelvej 2
2800 Kongens Lyngby Denmark
TEL +45 56 40 00 00 FAX +45 56 40 99 99 WWW cowi.com
CONTENTS
1 Introduction to the Report 9
1.1 The EUSDR – Background 9
2 State of the Macro-Regions (Task 1) 14
2.1 Introduction to Task 1 14
2.2 Methodological Framework for Task 1 15
2.2.1 Macro-regions 15
2.2.2 Indicator Analysis 16
2.2.3 Composite Benchmarks 17
2.3 Macroeconomic Overview 22
2.3.1 Economic Performance 23
2.3.2 Employment 27
2.3.3 Social Progress Index 31
2.4 Macro-regional Integration 34
2.4.1 Labour Integration 36
2.4.2 Trade Integration 39
2.4.3 Capital Integration 42
2.4.4 Energy Integration 45
2.4.5 Accessibility Potential 48
2.4.6 Transnational Cooperation 50
2.5 Competitiveness 52
2.5.1 Overall competitiveness 53
2.5.2 Education 61
2.5.3 Business 65
2.5.4 Transport 69
2.5.5 Tourism 73
2.5.6 Energy 76
2.5.7 Climate Change: Adaptation 83
2.5.8 Climate Change: Mitigation 86
2.5.9 Environment: Air Quality 90
2.5.10 Environment: Air Pollution 92
2.5.11 Environment: River Status 94
2.5.12 Biodiversity: Natura 2000 96
2.5.13 Diversity of Land Cover (Shannon Evenness
Index) 99
2.5.14 Eco-Innovation Scoreboard 101
2.5.15 Resource Efficiency (composite of Eco
Innovation Scoreboard) 103
2.5.16 Bathing Water Quality 105
2.5.17 Agricultural Impact 107
2.6 Political, Institutional & Governance Indicators 111
2.6.1 Governance 113
2.6.2 Public Institutions 116
2.6.3 Voice and Accountability 118
2.6.4 Human Trafficking 120
2.6.5 Number of Drug Seizures 122
2.7 Meta-analysis 124
2.7.1 Macroeconomic Indicators 124
2.7.2 Macro-regional Integration 126
2.7.3 Competitiveness 127
2.7.4 Political, Institutional and Governance indicators 130
3 Review of the Macro-regional Strategies (Task
2) 132
3.1 Introduction to Task 2 132
3.2 Methodology for Task 2 133
3.3 Review of the EUSDR (Task 2a) – Summary 139 3.4 Achievements of the EUSDR (Task 2b) 142
3.4.1 Achievements – contents-wise 142
3.4.2 Achievements – process-wise 148
3.5 Comparison of objectives of the EUSDR with
achievements (Task 2c) 156
3.6 EUSDR and ESIF (Task 2d) 171
3.7 EUSDR Case fact sheets 179
APPENDICES
Appendix A TASK 2a: Review of the EUSDR A.1 Methodological Framework
A.2 Pillar A: Connecting the Danube Region A.3 Pillar B: Protecting the Environment in the
Danube Region
A.4 Pillar C: Building Prosperity in the Danube Region
A.5 Pillar D: Strengthening the Danube Region Appendix B List of literature
List of Abbreviations
Abbreviation Stands for
AG Action Group
AP Action Plan
BSAP Baltic Sea Action Plan BSLF Baltic Sea Labour Forum
BSN Baltic Science Network
BSR Baltic Sea Region
BSR Stars PA Innovation (EUSBSR) flagship
BUP Baltic University Programme
CBC Cross Border Cooperation
CBSS The Council of the Baltic Sea States
CEF Connecting Europe Facility
CF Cohesion Fund
CISE Common Information Sharing Environment
DG Directorate-General
EAFRD European Agricultural Fund for Rural Development
EC European Commission
ECTS European Credit Transfer System
ECVET European Credit system for Vocational Education and Training
EFTA European Free Trade Association EMFF European Maritime and Fisheries Fund
ERASMUS+ EU Programme for Education, Training and Sport ERDF European Regional Development Fund
ESF European Social Fund
ESIF / ESI funds European Structural and Investment Funds ETC European Territorial Cooperation
EU European Union
EUSAIR European Union Strategy for the Adriatic-Ionian Region
EUSALP European Union Strategy for the Alpine Region EUSBSR European Union Strategy for the Baltic Sea Region EUSDR European Union Strategy for the Danube Region EWTCA East West Transport Corridor Association
HAC Horizontal Action Coordinator (EUSBSR)
HELCOM Baltic Marine Environment Protection Commission
HLG High Level Group
IALA Navigation in the IMO, International Association of Marine Aids to Navigation and Lighthouse Authorities
ICPDR International Commission for the Protection of the Danube River
IHO International Hydrographic Organisation IMO International Maritime Organisation
MA Managing Authority
MRS Macro-regional strategy/-ies
MS European Union Member States
MSFD Marine Strategy Framework Directive
NCs National Coordinators
NCM Nordic Council of Ministers
NDEP Northern Dimension Environmental Partnership NEFCO Nordic Environment Finance Corporation
NGO Non-governmental organisation
NUTS Nomenclature of territorial units for statistics
OP Operational Programme
OVI Objectively Verifiable Indicators
PA Policy Area / Priority Area / Pillar / Action area PA Education Policy Area Education (EUSBSR)
PA Innovation Policy Area Innovation (EUSBSR) PA Nutri Policy Area Nutrition (EUSBSR) PA Safe Policy Area Safety (EUSBSR) PA Transport Policy Area Transport (EUSBSR) PAC Policy / Priority Area Coordinator
RDP Rural Development Programme
S2W School to Work (PA Education (EUSBSR) flagship)
SG Steering Group
SME Small and medium-sized enterprises
SWD Commission Staff Working Document
TEN-T The Trans-European Transport Networks
TO Thematic objective
TNK Transnational Component
TSG Thematic Steering Group
VET Vocational Education and Training
WFD Water Framework Directive
1 Introduction to the Report
The 'Study on macro-regional strategies and their links with cohesion policy' consists of four task, which are summarised and concluded upon in the Final Report. The first two tasks (Task 1 and Task 2) have been reported on individually, and the present report contains the data and analysis for these two tasks for the European Union Strategy for the Danube Sea Region (EUSDR).
This report begins with a brief section presenting the EUSDR, followed by the first major part (section 2) of the report, which contains the data and
analytical report for Task 1, i.e. a description and an analysis of the overall context of the Danube macroregion;
thereafter, the second major part (section 3) contains the data and analytical report for Task 2, analysing the overall achievements of the EUSDR and an evaluation of its contribution to strengthening the territorial cohesion objective of the EU. Task 2 is divided into the following four sub-tasks:
Task 2a: Review of the EUSDR Task 2b: Achievements of the EUSDR
Task 2c: Comparison of objectives of the EUSDR with achievements Task 2d: EUSDR and ESIF
1.1 The EUSDR – Background
European Commission prepared the EU Strategy for the Danube Region (EUSDR), in cooperation with the fourteen countries and stakeholders in the region. Based on the experience from the Baltic Region, the EUSDR addresses the common challenges related to the region and the Danube River in particular.
Data and analysis report for Task 1 and Task 2
Structure of the report
The EUSDR members include nine EU Member States, three (potential) candidate/pre-accession countries, and two neighbourhood countries. The strategy builds on previous regional cooperation and aims at contributing to develop this cooperation and strengthen the regional integration across all member countries.
The EUSDR's four main objectives (called pillars) concern the 'connection of the region', 'protection of the environment', 'building prosperity' and 'strengthening the region'. These pillars cover a range of topics with a geographical focus on the Danube Basin and the regional and transnational issues related to it.
Consequently, the priority areas and projects encourage and strengthen cooperation on issues such as water quality, navigation systems, or training of personnel for inland navigation.1
The Danube Region has 14 member states, which are part of the EUSDR.
Table 1-1 Countries and key features of the EUSDR
Countries and regions Key features
EU countries
Germany (Baden-Württemberg, Bayern)
Austria
The Slovak Republic
The Czech Republic
Hungary
Slovenia
Croatia
Romania
Bulgaria Non-EU countries
Serbia
Bosnia and Herzegovina
Montenegro
The Republic of Moldova
Ukraine
Representing 115 million inhabitants or more than 22%
of the EU population
9 EU Member States as well as 5 non-EU members
1 http://www.danube-region.eu/about and COMMISSION STAFF WORKING DOCUMENT ACTION PLAN, Accompanying document to the COMMUNICATION FROM THE COMMISSION TO THE EUROPEAN PARLIAMENT, THE COUNCIL, THE EUROPEAN ECONOMIC AND SOCIAL COMMITTEE AND THE COMMITTEE OF THE REGIONS European Union Strategy for the Danube Region {COM(2010) 715}, SEC(2010) 1489.
Figure 1-1 The EUSDR by NUTS2/Statistical Regions
The EUSDR strategy includes four pillars, which are implemented through eleven priority areas (hereafter PAs).
Table 1-2 EUSDR: pillars and priority areas
Pillars Priority Areas
Connecting the Region 1. Mobility and multimodality 1A. Waterways mobility 1B. Rail-Road-Air mobility 2. Sustainable energy
3. Culture and tourism, people to people Protecting the Environment 4. Water quality
5. Environmental risks
6. Biodiversity, landscapes, air and soil quality Building Prosperity 7. Knowledge society
8. Competitiveness 9. People and skills
Strengthening the Region 10. Institutional capacity and cooperation 11. Security
The strategy and the related action plan were endorsed by the Council in April 2011. The action plan is 'rolling', i.e. it will be regularly reviewed and updated2.
2 COMMISSION STAFF WORKING DOCUMENT, ACTION PLAN, Accompanying document to the COMMUNICATION FROM THE COMMISSION TO THE EUROPEAN PARLIAMENT, THE COUNCIL, THE EUROPEAN ECONOMIC AND SOCIAL COMMITTEE AND THE COMMITTEE OF THE REGIONS; European Union Strategy for the Danube Region; SEC(2010) 1489.
Strategy and action plan
Governance
Governance of the EUSDR consists of a number of actors and institutions as listed in Error! Reference source not found.. The Steering Groups of the individual priority areas, led by the PACs, are the key implementers of the strategy.
Table 1-3 Roles and responsibilities in the EUSDR3
Actors/roles Description
National Coordinators Core strategic body – Coordinate and keep overview of strategy implementation at national/regional level and serve as links between political level and PAs.
Priority Area Coordinators (PACs)
Leaders of the thematic fields and the Steering Groups – Officials of national/regional administrations, experts in their areas, drivers of operational implementation of the strategy.
Steering Groups Ensure implementation of the strategy – Members from all involved countries, as well as representatives of civil society, support the PACs in day-to-day implementation.
Managing Authorities Mangers of ESIF programmes European Level
(DG Regio and High Level Group (HLG))
Help ensure the connection between the strategy and EU policies – Provide links with EU decision makers and institutional support through EU funding.
Danube Strategy Point (DSP) Supports the actors implementing the strategy and takes care of communication activities.
Priority Areas are implemented by Priority Coordinators supported by the
Steering Group (SG). Furthermore, the SG should also make decisions regarding the future development of the area, its objectives, co-operations and guidelines.
The SG is responsible for the labelling of projects to receive a Letter of Recommendation, but not for the operational initiation, administration, organization or execution of such projects. The tasks of the SGs are to ensure that suitable actions are anchored all over the region and in all participating states.
Many priority areas use thematic Working Groups for the coordination and discussion of existing and proposed projects. In order to base the Strategy’s implementation on the latest available knowledge, regional and international experts may be consulted and invited to the sessions of the Working Groups.
3 "Governance – How is the Strategy run?" (http://www.danube-
region.eu/about/governance) and COMMISSION STAFF WORKING DOCUMENT, Accompanying the document: REPORT FROM THE COMMISSION TO THE EUROPEAN PARLIAMENT, THE COUNCIL, THE EUROPEAN ECONOMIC AND SOCIAL COMMITTEE AND THE COMMITTEE OF THE REGIONS on the implementation of EU macro-regional strategies (SWD(2016) 443 final).
Steering group
Thematic or working group
STATE OF THE
MACRO-REGIONS
EUSDR (TASK 1)
2 State of the Macro-Regions (Task 1)
2.1 Introduction to Task 1
This report presents the results of Task 1 of the 'Study on Macro-Regional Strategies and their links with cohesion policy' for the Danube Macro-regional Strategy. Three other reports of the same structure cover the remaining three macro-regions: the Baltic Sea, the Alpine and the Adriatic and Ionian Sea Strategy.
This report provides an 'indicator-based description and analysis of the overall context of [the] macro-regions'4. This report aims further to provide a context that is detached from the Macro-regional Strategy concept and does not provide an evaluation of the Macro-regional strategies objectives; which is addressed in the Task 2 report. The description and analysis is structured along four specific headlines: macro-economic overview; macro-regional integration;
competitiveness; and the political, institutional and governance context. There is a chapter on each of these dimensions, followed by a synthesised meta-analysis.
Prior to these indicator-based chapters, the report provides a brief methodological overview.
For each indicator that is described, the report first provides a graphical
illustration of the indicator values. This is followed by a description and analysis of the indicator values in question.
4 The study Specifications
2.2 Methodological Framework for Task 1
2.2.1 Macro-regions
The concept of Macro-regions refers to a grouping of regions that principally share a common functional context, such mountains, sea-basins, or river-basins, and 'in which the priorities and objectives set out in the corresponding strategy can be properly addressed'5. While this grouping of territories into macro-regions thus follows a functional logic, it remains an artificial construct in terms of a governance or territorial unit. Therefore, contextual information for a macro- region as a whole is not readily available. This is reflected in the fact that no selection of relevant information is available on an aggregated level.
The family of reports under Task 1 aims at filling this gap. They seek to provide a set of relevant information that closes this gap and draws valid inferences on the overall context of the macro-region in question.
More specifically, the context of the macro-regions is described through a set of indicators on four dimensions (macroeconomic overview, integration,
competitiveness and the institutional / governance context). The four types of indicators provide a research framework upon which the Task builds, and essentially reflect the EU’s principal policy of Economic-, Social-, and Territorial Cohesion as follows:
› Macroeconomic indicators reflect the (socio) economic context of the individual economies as well as the macro-region as a whole. Further, they also serve as overview indicators on the overall social- and economic cohesion.
› Macro-regional economic integration indicators describe the intensity of cooperation, integration and (economic, cultural) exchange among the countries of a macro-region, and essentially reflect the state of territorial cohesion.
› Competitiveness indicators provide a more detailed insight into the (broadly defined) competitiveness of countries and macro-regions on various aspects. These indicators provide inference on factors that affect the three Cohesion objectives.
› Political, institutional and governance indicators mirror the political state of a macro-region in terms of governments’ accountability or effectiveness of legislation. These indicators mirror the likely capacity to effectively pursue interventions on the economic, social as well as territorial cohesion.
5 Study specifications The Macro-Regional
Framework
Indicators to provide an overall context of the Macro-regions
The reports provide a picture of the status of the macro-region in question, of the developments inside the macro-regions and when possible (i.e. data allows) a comparison of the current results with the results of the past. The family of Task 1 reports thus explores and analyses the overall context of the four
existing Macro-Regional Strategies (MRS), namely the EU Strategy for the Baltic Sea Region (EUSBSR), the EU Strategy for the Danube Region (EUSDR), the EU Strategy for the Alpine Region (EUSALP) and the EU Strategy for the Adriatic and Ionian Region (EUSAIR). The analysis is thus as such detached from the contents of each of the macro-regional strategies. Rather, it focuses on the comparable assessment of the socioeconomic and macro-regional integration status within the macro-regions, as well as on the comparable investigation of their performance regarding competition and efficient institutions and
governance.
2.2.2 Indicator Analysis
A first step of Task 1 focused on the construction of a set of indicators which are relevant to macro-regions on a macro-regional level. For this, indicators were first identified by the consultant, and the final selection was done in close cooperation with DG REGIO. Consultations with DG REGIO and members of the Steering Committee served to ensure an eventual comprehensive and relevant picture of the macro-regions.
For the identification of indicators statistical units had to be considered. Given that the macro-regions in some cases consist of regions and not entire
countries, the geographical level of the analysis is principally conducted at level 2 of the Nomenclature of territorial units for statistics (NUTS-2), as defined by the EU. However, in some cases data are not available at NUTS-2 level of aggregation but at NUTS-1 level or country level only. In these cases the missing information for the NUTS-2 level has been substituted by data from the first available aggregation level above it, i.e. if statistical information on a measure was available at NUTS-1 level, the same performance measure was assumed to apply at the NUTS-2 level. For some variables only country-specific information was available. This applies for example to the macro-regional integration indicators.
The statistical units for regions outside the EU were chosen according to the countries’ own aggregation at NUTS-2 level (equivalent to SR36) as defined by the EU. Only very few data were available at a level comparable with the NUTS- 2 level of the EU. Furthermore, most analysed countries outside the EU are quite small, and most data for the regions outside the EU have therefore been chosen at country level of aggregation.
6 The NUTS classification is defined only for the Member States of the EU. Eurostat, in agreement with the countries concerned, also defines a coding of statistical regions (SR) for countries that do not belong to the EU but are either candidate countries, potential candidate countries or countries belonging to the European Free Trade Association (EFTA).
Eurostat and Serbia have not yet agreed on statistical regions for the country.
Choosing macro- regionally relevant indicators
Emphasis on regional indicators where possible
The main sources of data used in this report are the Eurostat-Database supplemented with data from the World Bank Database, OECD, UNCTAD, COMTRADE, EEAA, ESPON project. Most NUTS-2 data are published with a time lag of one or two years. In order to create a common basis across the macro- regions and the themes, the description and analysis are generally based on data available for the year 2015 or the latest available data for all considered regions. When possible, a comparison is provided between the latest available year data and the data for 2008 for the Baltic Sea and Danube macro-regions.
The year 2008 also is the year just before the creation of these two macro- regional strategies. For the two newer macro-regions, the Alpine and Adriatic Ionian macro-regions it is the year 2011 that is compared to 2015. The year 2011 is the year just before the creation of the Alpine and Adriatic Ionian macro- regions and it offers a timespan long enough in order for changes to become visible.
Each of the quantitative and qualitative indicators identified as best describing the socio- economic context, integration, as well as the competitiveness, institutional and governance situation of the four macro-regions was subject of an assessment against the RACER framework. RACER stands for “Relevant, Acceptable, Credible, Easy, Robust” and enables a judgement on each indicator’s properties and qualities. Each RACER criterion has been assessed on a three- level scoring scale (green: criterion completely fulfilled; orange: criterion partly fulfilled; red: criterion not fulfilled). Based on the strengths and weaknesses of each of the quantitative and qualitative indicators across all the RACER criteria, a list of indicators was selected out of a pool of indicators considered.
The indicators which complied with all RACER criteria (green overall) have been definitely included into the set of selected indicators; those, which did not comply with all RACER criteria (a mix of green, red and yellow) and were not of high importance for the considered macro-region have been left outside.
2.2.3 Composite Benchmarks
As it is not possible to monitor all dimensions of a macro-region with one single indicator, a larger number of indicators has been selected. An additional
challenge is that a macro-region’s picture comprises the four dimensions (macro-economic, macro-regional integration, competitiveness and political- institutional- governance) but each dimension cannot be captured by one single quantitative indicator.
In order to cope with this challenge, all indicators with a common theme have been aggregated into composite indices. Composite indices bundle separate (component) indicators into one index which allows the values of the whole bundle expressed as only one measure7; examples of such indices are the Human Development Index, Environmental Sustainability Index, and stock indices like the NASDAQ Index. In the course of gathering indicator data, the data have been grouped into sets of related indicators according to appropriately
7 See http://www.investopedia.com/terms/c/compositeindex.asp Composite Indices
identified themes. Themes have been chosen so that the indicators together represent an “essential feature” of and within a macro-region. The individual indicators have been aggregated without any weights and each composite index hence represents the unweighted average of all indicators.
Different indicators generally apply different scales, such as percentages, currencies or categorical data (e.g. chemical status of waterbodies). The
aggregation of such different scales only makes sense for comparable variables.
Each indicator therefore needs to be normalised (to a common scale) before these can be combined into a composite index. For this aggregation, the proprietary ‘emb’ model (equilibrated medial benchmarking) has been applied8. The benchmarking analysis focuses on the four macro-regions and the four dimensions inside each macro-region compares countries and/or NUTS-2 regions inside the individual macro-region based on a common reference framework of EU countries. The reference framework for each component indicator or composite index is delineated by the “top performer” of EU28 countries (benchmarked at 150), the “lowest performer” (50) and the median performer(s) at 1009. A high benchmarking score always reflects a more
“desirable” situation. Taking unemployment rates as an example, higher scores reflect lower unemployment rates. In this way, the benchmarking results can always be read as showing whether – and to what extent – they are above or below the median in the EU at country level. This common framework enables observations to be made across different regions, even though the main focus remains within each macro-region.
The benchmark is always scaled on a country level against all EU28 Member States. The benchmarking score hence indicates a country’s or a region’s relative position to all EU28 countries. This means in turn that one can observe values above 150 and below 50 in the cases summarised in the table below.
8 For the Proprietary Method of constructing indices from multiple indicators refer to: Fink, M. et al. (2011), Measuring the impact of flexicurity policies on the EU labour market, IHS Research Report, commissioned by DG EMPL (Employment, Social Affairs and Inclusion).
9 The median is the point in a dataset in which a split of that dataset results in two sets with an equal number of data points. See http://www.investopedia.com/
terms/m/median.asp for more details Composite
Benchmarks
Table 2-1: Cases with benchmarking scores above 150 and below 50
Case Explanation
Regional analyses (NUTS-2 level)
A NUTS-2 region may out-/underperform its country. Such as Stockholm (SE), performing higher than Sweden as a whole.
Non-EU countries A non-EU country is not included in the benchmarking scale. Thus, a country like Ukraine may score above 150 or below 50, as they are not included in the scaling.
Macro-regional Integration analyses
Countries that are stronger/weaker integrated in a macro-region than the EU’s ‘top performing’/’bottom performing’ country is integrated in the EU28 (see paragraphs below).
For example, Germany’s trade integration with countries in the Danube region comprises only a small share of its trade with all EU28 countries and is at the same time lower than that of the EU’s
‘bottom performer’.
The chapter on integration includes new integration indices. These IHS- proprietary indices cover respectively Labour Integration (three indices plus a composite of these 3 components), Capital Integration (Foreign Direct Investment (FDI), Energy Integration, and Trade Integration. Each of these seven indices is constructed on a similar principle, which is outlined as follows.
When the amount or value of labour, capital etc. supplied by a country to another country (a ‘partner’), or, equivalently, received from a partner, increases, it can be said that the level of integration between the two has increased. Considering a particular group of countries, the focus is on the bilateral flows between them. For the task of estimating integration within macro-regions, i.e. between individual countries belonging to the macro-region in question, the first step is the development of a “Bilateral Flow Matrix”, as shown in the table below.
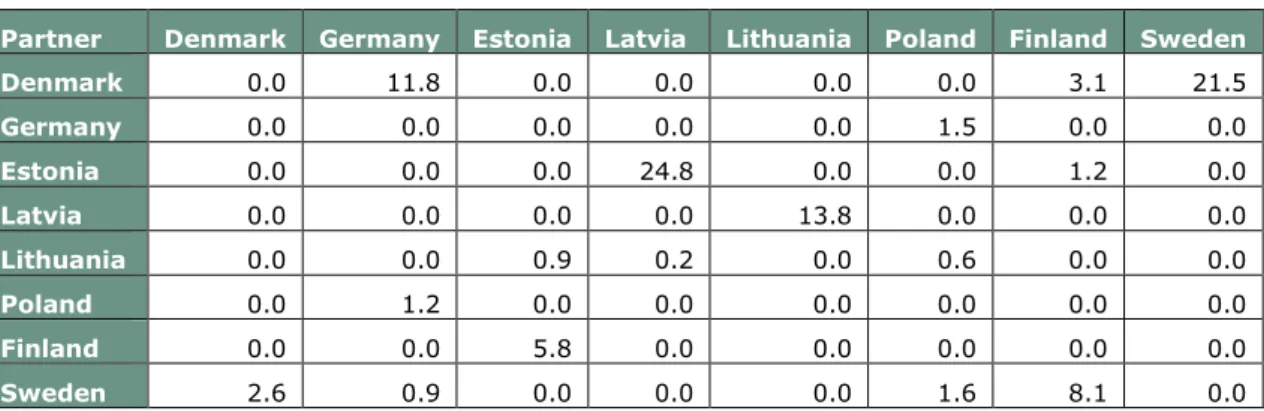
Table 2-2: Energy Integration Example (Baltic Sea), energy exports (kTOE)
Partner Denmark Germany Estonia Latvia Lithuania Poland Finland Sweden Denmark 0.0 1,917.4 0.0 0.0 0.0 0.0 505.6 3,503.5
Germany 3.5 0.0 0.0 0.0 0.0 916.5 0.0 0.0
Estonia 0.0 0.0 0.0 522.7 0.0 0.0 25.6 0.0
Latvia 0.0 0.0 0.4 0.0 293.9 0.0 0.0 0.0
Lithuania 0.0 0.0 79.7 14.4 0.0 51.4 0.0 0.0
Poland 0.0 251.7 0.0 0.0 5.6 0.0 0.0 1.7
Finland 0.0 0.2 432.8 0.0 0.0 0.0 0.0 0.1
Sweden 477.6 168.3 0.0 0.0 0.0 302.0 1,484.4 0.0
Immediately, certain strong relationships between certain country-pairs are visible. What such a table of absolute values does not make clear is the
‘importance’ of a bilateral relationship for a specific country. A second step Integration Indices
therefore converts the data to a relative share of all its exports (or foreign investments, migration flows, remittances) (in worldwide).
Table 2-3: Energy Integration Example, Share of total exports to partner country (in %) Partner Denmark Germany Estonia Latvia Lithuania Poland Finland Sweden
Denmark 0.0 11.8 0.0 0.0 0.0 0.0 3.1 21.5
Germany 0.0 0.0 0.0 0.0 0.0 1.5 0.0 0.0
Estonia 0.0 0.0 0.0 24.8 0.0 0.0 1.2 0.0
Latvia 0.0 0.0 0.0 0.0 13.8 0.0 0.0 0.0
Lithuania 0.0 0.0 0.9 0.2 0.0 0.6 0.0 0.0
Poland 0.0 1.2 0.0 0.0 0.0 0.0 0.0 0.0
Finland 0.0 0.0 5.8 0.0 0.0 0.0 0.0 0.0
Sweden 2.6 0.9 0.0 0.0 0.0 1.6 8.1 0.0
The new integration index provides a common basis for measuring integration in each of the four macro-regions, just as the case for every other indicator
considered in this study. Given that the number of countries in the macro- regions vary, the total share of e.g. energy exports to the macro-region would grow with the number of member countries. Therefore, to provide a measure of integration that is not affected by the size of a macro-region, the chosen measure for each country’s degree of integration within its macro-region is its per partner share (ppShare); i.e. the average flow to a destination country.
Table 2-4: Energy Integration Example, resulting per partner share Partner ppShare
Denmark 5.21 Germany 0.22 Estonia 3.72 Latvia 1.98 Lithuania 0.23 Poland 0.18 Finland 0.83 Sweden 1.90
In the case of integration indices, the procedure to establish the benchmark is identical in formation as for the other indices, except that in this case the bilateral flow matrix is 28 x 28 for the EU28. Thus, the benchmark is defined by the average share that each Member State exports to the EU28 countries. This results in a per partner share of each Member State, but to the whole EU28, instead of a macro-region.
In other words, using the per partner share as a unit of measure enables the degree of integration within each macro-region to be benchmarked against the degree of integration in the EU as a whole. This provides a deep insight into the question of whether the common geographical basis (and more) for the macro- regions is actually, and to what extent, of particular relevance compared to the Benchmarking
Integration Indices
entire setting of all EU countries, which may in general cover a more or less contiguous area, but which course also comprise (even more) multiple regional contexts.
As mentioned in Table 3-43 above, there are many cases found to score well below 50 or well above 150. This is entirely consistent: The reason, expressed mathematically, is that the two-dimensional flow matrices gives rise to country index values in macro-regions that are not subsets of the EU index; for non- integration indices, in contrast the (EU) country indicator values form by definition a subset of the EU28.
Each composite index is accompanied by a figure that consists of two maps and one bar chart. Both maps show the composite index values for each NUTS region in differing colour schemes. The first map provides a coloured illustration of the scores on a scale from 50-150 and reflects how a given region performs on the EU28-wide level (i.e. 100 reflects the EU28 median). Any regions scoring outside this defined range are displayed as 50 or 150.
The scale of the second map is in turn defined by the lowest and highest composite index scores found for the macro-region and seeks to highlight the differences between the high and low performing regions of that macro-region more clearly. As a result, the range of this scale depends on the maximum and minimum scores for each individual composite index in a given macro-region.
The bar chart identifies the two regions with the highest and lowest composite index scores in each country, accompanied by the (benchmarked) scores of the index’s components. The colouring scale ranges from 50 to 150.
Synchronous to this report, a digital toolbox has been developed. The digital toolbox comprises a set of data files for each of the four macro-regions. Each file contains data sheets for each indicator used to assess the context of the macro- regions. As mentioned above, data has been organised separately for the appropriate NUTS regions and countries in each of the four macro-regions, and each indicator, or composite, corresponds to an excel sheet for each macro- region. The excel sheets have been grouped according to the four dimensions (macro-economic, macro-regional integration, competitiveness and political- institutional- governance). Furthermore, within each dimension, sheets have been grouped according to agreed aggregated compositions i.e. as composite indices).
An index page (usually on the first data sheet of each file) will enable users to directly find the data sheet for a named indicator (by clicking on an excel hyperlink).
A second set of excel files has been established for documenting the results of the benchmarking process. There is a file for each individual macro-region. This contains datasheets corresponding to indicators, grouped according to the above-mentioned four dimensions. Within these, they are further grouped according to the agreed aggregated composition of composite indices.
Illustrative Maps
Digital Toolbox
2.3 Macroeconomic Overview
In this chapter the overall macroeconomic state of the macro-region is assessed through analyses focused on three major themes: economic performance, employment, and social equality. The macroeconomic indicators are used to reflect the (socio) economic context of the individual economies as well as of the macro-region as a whole.
The table below provides an overview of the indices that are presented in this chapter:
Table 2-5: Overview of macro-economic overview indicators
Composite Economic performance indicators
Employment indicators Social progress indicators
Components
GDP/capita Employment index Social progress index10
GDP growth Unemployment rate
Labour productivity Youth unemployment
Long term unemployment
Economic activity rate
Employment rate
10 A composite index based on 53 indicators covering basic human needs, conditions for well-being and opportunity to progress
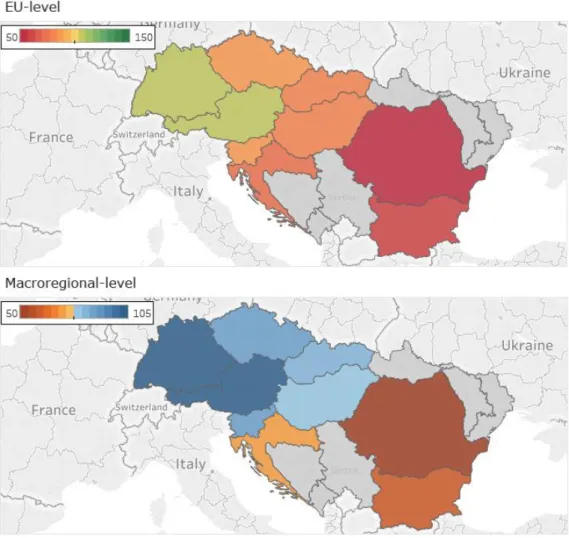
2.3.1 Economic Performance
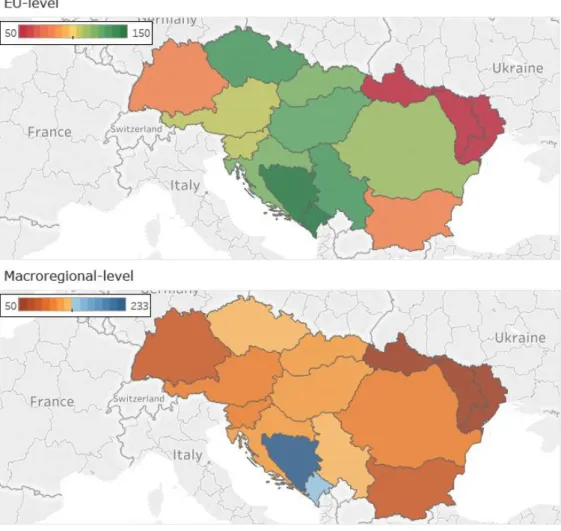
Figure 2-1: Economic Performance by NUTS-2 in 2015, on an EU-wide (top) and Macro- regional (middle) comparison. The bottom figure shows the Upper/Lower Regions, including their components
Text Box 2-1: Explanation of the indicator: ‘Economic Performance’
To assess the economic performance on NUTS-2 regions inside the macro-region three indicators: regional Gross Domestic Product (GDP) per capita (at purchasing power parity), Real GDP growth rate and Labour Productivity have been bundled into one composite indicator: Economic performance index.
Regional gross domestic product (GDP) is used for the measurement and comparison of the economic activity of regions. It is the most important indicator used in the EU's regional policy for the selection of regions eligible for support under the „investment for growth and jobs goal” of the EU. GDP is the standard measure of the value of the production activity (goods and services) of resident producer units.11 For this indicator regional data are available with a time lag of two years. Thus regional GDP data for the reference year 2015 have been released at the beginning of 2017. Real GDP is usually a proxy for economic prosperity. GDP per capita, however, does not reflect the equality of distribution of that prosperity, so it is not representative for many social issues.
The real percentage-growth rate of gross value added (i.e. Real GDP growth) allows the identification of the most and less dynamic regions in the EU and the non-EU regions inside the macro-region.
Labour Productivity has been calculated as Regional Gross Value Added (GVA) per employee. According to the OECD, Labour Productivity measures “how efficiently
production inputs, such as labour and capital, are being used in an economy to produce a given level of output.” Productivity is considered a major source of economic growth and competitiveness. It is used as a main indicator to assess a country’s performance and to perform international comparisons. Over time a country’s ability to raise its standard of living depends to a great extent on its ability to raise its output per worker. There are different measures of productivity.
An analysis of the composite indicator Economic Performance in the Danube macro-region shows a mixed picture regarding economic development of its regions. This diversity is given by the composition of the macro-region which includes some of the EU’s traditionally weakest and strongest regions. For the years 2008 and 2014 the composite indicator exhibits the highest values for the most NUTS-2 regions in Germany and Austria, as well as those countries with capital cities as a separate NUTS-2 region, i.e. the Czech Republic (Praha), Slovakia (Bratislavský kraj), Romania (Bucuresti-Ilfov), Hungary (Közép- Magyarország), and Slovenia (Zahodna Slovenija). These regions show a high GDP per capita and a high productivity. The figure above clearly highlights that the internal difference in these countries towards its rural regions is significant.
The highest GDP per capita and productivity in the Danube macro-region is to be found in the regions of Praha, Stuttgart, Karlsruhe, Oberbayern, Wien, Salzburg,
11 https://www.oenb.at/en/Statistics/Standardized-Tables/Economic-and-Industry- Indicators/Economic-Indicators/nominal-gpd-growth-expenditure-side.html
Bratislavský kraj, and Bucuresti-Ilfov. These are urban centres characterised by qualified workforce and a high quality infrastructure.
The lowest benchmarking scores are found the regions Severozapaden, Yuzhen tsentralen, and Severen tsentralen in Bulgaria, followed by Nord-Est in Romania.
These are rural regions with a high share of population in agriculture. The highest number of low performers are to be found in Bulgaria, Romania, Croatia, and Hungary. These are also regions with a low GDP per capita and low
productivity. However all regions in the Czech Republic, Austria, Germany, Slovakia and most regions in Romania and Hungary made considerable progress and managed to reduce their gap to the EU-average regarding the considered indicators between 2008 and 2014. An important role in this process played the investment co-financed by the EU Cohesion Funds. Downturns registered the regions in Croatia and Bulgaria. Croatia was confronted with a six year recession following the economic crisis and experienced negative GDP growth over the entire period from 2009 to 2014. The long lasting recession was due to deep structural problems and difficulties in adjusting the economy after the initial recession. A turnaround was achieved only in 2015. Following the GDP
contraction in 2009 Bulgaria could not get back to the previous high GDP growth rates. After five years with modest growth rates, below 2%, Bulgaria’s economic growth accelerated only in 2015 and 2016. The other countries in the region recovered relatively quickly after the recession of the year 2009 and continued their successful growth path.
As the data available for the EU candidate, potential candidate and the other non EU countries for the investigated indicators (Table 2-6) differ from the data available for the EU-countries in the macro-region, these data have not been included in the composite indicator. The data are presented and analysed below.
No comparable data were available for these countries at regional level and for the indicator labour productivity.
Table 2-6: GDP per capita in (potential) candidate and neighbouring countries GDP per capita (current
prices) (EUR) GDP per capita in PPS (%, EU-27=100)
2008 2014 2008 2014
Moldova 1,153 1,691 n/a n/a
Ukraine 2,779 2,348 n/a n/a
Montenegro 4,908 5,436 42 39
Serbia 4,586 4,635 36 35
Bosnia and
Herzegovina 3,325 3,641 26 28
Source: Eurostat.
As the table shows these countries exhibit much lower levels of GDP per capita compared to the EU countries in the macro-region. While the country with the lowest GDP per capita, Bosnia and Herzegovina managed to rise its GDP per
capita in the period 2008 till 2014 by modest two percentage points, the GDP per capita in Montenegro, Serbia, and the Ukraine decreased in the same timeframe.
This was due to the modest GDP performance of these countries with low and negative growth rates (Table 2-7). Although Ukraine recovered after the GDP drop in 2009 caused by the economic and financial crisis, this development did not prove to be long lasting. The Ukrainian economy stagnated in 2012 and 2013 and it registered a negative development since 2014. The conflict in the Eastern part of the country had and has a negative economic impact.
All these countries need to implement structural reforms and improve their business and investment environment in order to boost GDP growth and make progress in the convergence process.
Table 2-7: GDP Growth rates in (potential) candidate countries, in %
2008 2009 2010 2011 2012 2013 2014 2015 2016 Moldova 7.8 -6.0 7.1 6.8 -0.7 9.4 4.8 -0.5 4.1 Ukraine 2.2 -15.1 4.1 5.4 0.2 0.0 -6.6 -9.8 2.3 Montenegro 6.9 -5.7 2.5 3.2 -2.5 3.3 n/a 3.4 2.5 Serbia 5.4 -3.1 0.6 1.4 -1.0 2.6 -1.8 1.8 4.7 Bosnia and
Herzegovina 5.6 -2.7 0.8 1.0 -1.2 2.5 1.1 3.0 2.0 Source: Eurostat, ebrd, wiiw.
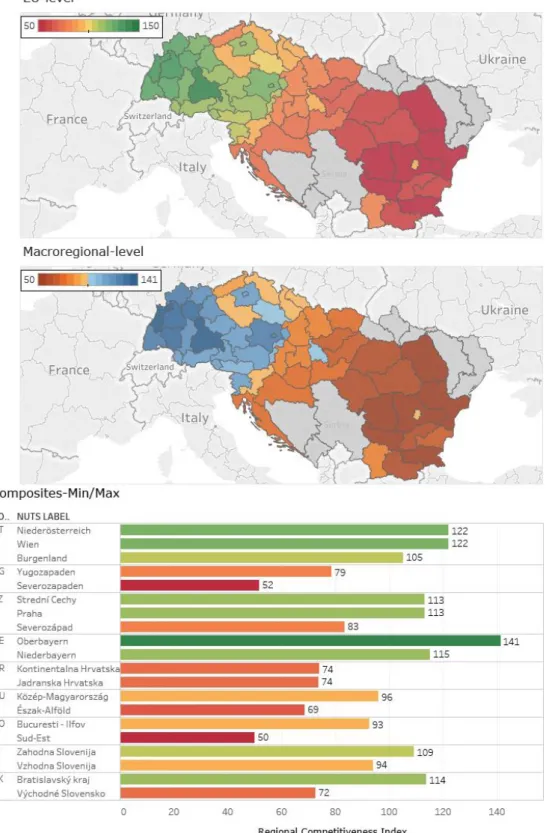
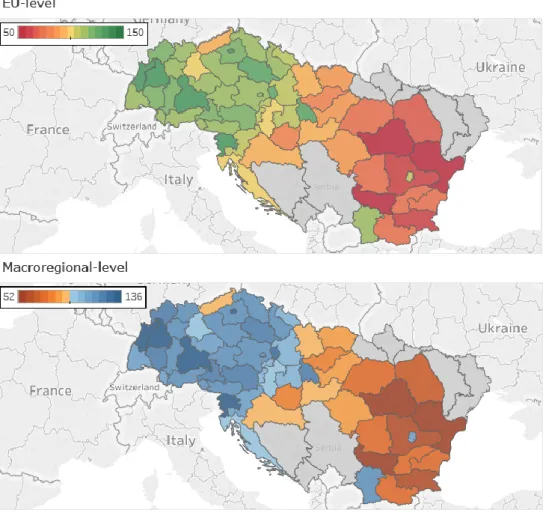
2.3.2 Employment
Figure 2-2: Employment by NUTS-2 in 2015, on an EU-wide (top) and Macro-regional (middle) comparison. The bottom figure shows the Upper/Lower Regions, including their components
Text Box 2-2: Explanation of the indicator: 'Employment'
Labour market statistics are crucial for many EU policies. There are significant labour market disparities within the EU territory as well as in candidate/neighbour countries. The first figure on the left shows the employment situation from the perspective of a
composite index based on the following indicators: i) Economic activity rate, which describes an economy’s ability to attract and develop a great share of human capital from its population; ii) Employment rate combined with Unemployment Rate, providing useful information about the ability to utilize available labour; iii) Youth unemployment rate, as an indicator showing the match between the existing skills within the young people and the employment opportunities offered by the regional economies; iv) and Long term unemployment rates, which indicate inefficient labour markets. More elaborate descriptions of the composite indicator can be found in the methodology.
In the Danube macro-region, Germany and Austria take the leading position on the employment composite indicator. All NUTS-2 regions in Germany and Austria lie above the EU-median. While in 2008 the NUTS-2 regions in Austria were initially leading the list, the German regions took the lead in 2015. Successful labour market policies are likely to have played a major role in delivering the good performance of the regions in these two countries including on dual vocational training, which plays an important role in reducing youth
unemployment. The German regions even managed to reduce unemployment, youth unemployment and long-term unemployment rates over the period
analysed. This achievement can largely be attributed to successful labour market policies that were implemented during the first five years of the first decade of the millennium.
In 2015 as well as in 2008, the lowest performers in the macro-region are the NUTS-2 regions of Croatia, Hungary, Bulgaria, and Romania. However, the regions of Hungary, Bulgaria, and Romania made considerable progress in reducing their gap to the EU-median when comparing the two years.
In 2008, a small number of regions in the new Member States performed above the EU-median (six regions in the Czech Republic and one region in Slovakia, Bulgaria, and Romania respectively). By 2015, the number of regions in the new Member States with a performance above the EU-median had increased
significantly. Thus, in 2015 this group again includes all Czech regions, but also three Romanian regions, three Hungarian regions, one Slovenian, and one Bulgarian region. A look at the developments behind the data shows favourable dynamics of the employment and economic activity rates in the Czech and German regions, as well as in the most Hungarian and Romanian regions, and in half of the Slovakian regions reflecting a positive progress in the catching up process of the new EU Member States. However, an adverse development regarding these indicators is seen in half of the Bulgarian regions (due to the slow recovery following the economic and financial crisis), Croatia and Slovenia (due to the long lasting recession in both countries).
Unemployment rates declined in 2015 in the German and Hungarian regions.
Although the data for 2015 show an increase of unemployment in Bulgaria, Austria, Romania, Slovenia, and Slovakia, all these countries except for Austria reduced their unemployment rate dramatically during 2016 and 2017. Moldova shows a low employment rate, but also a low unemployment rate, which may be due to the high migration rate.
As for the EU candidate, potential candidate and the other non EU countries for three of the above indicators (Table 2-8) the definitions differ from those for the indicators available for the EU-countries in the macro-region, these countries have not been included in the composite indicator. The data are presented and analysed below.
Table 2-8: Employment and Unemployment in (potential) candidate and neighbouring countries
Economic
activity rate Unemployment Youth
unemployment Long term
unemployment Employment rate
2008 2015 2008 2015 2008 2015 2008 2015 2008 2015 Moldova 49.0 46.9 4.0 4.9 11.2 12.8 1.2 1.5 n/a n/a Ukraine 67.8 66.3 6.4 9.1 13.3 22.4 1.2 2.1 n/a n/a Montenegro 61.2 62.6 16.8 17.5 n/a 37.6 13.4 13.6 50.8 51.4 Serbia 62.7 63.7 13.6 17.6 35.2 43.2 9.7 11.3 53.7 52.1 Bosnia and
Herzegovina 53.5 54.6 23.5 27.9 47.5 62.3 20.3 22.8 40.7 39.2 Source: Eurostat.
While for Moldova and the Ukraine the unemployment, youth unemployment and long-term unemployment are relatively low, for the Western Balkan countries all these three indicators show high levels. Moreover, they also show a rising trend from 2008 to 2015 which hints to persistent structural problems on the labour markets of these countries. These may be due to a mismatch between the available qualifications and the requirements of the employers and also to an active informal job market. The economic activity and employment rates are relatively low, whereas a gender gap can be observed. These rates are significantly lower for women compared to men. This is due to the traditional role of women and low availability of childcare facilities in these countries. In Moldova unemployment is low due to the high migration of work force. In all Western Balkan countries and Moldova informal employment is high accounting to at least 30%.12
12International Labour Organization (2011): A comparative Overview of Informal Employment in Albania, Bosnia and Herzegovina, Moldova and Montenegro. URL:
http://www.ilo.org/wcmsp5/groups/public/@europe/@ro-geneva/@sro- budapest/documents/publication/wcms_167170.pdf
2.3.3 Social Progress Index
Figure 2-3: Social Progress by NUTS-2 in 2016, on an EU-wide (top) and Macro-regional (middle) comparison. The bottom figure shows the Upper/Lower Regions, including their components