STUDY ON
MACROREGIONAL
STRATEGIES AND THEIR LINKS WITH COHESION POLICY
DATA AND ANALYTICAL REPORT FOR THE EUSALP
NOVEMBER 2017
EUROPEAN COMMISSION DIRECTORATE-GENERAL REGIONAL AND URBAN POLICY
STUDY ON
MACROREGIONAL
STRATEGIES AND THEIR LINKS WITH COHESION POLICY
DATA AND ANALYTICAL REPORT FOR THE EUSALP
ADDRESS COWI A/S Parallelvej 2
2800 Kongens Lyngby Denmark
TEL +45 56 40 00 00 FAX +45 56 40 99 99 WWW cowi.com
CONTENTS
1 Introduction to the Report 9
1.1 The EUSALP – Background 9
2 State of the Macro-Regions (Task 1) 14
2.1 Introduction to Task 1 14
2.2 Methodological Framework for Task 1 15
2.2.1 Macro-regions 15
2.2.2 Indicator Analysis 16
2.2.3 Composite Benchmarks 17
2.3 Macroeconomic Overview 22
2.3.1 Economic Performance 23
2.3.2 Employment 26
2.3.3 Social Progress Index 28
2.4 Macro-regional Economic Integration 30
2.4.1 Labour Integration 32
2.4.2 Trade Integration 35
2.4.3 Capital Integration 37
2.4.4 Energy Integration 39
2.4.5 Accessibility Potential 42
2.4.6 Transnational Cooperation 44
2.5 Competitiveness 46
2.5.1 Overall Competitiveness 47
2.5.2 Business 57
2.5.3 Transport 62
2.5.4 Tourism 66
2.5.5 Energy 68
2.5.6 Climate Change: Adaptation 75
2.5.7 Climate Change: Mitigation 78
2.5.8 Environment: Air Quality 82
2.5.9 Environment: Air Pollution 84
2.5.10 Environment: River Status 87
2.5.11 Biodiversity: Natura 2000 89 2.5.12 Diversity of Land Cover (Shannon Index) 91
2.5.13 Eco-Innovation Scoreboard 94
2.5.14 Resource Efficiency (composite of Eco
Innovation Scoreboard) 96
2.5.15 Agricultural Impact 98
2.5.16 Forestry in the Alps 103
2.7 Political, Institutional & Governance Indicators 107
2.7.1 Governance 108
2.7.2 Public Institutions 110
2.7.3 Voice and Accountability 112
2.7.4 Human Trafficking 114
2.7.5 Number of Drug Seizures 116
2.8 Meta-analysis 118
2.8.1 Macroeconomic Indicators 118
2.8.2 Macro-regional Integration 119
2.8.3 Competitiveness 120
2.8.4 Institutions, Governance, Political 122
3 Review of the Macro-regional Strategies (Task
2) 125
3.1 Introduction to Task 2 125
3.2 Methodology for Task 2 126
3.3 Review of the EUSALP (Task 2a) – Summary 132 3.4 Achievements of the EUSALP (Task 2b) 135
3.4.1 Achievements – content-wise 135
3.4.2 Achievements – process-wise 139
3.5 Comparison of objectives of the EUSALP with
achievements (Task 2c) 144
3.6 EUSALP and ESIF (Task 2d) 149
3.7 EUSALP AG 6 – factsheet 154
APPENDICES
TASK 2a: Review of the EUSALP A.1 Introduction
A.2 Methodological Framework
A.3 Objective 1: Fair access to job opportunities A.4 Objective 2: Sustainable internal and external
accessibility to all
A.5 Objective 3: A more inclusive environmental framework for all and renewable and reliable energy solutions for the future
List of literature
List of Abbreviations
Abbreviation Stands for
AG Action Group
AP Action Plan
BSAP Baltic Sea Action Plan BSLF Baltic Sea Labour Forum
BSN Baltic Science Network
BSR Baltic Sea Region
BSR Stars PA Innovation (EUSBSR) flagship
BUP Baltic University Programme
CBC Cross Border Cooperation
CBSS The Council of the Baltic Sea States
CEF Connecting Europe Facility
CF Cohesion Fund
CISE Common Information Sharing Environment
DG Directorate-General
EAFRD European Agricultural Fund for Rural Development
EC European Commission
ECTS European Credit Transfer System
ECVET European Credit system for Vocational Education and Training
EFTA European Free Trade Association EMFF European Maritime and Fisheries Fund
ERASMUS+ EU Programme for Education, Training and Sport ERDF European Regional Development Fund
ESF European Social Fund
ESIF / ESI funds European Structural and Investment Funds ETC European Territorial Cooperation
EU European Union
EUSAIR European Union Strategy for the Adriatic-Ionian Region
EUSALP European Union Strategy for the Alpine Region EUSBSR European Union Strategy for the Baltic Sea Region EUSDR European Union Strategy for the Danube Region EWTCA East West Transport Corridor Association
HAC Horizontal Action Coordinator (EUSBSR)
HELCOM Baltic Marine Environment Protection Commission
HLG High Level Group
IALA Navigation in the IMO, International Association of Marine Aids to Navigation and Lighthouse Authorities
ICPDR International Commission for the Protection of the Danube River
IHO International Hydrographic Organisation IMO International Maritime Organisation
MA Managing Authority
MRS Macro-regional strategy/-ies
MS European Union Member States
MSFD Marine Strategy Framework Directive
NCs National Coordinators
NCM Nordic Council of Ministers
NDEP Northern Dimension Environmental Partnership NEFCO Nordic Environment Finance Corporation
NGO Non-governmental organisation
NUTS Nomenclature of territorial units for statistics
OP Operational Programme
OVI Objectively Verifiable Indicators
PA Policy Area / Priority Area / Pillar / Action area PA Education Policy Area Education (EUSBSR)
PA Innovation Policy Area Innovation (EUSBSR) PA Nutri Policy Area Nutrition (EUSBSR) PA Safe Policy Area Safety (EUSBSR) PA Transport Policy Area Transport (EUSBSR) PAC Policy / Priority Area Coordinator
RDP Rural Development Programme
S2W School to Work (PA Education (EUSBSR) flagship)
SG Steering Group
SME Small and medium-sized enterprises
SWD Commission Staff Working Document
TEN-T The Trans-European Transport Networks
TO Thematic objective
TNK Transnational Component
TSG Thematic Steering Group
VET Vocational Education and Training
WFD Water Framework Directive
1 Introduction to the Report
The 'Study on macro-regional strategies and their links with cohesion policy' consists of four task, which are summarised and concluded upon in the Final Report. The first two tasks (Task 1 and Task 2) have been reported on individually, and the present report contains the data and analysis for these two tasks for the European Union Strategy for the Alpine Region (EUSALP).
This report begins with a brief section presenting the EUSALP, followed by
›
the first major part (section 2) of the report, which contains the data and analytical report for Task 1, i.e. a description and an analysis of the overall context of the Alpine macroregion;›
thereafter, the second major part (section 3) contains the data and analytical report for Task 2, analysing the overall achievements of the EUSALP and an evaluation of its contribution to strengthening the territorial cohesion objective of the EU. Task 2 is divided into the following four sub- tasks:›
Task 2a: Review of the EUSALP›
Task 2b: Achievements of the EUSALP›
Task 2c: Comparison of objectives of the EUSALP with achievements›
Task 2d: EUSALP and ESIF1.1 The EUSALP – Background
The EU Strategy for the Alpine Region (EUSALP) was developed by the European Commission together with countries and stakeholders of the Danube region. The strategy builds on a high level of existing cooperation, for instance the Alpine Data and analysis
report for Task 1 and Task 2
Structure of the report
Convention. The EUSALP aims to both extend and deepen this existing regional cooperation.
Three broad thematic policy areas – economic growth and innovation, mobility and connectivity, and environment and energy – are specified in the strategy.
Each of these areas includes a number of Actions that should contribute to the EUSALP's main objective, namely "to ensure that this region remains one of the most attractive areas in Europe, taking better advantage of its assets and seizing its opportunities for sustainable and innovative development in a European context".1
The EUSALP is the youngest of the four macro-regional strategies and it has 5 EU member states which are part of the EUSBSR and 2 non-EU members. The strategy's 48 regions are located in seven member countries: five EU Member States and two non-EU countries, which both are EFTA members.
Table 1-1 Countries and key features of the EUSALP
Countries and regions Key features
Austria
France (Franche-Comté, Rhône-Alpes, Provence- Alpes-Côte d'Azur)
Germany (Baden- Württemberg, Bavaria)
Italy (8 regions)
Slovenia Third countries:
Liechtenstein
Switzerland
Representing 80 million inhabitants or nearly 16% of the EU population
5 EU Member States
2 non-EU members (Lichtenstein, Switzerland)
1 https://www.alpine-region.eu/ and COMMISSION STAFF WORKING DOCUMENT, Action Plan, Accompanying the document COMMUNICATION FROM THE COMMISSION TO THE EUROPEAN PARLIAMENT, THE COUNCIL, THE EUROPEAN CONOMIC AND SOCIAL
COMITTEE AND THE COMITTEE OF THE REGIONS concerning the European Union Strategy for the Alpine Region {COM(2015) 366 final}, SWD(2015) 147 final
Figure 1-1: The EUSALP by NUTS2 Regions
The EUSALP strategy includes a number of objectives and actions which are implemented through 9 action groups (hereafter AGs).
Table 1-2 EUSALP: objectives and actions
Objectives Actions
1st OBJECTIVE: Fair access to job opportunities, building on the high competitiveness of the Region
Action 1: To develop an effective research and innovation ecosystem Action 2: To increase the economic potential of strategic sectors
Action 3: To improve the adequacy of labour market, education and training in strategic sectors
2nd OBJECTIVE: Sustainable internal and external accessibility to all
Presentation of the topic
Action 4: To promote inter-modality and interoperability in passenger and freight transport
Action 5: To connect people electronically and promote accessibility to public services
3rd OBJECTIVE: A more inclusive environmental framework for all and renewable and reliable energy solutions for the future
Action 6: To preserve and valorise natural resources, including water and cultural resources Energy
Action 7: To develop ecological connectivity in the whole EUSALP territory Action 8: To improve risk management and to better manage climate change, including major natural risks prevention
Action 9: To make the territory a model region for energy efficiency and renewable energy
The strategy and first action plan were adopted by the Council in October 2015.
The action plan is from March 2016. The first revisions of the actions plans are scheduled for 2019. The current action plan includes 9 action groups2.
Governance of the EUSALP consist of a number of actors and institutions as listed in Table 2-1. The action groups are key implementers of the strategy.
Table 1-3 Roles and responsibilities in the EUSALP3
Actors/roles Description
national coordinators overall coordination of EUSALP implementation in country Managers key forces to drive implementation of relevant thematic areas
forward
Action groups National sector experts (check)
Managing Authorities bodies in charge of implementation of programmes/financial instruments
General assembly strategic coordination Executive board
2 COMMISSION STAFF WORKING DOCUMENT. European Union Strategy for the Alpine Region. ACTION PLAN {COM(2015) 366 final}. Brussels, 28.7.2015
SWD(2015) 147 final
3 Roles and responsibilities of the implementing stakeholders of the EUSBSR and a flagship project concept. Working document. January 2013. EUSBSR Strategy and action
plan
Governance
STATE OF THE
MACRO-REGIONS
EUSALP (TASK 1)
2 State of the Macro-Regions (Task 1)
2.1 Introduction to Task 1
This report presents the results of Task 1 of the 'Study on Macro-Regional Strategies and their links with cohesion policy' for the Alpine Macro-regional Strategy. Three other reports of the same structure cover the remaining three macro-regions: the Baltic Sea, the Adriatic and Ionian Sea, and the Danube Strategy.
This report provides an 'indicator-based description and analysis of the overall context of [the] macro-regions'4. This report aims further to provide a context that is detached from the Macro-regional Strategy concept and does not provide an evaluation of the Macro-regional strategies objectives; which is addressed in the Task 2 report. The description and analysis is structured along four specific headlines: macro-economic overview; macro-regional integration;
competitiveness; and the political, institutional and governance context. There is a chapter on each of these dimensions, followed by a synthesised meta-analysis.
Prior to these indicator-based chapters, the report provides a brief methodological overview.
For each indicator that is described, the report first provides a graphical
illustration of the indicator values. This is followed by a description and analysis of the indicator values in question.
4 The study Specifications
2.2 Methodological Framework for Task 1
2.2.1 Macro-regions
The concept of Macro-regions refers to a grouping of regions that principally share a common functional context, such mountains, sea-basins, or river-basins, and 'in which the priorities and objectives set out in the corresponding strategy can be properly addressed'5. While this grouping of territories into macro-regions thus follows a functional logic, it remains an artificial construct in terms of a governance or territorial unit. Therefore, contextual information for a macro- region as a whole is not readily available. This is reflected in the fact that no selection of relevant information is available on an aggregated level.
The family of reports under Task 1 aims at filling this gap. They seek to provide a set of relevant information that closes this gap and draws valid inferences on the overall context of the macro-region in question.
More specifically, the context of the macro-regions is described through a set of indicators on four dimensions (macroeconomic overview, integration,
competitiveness and the institutional / governance context). The four types of indicators provide a research framework upon which the Task builds, and essentially reflect the EU’s principal policy of Economic-, Social-, and Territorial Cohesion as follows:
›
Macroeconomic indicators reflect the (socio) economic context of the individual economies as well as the macro-region as a whole. Further, they also serve as overview indicators on the overall social- and economic cohesion.›
Macro-regional economic integration indicators describe the intensity of cooperation, integration and (economic, cultural) exchange among the countries of a macro-region, and essentially reflect the state of territorial cohesion.›
Competitiveness indicators provide a more detailed insight into the (broadly defined) competitiveness of countries and macro-regions on various aspects. These indicators provide inference on factors that affect the three Cohesion objectives.›
Political, institutional and governance indicators mirror the political state of a macro-region in terms of governments’ accountability or effectiveness of legislation. These indicators mirror the likely capacity to effectively pursue interventions on the economic, social as well as territorial cohesion.
5 Study specifications The Macro-Regional
Framework
Indicators to provide an overall context of the Macro-regions
The reports provide a picture of the status of the macro-region in question, of the developments inside the macro-regions and when possible (i.e. data allows) a comparison of the current results with the results of the past. The family of Task 1 reports thus explores and analyses the overall context of the four
existing Macro-Regional Strategies (MRS), namely the EU Strategy for the Baltic Sea Region (EUSBSR), the EU Strategy for the Danube Region (EUSDR), the EU Strategy for the Alpine Region (EUSALP) and the EU Strategy for the Adriatic and Ionian Region (EUSAIR). The analysis is thus as such detached from the contents of each of the macro-regional strategies. Rather, it focuses on the comparable assessment of the socioeconomic and macro-regional integration status within the macro-regions, as well as on the comparable investigation of their performance regarding competition and efficient institutions and
governance.
2.2.2 Indicator Analysis
A first step of Task 1 focused on the construction of a set of indicators which are relevant to macro-regions on a macro-regional level. For this, indicators were first identified by the consultant, and the final selection was done in close cooperation with DG REGIO. Consultations with DG REGIO and members of the Steering Committee served to ensure an eventual comprehensive and relevant picture of the macro-regions.
For the identification of indicators statistical units had to be considered. Given that the macro-regions in some cases consist of regions and not entire
countries, the geographical level of the analysis is principally conducted at level 2 of the Nomenclature of territorial units for statistics (NUTS-2), as defined by the EU. However, in some cases data are not available at NUTS-2 level of aggregation but at NUTS-1 level or country level only. In these cases the missing information for the NUTS-2 level has been substituted by data from the first available aggregation level above it, i.e. if statistical information on a measure was available at NUTS-1 level, the same performance measure was assumed to apply at the NUTS-2 level. For some variables only country-specific information was available. This applies for example to the macro-regional integration indicators.
The statistical units for regions outside the EU were chosen according to the countries’ own aggregation at NUTS-2 level (equivalent to SR36) as defined by the EU. Only very few data were available at a level comparable with the NUTS- 2 level of the EU. Furthermore, most analysed countries outside the EU are quite small, and most data for the regions outside the EU have therefore been chosen at country level of aggregation.
6 The NUTS classification is defined only for the Member States of the EU. Eurostat, in agreement with the countries concerned, also defines a coding of statistical regions (SR) for countries that do not belong to the EU but are either candidate countries, potential candidate countries or countries belonging to the European Free Trade Association (EFTA).
Eurostat and Serbia have not yet agreed on statistical regions for the country.
Choosing macro- regionally relevant indicators
Emphasis on regional indicators where possible
The main sources of data used in this report are the Eurostat-Database supplemented with data from the World Bank Database, OECD, UNCTAD, COMTRADE, EEAA, ESPON project. Most NUTS-2 data are published with a time lag of one or two years. In order to create a common basis across the macro- regions and the themes, the description and analysis are generally based on data available for the year 2015 or the latest available data for all considered regions. When possible, a comparison is provided between the latest available year data and the data for 2008 for the Baltic Sea and Danube macro-regions.
The year 2008 also is the year just before the creation of these two macro- regional strategies. For the two newer macro-regions, the Alpine and Adriatic Ionian macro-regions it is the year 2011 that is compared to 2015. The year 2011 is the year just before the creation of the Alpine and Adriatic Ionian macro- regions and it offers a timespan long enough in order for changes to become visible.
Each of the quantitative and qualitative indicators identified as best describing the socio- economic context, integration, as well as the competitiveness, institutional and governance situation of the four macro-regions was subject of an assessment against the RACER framework. RACER stands for “Relevant, Acceptable, Credible, Easy, Robust” and enables a judgement on each indicator’s properties and qualities. Each RACER criterion has been assessed on a three- level scoring scale (green: criterion completely fulfilled; orange: criterion partly fulfilled; red: criterion not fulfilled). Based on the strengths and weaknesses of each of the quantitative and qualitative indicators across all the RACER criteria, a list of indicators was selected out of a pool of indicators considered.
The indicators which complied with all RACER criteria (green overall) have been definitely included into the set of selected indicators; those, which did not comply with all RACER criteria (a mix of green, red and yellow) and were not of high importance for the considered macro-region have been left outside.
2.2.3 Composite Benchmarks
As it is not possible to monitor all dimensions of a macro-region with one single indicator, a larger number of indicators has been selected. An additional challenge is that a macro-region’s picture comprises the four dimensions (macro-economic, macro-regional integration, competitiveness and political- institutional- governance) but each dimension cannot be captured by one single quantitative indicator.
In order to cope with this challenge, all indicators with a common theme have been aggregated into composite indices. Composite indices bundle separate (component) indicators into one index which allows the values of the whole bundle expressed as only one measure7; examples of such indices are the Human Development Index, Environmental Sustainability Index, and stock indices like the NASDAQ Index. In the course of gathering indicator data, the data have been grouped into sets of related indicators according to appropriately
7 See http://www.investopedia.com/terms/c/compositeindex.asp Composite Indices
identified themes. Themes have been chosen so that the indicators together represent an “essential feature” of and within a macro-region. The individual indicators have been aggregated without any weights and each composite index hence represents the unweighted average of all indicators.
Different indicators generally apply different scales, such as percentages, currencies or categorical data (e.g. chemical status of waterbodies). The
aggregation of such different scales only makes sense for comparable variables.
Each indicator therefore needs to be normalised (to a common scale) before these can be combined into a composite index. For this aggregation, the proprietary ‘emb’ model (equilibrated medial benchmarking) has been applied8. The benchmarking analysis focuses on the four macro-regions and the four dimensions inside each macro-region compares countries and/or NUTS-2 regions inside the individual macro-region based on a common reference framework of EU countries. The reference framework for each component indicator or composite index is delineated by the “top performer” of EU28 countries (benchmarked at 150), the “lowest performer” (50) and the median performer(s) at 1009. A high benchmarking score always reflects a more
“desirable” situation. Taking unemployment rates as an example, higher scores reflect lower unemployment rates. In this way, the benchmarking results can always be read as showing whether – and to what extent – they are above or below the median in the EU at country level. This common framework enables observations to be made across different regions, even though the main focus remains within each macro-region.
The benchmark is always scaled on a country level against all EU28 Member States. The benchmarking score hence indicates a country’s or region’s relative position to all EU28 countries. This means in turn that one can observe values above 150 and below 50 in the cases summarised in the table below.
8 For the Proprietary Method of constructing indices from multiple indicators refer to: Fink, M. et al. (2011), Measuring the impact of flexicurity policies on the EU labour market, IHS Research Report, commissioned by DG EMPL (Employment, Social Affairs and Inclusion).
9 The median is the point in a dataset in which a split of that dataset results in two sets with an equal number of data points. See http://www.investopedia.com/
terms/m/median.asp for more details Composite
Benchmarks
Table 2-1: Cases with benchmarking scores above 150 and below 50
Case Explanation
Regional analyses (NUTS-2 level)
A NUTS-2 region may out-/underperform its country. Such as Stockholm (SE), performing higher than Sweden as a whole.
Non-EU countries A non-EU country is not included in the benchmarking scale. Thus, a country like Ukraine may score above 150 or below 50, as they are not included in the scaling.
Macro-regional Integration analyses
Countries that are stronger/weaker integrated in a macro-region than the EU’s ‘top performing’/’bottom performing’ country is integrated in the EU28 (see paragraphs below).
For example, Germany’s trade integration with countries in the Danube region comprises only a small share of its trade with all EU28 countries and is at the same time lower than that of the EU’s
‘bottom performer’.
The chapter on integration includes new integration indices. These IHS- proprietary indices cover respectively Labour Integration (three indices plus a composite of these 3 components), Capital Integration (Foreign Direct
Investment (FDI), Energy Integration, and Trade Integration. Each of these seven indices is constructed on a similar principle, which is outlined as follows.
When the amount or value of labour, capital etc. supplied by a country to another country (a ‘partner’), or, equivalently, received from a partner, increases, it can be said that the level of integration between the two has increased. Considering a particular group of countries, the focus is on the bilateral flows between them. For the task of estimating integration within macro-regions, i.e. between individual countries belonging to the macro-region in question, the first step is the development of a “Bilateral Flow Matrix”, as shown in the table below.
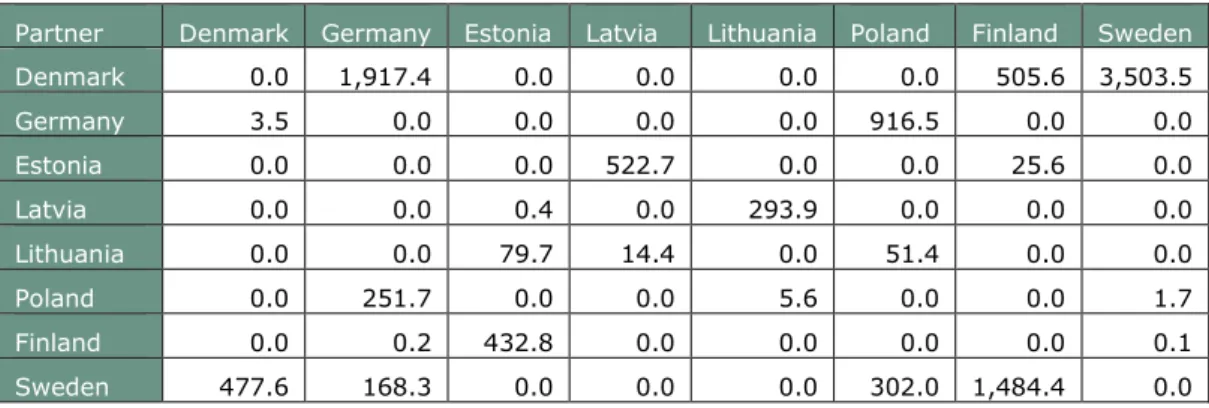
Table 2-2: Energy Integration Example (Baltic Sea), energy exports (kTOE)
Partner Denmark Germany Estonia Latvia Lithuania Poland Finland Sweden
Denmark 0.0 1,917.4 0.0 0.0 0.0 0.0 505.6 3,503.5
Germany 3.5 0.0 0.0 0.0 0.0 916.5 0.0 0.0
Estonia 0.0 0.0 0.0 522.7 0.0 0.0 25.6 0.0
Latvia 0.0 0.0 0.4 0.0 293.9 0.0 0.0 0.0
Lithuania 0.0 0.0 79.7 14.4 0.0 51.4 0.0 0.0
Poland 0.0 251.7 0.0 0.0 5.6 0.0 0.0 1.7
Finland 0.0 0.2 432.8 0.0 0.0 0.0 0.0 0.1
Sweden 477.6 168.3 0.0 0.0 0.0 302.0 1,484.4 0.0
Immediately, certain strong relationships between certain country-pairs are visible. What such a table of absolute values does not make clear is the
‘importance’ of a bilateral relationship for a specific country. A second step Integration Indices
therefore converts the data to a relative share of all its exports (or foreign investments, migration flows, remittances) (in worldwide).
Table 2-3: Energy Integration Example, Share of total exports to partner country (in %)
Partner Denmark Germany Estonia Latvia Lithuania Poland Finland Sweden
Denmark 0.0 11.8 0.0 0.0 0.0 0.0 3.1 21.5
Germany 0.0 0.0 0.0 0.0 0.0 1.5 0.0 0.0
Estonia 0.0 0.0 0.0 24.8 0.0 0.0 1.2 0.0
Latvia 0.0 0.0 0.0 0.0 13.8 0.0 0.0 0.0
Lithuania 0.0 0.0 0.9 0.2 0.0 0.6 0.0 0.0
Poland 0.0 1.2 0.0 0.0 0.0 0.0 0.0 0.0
Finland 0.0 0.0 5.8 0.0 0.0 0.0 0.0 0.0
Sweden 2.6 0.9 0.0 0.0 0.0 1.6 8.1 0.0
The new integration index provides a common basis for measuring integration in each of the four macro-regions, just as the case for every other indicator
considered in this study. Given that the number of countries in the macro- regions vary, the total share of e.g. energy exports to the macro-region would grow with the number of member countries. Therefore, to provide a measure of integration that is not affected by the size of a macro-region, the chosen measure for each country’s degree of integration within its macro-region is its per partner share (ppShare); i.e. the average flow to a destination country.
Table 2-4: Energy Integration Example, resulting per partner share
Partner ppShare
Denmark 5.21
Germany 0.22
Estonia 3.72
Latvia 1.98
Lithuania 0.23
Poland 0.18
Finland 0.83
Sweden 1.90
In the case of integration indices, the procedure to establish the benchmark is identical in formation as for the other indices, except that in this case the bilateral flow matrix is 28 x 28 for the EU28. Thus, the benchmark is defined by the average share that each Member State exports to the EU28 countries. This results in a per partner share of each Member State, but to the whole EU28, instead of a macro-region.
In other words, using the per partner share as a unit of measure enables the degree of integration within each macro-region to be benchmarked against the degree of integration in the EU as a whole. This provides a deep insight into the question of whether the common geographical basis (and more) for the macro- regions is actually, and to what extent, of particular relevance compared to the Benchmarking
Integration Indices
entire setting of all EU countries, which may in general cover a more or less contiguous area, but which course also comprise (even more) multiple regional contexts.
As mentioned in Table 2-1 above, there are many cases found to score well below 50 or well above 150. This is entirely consistent: The reason, expressed mathematically, is that the two-dimensional flow matrices gives rise to country index values in macro-regions that are not subsets of the EU index; for non- integration indices, in contrast the (EU) country indicator values form by definition a subset of the EU28.
Each composite index is accompanied by a figure that consists of two maps and one bar chart. Both maps show the composite index values for each NUTS region in differing colour schemes. The first map provides a coloured illustration of the scores on a scale from 50-150 and reflects how a given region performs on the EU28-wide level (i.e. 100 reflects the EU28 median). Any regions scoring outside this defined range are displayed as 50 or 150.
The scale of the second map is in turn defined by the lowest and highest composite index scores found for the macro-region and seeks to highlight the differences between the high and low performing regions of that macro-region more clearly. As a result, the range of this scale depends on the maximum and minimum scores for each individual composite index in a given macro-region.
The bar chart identifies the two regions with the highest and lowest composite index scores in each country, accompanied by the (benchmarked) scores of the index’s components. The colouring scale ranges from 50 to 150.
Synchronous to this report, a digital toolbox has been developed. The digital toolbox comprises a set of data files for each of the four macro-regions. Each file contains data sheets for each indicator used to assess the context of the macro- regions. As mentioned above, data has been organised separately for the appropriate NUTS regions and countries in each of the four macro-regions, and each indicator, or composite, corresponds to an excel sheet for each macro- region. The excel sheets have been grouped according to the four dimensions (macro-economic, macro-regional integration, competitiveness and political- institutional- governance). Furthermore, within each dimension, sheets have been grouped according to agreed aggregated compositions i.e. as composite indices).
An index page (usually on the first data sheet of each file) will enable users to directly find the data sheet for a named indicator (by clicking on an excel hyperlink).
A second set of excel files has been established for documenting the results of the benchmarking process. There is a file for each individual macro-region. This contains datasheets corresponding to indicators, grouped according to the above-mentioned four dimensions. Within these, they are further grouped according to the agreed aggregated composition of composite indices.
Illustrative Maps
Digital Toolbox
2.3 Macroeconomic Overview
In this chapter the overall macroeconomic state of the macro-region will be assessed through analyses focused on three major themes: economic
performance, employment, and social equality. The macroeconomic indicators that were chosen reflect the (socio) economic context of the individual
economies as well as of the macro-region as a whole.
The table below provides an overview of the indices that are presented in this chapter:
Table 2-5: Overview of macro-economic overview indicators
Composite Economic performance indicators
Employment indicators Social progress indicators
Components
GDP/capita Employment index Social progress index10
GDP growth Unemployment rate
Labour productivity Youth unemployment
Long term unemployment
Economic activity rate
Employment rate
10 A composite index based on 53 indicators covering basic human needs, conditions for well-being and opportunity to progress
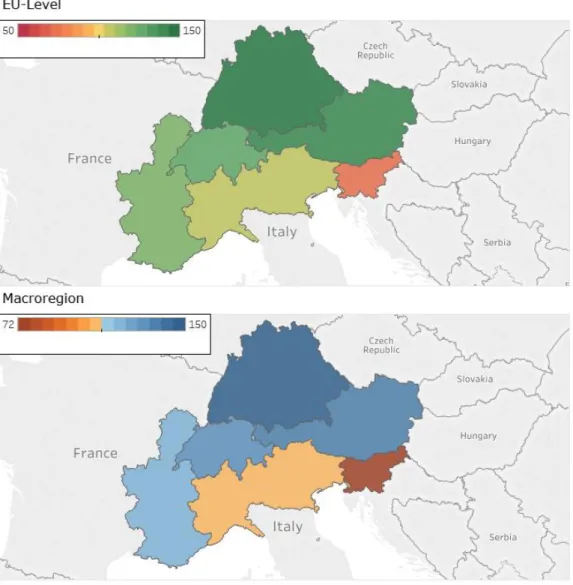
2.3.1 Economic Performance
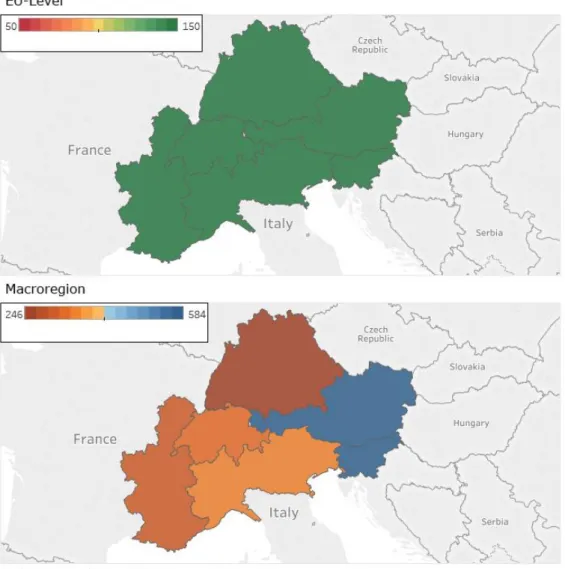
Figure 2-1: Economic Performance by NUTS-2 in 2014, on an EU-wide (top) and Macro- regional (middle) comparison. The bottom figure shows the Upper/Lower Regions, including their components
Text Box 2-1: Explanation of the indicator: ‘Economic Performance’
To assess the economic performance on NUTS-2 regions inside the macro-region three indicators: regional Gross Domestic Product (GDP) per capita (at purchasing power parity), Real GDP growth rate and Labour Productivity have been bundled into one composite indicator: Economic performance index.
Regional gross domestic product (GDP) is used for the measurement and comparison of the economic activity of regions. It is the most important indicator used in the EU's regional policy for the selection of regions eligible for support under the investment for growth and jobs goal of the EU. GDP is the standard measure of the value of the production activity (goods and services) of resident producer units.11 For this indicator regional data are available with a time lag of two years. Thus regional GDP data for the reference year 2015 have been released at the beginning of 2017. Real GDP is usually a proxy for economic prosperity. GDP per capita, however, does not reflect the equality of distribution of that prosperity, so it is not representative for many social issues.
The real percentage-growth rate of gross value added (i.e. Real GDP growth) allows the identification of the most and less dynamic regions in the EU and the non-EU regions inside the macro-region.
Labour Productivity has been calculated as Regional Gross Value Added (GVA) per employee. According to the OECD, Labour Productivity measures “how efficiently
production inputs, such as labour and capital, are being used in an economy to produce a given level of output.” Productivity is considered a major source of economic growth and competitiveness. It is used as a main indicator to assess a country’s performance and to perform international comparisons. Over time a country’s ability to raise its standard of living depends to a great extent on its ability to raise its output per worker. There are different measures of productivity.
An analysis of the composite indicator Economic performance in the Alpine macro-region shows a relatively homogeneous picture regarding economic development of its regions. For the years 2011 and 2014 the composite indicator Economic performance shows the highest values for the most regions in
Germany and Austria, as well as for three regions in Northern Italy, Provincia Autonoma di Bolzano, Lombardia, and Provincia Autonoma di Trento. Also the rest of the regions in the macro-region exhibit values for this indicators which are above the EU-average. Switzerland accounts nearly exclusively, with the exception of the canton Ticino, for the better performing half of the
benchmarking scoring (see bottom map above).
The lowest values for the indicator Economic performance can be found in Slovenia. While most German and Austrian NUTS-2 regions improved their position in the period 2011 to 2015, the regions in France, Italy, and Slovenia
11 https://www.oenb.at/en/Statistics/Standardized-Tables/Economic-and-Industry- Indicators/Economic-Indicators/nominal-gpd-growth-expenditure-side.html
slightly worsened their position. This was due to the long lasting banking crisis in Slovenia, the modest GDP growth in France after the GDP contraction in 2009 and the still persistent debt and banking crisis in Italy.
2.3.2 Employment
Figure 2-2: Employment by NUTS-2 in 2015, on an EU-wide (top) and Macro-regional (middle) comparison. The bottom figure shows the Upper/Lower Regions, including their components
Text Box 2-2: Explanation of the indicator: 'Employment'
Labour market statistics are crucial for many EU policies. There are significant labour market disparities within the EU territory as well as in candidate/neighbour countries. The first figure on the left shows the employment situation from the perspective of a
composite index based on the following indicators. i) Economic activity rate, which describes an economy’s ability to attract and develop a great share of human capital from its population; ii) Employment rate combined with Unemployment Rate, providing useful information about the ability to utilize available labour; iii) Youth unemployment rate, as an indicator showing the match between the existing skills within the young people and the employment opportunities offered by the regional economies; iv) and Long term unemployment rates, which indicate inefficient labour markets. More elaborate descriptions of the composite indicator can be found in the methodology.
All NUTS-2 regions in Switzerland, Germany, and Austria in 2011 and 2015 exhibit values above the EU average. These regions were also in a leading position in 2008. This reflects high economic activity and employment rates, coupled with low unemployment. The good performance of the regions in these three countries is due to their successful labour market policies, especially the dual vocational training, which plays an important role in reducing youth unemployment. The German regions even managed to reduce unemployment, youth unemployment and long-term unemployment rates largely due to labour market policies implemented during the first five years of the first decade of the millennium.
In 2011, there were two regions with values below the EU-median: Two Italian (Liguria and Piemonte) and one French (Provence-Alpes-Côte d'Azur). By 2015 however, the number of regions below the EU average increased to nine found in Slovenia, France and Italy12. The long economic recession in Italy and Slovenia (until 2014 and 2013 respectively) that followed the economic and financial crisis had as a consequence rising total unemployment and especially youth unemployment in the NUTS-2 regions in these countries. While Slovenia managed to recover and solve its banking crisis over the last years, Italy is still confronted with a banking and debt crisis.
12 The group was made up by one region from Slovenia (Vzhodna Slovenija), two from France (Franche-Comté and Provence-Alpes-Côte d'Azur), and six regions from Italy (Valle d'Aosta/Vallée d'Aoste, Veneto, Lombardia, Friuli-Venezia-Giulia, Liguria and Piemonte).
2.3.3 Social Progress Index
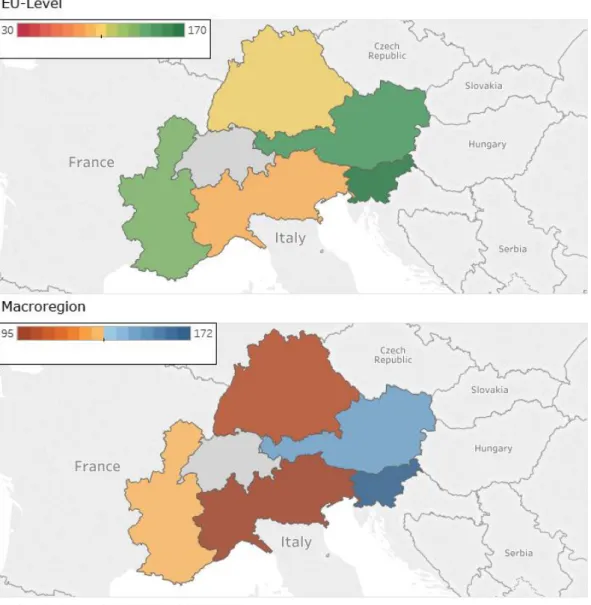
Figure 2-3: Social Progress by NUTS-2 in 2016, on an EU-wide (top) and Macro-regional (middle) comparison. The bottom figure shows the Upper/Lower Regions, including their components
Text Box 2-3: Explanation of the indicator: ‘Social Progress Index’ 13
There is a correlation between the level of economic development and social progress. Thus, the regions with the highest GDP per capita such as the NUTS-2 regions in Austria and Germany are also those regions where the European Union Regional Social Progress Index takes the highest scores. The highest performers are the regions of Salzburg and Tirol in Austria, with the highest scores (above 131 points). They are followed by the other Austrian regions and the German regions with scores above 119 points. The high performance of these regions is due to the highest scores for the component indicators ‘Basic Human needs’. Additionally, Austrian regions show a high performance for the component indicator ‘Opportunity’. The French regions Franche Comté, Rhône Alpes and Provence AlpesCôte d'Azur, and Provincia Autonoma di Trento in Italy register scores just below 113 points. The lowest performers in the macro-region are the NUTS-2 regions Piemonte, Lombardia, Liguria, Valle d'Aosta/Vallée d'Aoste, and Veneto in Italy with values between 86 and 92 points, which is mostly explained by especially low values for the component indicators ‘Access to Advanced Education’ and ‘Environmental Quality’. Slovenia performs better with scores above 108 points.
The overall picture demonstrates that in terms of social progress, the Alpine regions are fairly cohesive and perform mostly above the EU-median.
Furthermore, only about 23% of the regions are below the EU-median. A cross- comparison with the Education Index further manifests northern Italy’s
comparable low performance on education, which exhibits remarkably low tertiary education attainment rates.
13 The index is published by the nonprofit organization Social Progress Imperative. A custom version for the EU regions has been developed in cooperation with the European Commission. See http://www.socialprogressimperative.org/custom-indexes/european- union/
TheSocial Progress Index measures the extent to which countries provide for the social and environmental needs of their citizens.
The Social Progress Index from 2016 bases on fifty-three indicators that cover the fields of Basic Human Needs (Nutrition and Basic Medical Care, Water and Sanitation, Shelter, Personal Safety), Foundations of Well-Being (Access to Basic Knowledge, Access to Information and Communications, Health and Wellness, Environmental Quality), and Opportunity to Progress (Personal Rights, Personal Freedom and Choice, Tolerance and Inclusion, Access to Advanced Education). A ranking of the values of Social Progress Index shows the relative performance of the countries included. For the purpose of this Task, this index has been re-scaled to this report’s format.
2.4 Macro-regional Economic Integration
The emergence of the “new trade theory” (Krugman, 1979)14 in late 1970 with its emphasis on economies of scale put economic integration in the centre of economic debate. According to this theory, companies in small countries tend to exhibit relatively high average costs, while companies in large countries can profit from lower average costs due to size advantages. 15
As a result, regional integration represents an important national policy
alternative for small economies in order to overcome the small size handicap. By joining a regional integration agreement, companies from a small domestic economy may enlarge and be better prepared to face competition from countries with larger domestic economies.16
However, while regional integration gives rise to new opportunities, new challenges may appear. These may take the form of strong restructuring at microeconomic level, with some companies disappearing and other companies growing bigger and becoming successful in international competition.17 In the restructuring process, relatively large and strong companies overtake their weaker competitors. An important role in this respect play mergers and acquisitions involving companies from different countries. Foreign direct investment (FDI) represents thus a channel in the integration process.
Companies with foreign participation, which are usually involved in vertical production networks, are also responsible for a large share of exports and imports. Integration may also lead to trade diversion and erosion of sovereignty.18
In the context of the EU’s long-term objectives, this chapter provides a context on the territorial cohesion of the macro-region, which is one of the three
cornerstones of Cohesion Policy next to economic and social cohesion19 , as well as the degree to which the Single Market20 is fulfilled within the macro-region.
For this analysis, various indicators have been chosen to provide a context of integration. The table below lists the chosen indicators. The macro-regional economic integration indicators chosen describe the intensity of cooperation,
14 Krugman, Paul R. (1979): Increasing returns, monopolistic competition, and international trade, URL:http://www.sciencedirect.com/science/article/pii/0022- 1996(79)90017-5.
15 Gustavson, Patrick & Koko, Ari (2004): “Regional Integration, FDI and Regional Development. European Investment Bank”. In: Papers of EiB-Conferences, Vol. 9, No. 1, pp. 122, Luxembourg.
16 Gustavson, Patrick & Koko, Ari (2004): “Regional Integration, FDI and Regional Development. European Investment Bank”. In: Papers of EiB-Conferences, Vol. 9, No. 1, pp. 122, Luxembourg.
17 Gustavson, Patrick & Koko, Ari (2004): “Regional Integration, FDI and Regional Development. European Investment Bank”. In: Papers of EiB-Conferences, Vol. 9, No. 1, pp. 122, Luxembourg.
18 https://www.globalpolicy.org/nations-a-states/political-integration-and-national- sovereignty-3-22.html
19 Territorial Cohesion, http://ec.europa.eu/regional_policy/en/policy/what/territorial- cohesion/
20 The European Single Market, https://ec.europa.eu/growth/single-market_en
integration and (economic, cultural) exchange among the countries of the macro-region.
Table 2-6: Overview of Macro-regional economic Integration indicators
Composite Components
Labour Integration Intra macro-regional migration
Mobile students from abroad
Workers’ Remittance
Trade Integration Share of exports to macro-region out of total exports
Capital Integration Inward FDI stocks
Energy Integration Exports of energy
Accessibility Multimodal
Road
Rail
Air
Territorial Cooperation Number of organisations participating in INTERREG-IVB
2.4.1 Labour Integration
Figure 2-4: Labour Integration by country in 2015, on an EU-wide (top) and Macro- regional (middle) comparison. The bottom figure shows the Upper/Lower Regions, including their components
Text Box 2-4: Explanation of the indicator: ‘Labour Integration’
To get a picture on the status of labour integration in the macro-regions three indicators are selected: a) Bilateral estimates of migrant stocks in 2013, b) Bilateral Remittance Estimates for 2015 using Migrant Stocks, Host Country Incomes, and Origin Country Incomes (millions of US$) (October 2016 Version) both indicators provided by the World Bank and the c) Share of mobile students from abroad by education level, sex and country of origin, provided by Eurostat have been used to create a composite indicator.
Data on Migration and remittances are based on the Migration and Remittances Factbook 2016 published by the World Bank. It provides a comprehensive picture of emigration, immigration, and remittance flows for 214 countries and territories, and 15 country groups, drawing on authoritative, publicly available data. The data are collected from various sources, including national censuses, labour force surveys, and population registers.
According to the “Recommendations on Statistics of International Migration” by the United Nations Statistics Division (1998), “long-term migrants” are persons who move to a country other than that of their usual residence for a period of at least one year, so that the country of destination effectively becomes their new country of usual residence.
“Short-term migrants” are persons who move to a country other than that of their usual residence for a period of at least three months but less than one year, except for the cases where the movement to that country is for purposes of recreation, holiday, visits to friends and relatives, business, medical treatment, or religious pilgrimage (UN Statistics Division 1998).
A new notion of remittances introduced in the sixth edition of the IMF Balance of Payments and International Investment Position Manual (BPM6)21 is starting to be used by many countries (IMF 2010a). According to the new definition, personal remittances are the sum of two main components: “compensation of employees” and “personal transfers”.
Personal remittances also include a third item: “capital transfers between households,”
but data on this item are difficult to obtain and hence reported as missing for almost all countries.
Compensation of employees22, unchanged from BPM5, represents “remuneration in return for the labour input to the production process contributed by an individual in an
employer-employee relationship with the enterprise.” The definition of “personal transfers,” however, is broader than the old “worker’s remittances” – it comprises “all current transfers in cash or in kind made or received by resident households to or from non-resident households.” Therefore, “personal transfers” include current transfers from migrants not only to family members but also to any recipient in their home country. If migrants live in a host country for one year or longer, they are considered residents, regardless of their immigration status. If the migrants have lived in the host country for
21 IMF (2013): Sixth Edition of the IMF's Balance of Payments and International Investment Position Manual (BPM6). URL:
https://www.imf.org/external/pubs/ft/bop/2007/pdf/appx5.pdf
22 See footnote above
less than one year, their entire income in the host country should be classified as compensation of employees.23
Share of mobile students from abroad enrolled by education level, sex and field of education refers to students from abroad enrolled in tertiary education (level 5-8) in percentage of all students.
The Alpine macro-region shows the highest degree of integration among all analysed macro-regions and the countries of the Alpine macro-region all exhibit high or average levels compared to the EU average. The highest levels are observed for Liechtenstein and Switzerland, followed by Austria. The high value for Liechtenstein is to a certain degree attributable to the high number of students studying in the other countries of the macro-region. Germany, Slovenia, Italy and France have index values below those of the macro-region but above the European average. The lowest labour integration with the other countries in the macro-region is seen for France24.
A close look at the migration, remittances and students’ mobility flows inside the macro-region, discloses some interesting integration patterns. Statistical
evidence shows that geographical proximity, historical and cultural ties and language advantages play an important role for labour integration. Family and friends network that migrants already have in the destination country is another contributing factor (Taylor, 1986)25 . Thus, there is a high degree of integration between Austria and Germany and to a lower extent between Austria and Switzerland; there is a high degree of labour integration between Germany on one hand and Switzerland, Italy, France, and Austria on the other hand;
integration is high between Italy and Germany, France and Switzerland. Most labour migrants from Switzerland can be found in Italy followed by France, Germany and Austria. Slovenian migrants choose Croatia, Germany and Austria.
The data show a very high integration of all these countries with migrants and remittances going in both directions. The strong role of historical and family ties as well as language advantages in this macro-region prevail in the migration decision (e.g. German speaking countries).
23 IMF (2013): Sixth Edition of the IMF's Balance of Payments and International Investment Position Manual (BPM6). URL:
https://www.imf.org/external/pubs/ft/bop/2007/pdf/appx5.pdf
24 There were no data on students’ mobility available for Germany and Switzerland.
25 Taylor, J. Edward, 1986. Differential migration, networks, information and risk. In:
Stark, Oded (Ed.), Migration, Human Capital and Development. JAI Press, Greenwich, CT
2.4.2 Trade Integration
Figure 2-5: Trade Integration by country in 2015, on an EU-wide (top) and Macro-regional (middle) comparison. The bottom figure shows the Upper/Lower Regions, including their components
Text Box 2-5: Explanation of the indicator: 'Trade Integration'
To measure Trade Integration, the analysis benchmarks a country’s share of exports to the macro-region out of its total exports. The result of the benchmark thus indicates the degree to which a country is able to sell its goods in the macro-region, and what importance the single market concept has on a macro-regional scale.
Next to the high economic importance of the macro-region associated with a high indicator score, the ‘functional’ definition of a macro-region through a common geographic feature is manifested through economic evidence.
The data was obtained from the COMTRADE Database of the United Nations, which provides comprehensive trade data.26
The Alpine macro-region shows the highest trade integration compared to all macro-regions. Austria and Slovenia register the highest share of the macro- region with total exports amounting to more than 45% and a score of 584 and 572 respectively. In parts, the high scores are explained by the fact that both countries are as a whole part of this macro-region, unlike the other Member States.
A medium degree of integration can be observed within a second group of countries (Germany, France, Switzerland, and Italy). This exhibit shares of macro-region’s exports in total exports ranging from 23% in France (score of 306) to about 30% in Italy (348). There is a strong trade activity among the countries of the macro-region, as all have a large share in each other exports’.
Since this analysis uses country-level data, the actual trade integration of the relevant regions may even be higher. Compared to 2011 the share of macro- region in the exports of the countries of the Alpine diminished. Although integration decreased in all countries it remained nevertheless strong.
26 UN COMTRADE, URL: https://comtrade.un.org/
2.4.3 Capital Integration
Figure 2-6: Capital Integration by country, on an EU-wide (top) and Macro-regional (middle) comparison. The bottom figure shows the Upper/Lower Regions, including their components
Text Box 2-6: Explanation of the indicator: ‘Capital Integration’ 2728
The Alpine macro-region shows a high level of capital integration with a share per partner amounting to 6.20, corresponding to 441 on the benchmark. The average Alpine region scores therewith nearly as high as the EU’s most
integrated Member State. This level is significantly higher than the EU-average (3.09). Slovenia accounts for the largest share of FDI stocks from the other partners in the macro-region (above 75% of total FDI stock in the country, and a benchmark score of 1,110), followed by Austria with a share of about 52%.
Switzerland and France have the lowest share of FDI from the other partners in the macro-region, about 20%, followed by Germany with 23%. Italy is placed in the middle, with a share of 31%29. No data were available for Liechtenstein.
27 Folfas, P. (2011), FDI between EU Member States: Gravity models and Taxes, http://www.etsg.org/ETSG2011/Papers/Folfas.pdf
28 Grozea-Helmenstein, D., G. Grohall, C. Helmenstein (2017): Convergence and Structural Change in Romanian Regions, in Larisa Schippel, Julia Richter, Daniel Barbu (2017): Rumäniens "Rückkehr" nach Europa. Versuch einer Bilanz. Wien: new academic press.
29 Since the benchmarking uses countrywide data, the benchmarking is in the cases of France, Italy and Germany possibly understated, given that also further distant regions are included, rather than only the actual regions of the macro-region.
The Capital Integration among the countries of this macro-region is measured through foreign direct investment (FDI). The ability of a country to attract FDI indicates the economic attractiveness of a region (Grozea-Helmenstein et al, 2017).
When using this concept, one has to differentiate between outward FDI (domestic companies investing in a foreign country) and inward FDI (foreign companies investing in the domestic country) as well as between flows (the annual stream of investments) and stocks (the aggregated volume of all past investments minus depreciation and repatriation) (Grozea-Helmenstein et al, 2017). For the underlying analysis inward FDI stocks of 2012 were therefore used, as these are in fact a moving, weighted average of flows that depreciate over time. The data have been provided by Eurostat.
Among various hypotheses aiming to explain the pattern of foreign direct investment, according to the classical theory of comparative advantage relative factor
endowments and initial conditions are important factors in attracting FDI to some locations rather than others (Bhagwati, 1987)1. This is in line with the FDI pattern which can be observed in the macro-regions, with some countries being more attractive to foreign investors compared to others.
The Capital Integration is measured on a country level. When considering the integration of countries that are only partially in the macro-region, the inward FDI stock (and thus benchmarking) of only the applicable regions may be higher if one assumes that inward FDIs are higher in closer geographical proximity (Folfas, 2011).
2.4.4 Energy Integration
Figure 2-7: Energy Integration by country. The top figure shows an EU-wide comparison, while the middle map illustrates the indicator on the macro-regional scale. The bottom figure shows the benchmarked indicator values for each country.
Text Box 2-7: Indicator description: ‘Energy integration’
Another area reflecting the degree of macro-regional integration is energy trade.
The indicator selected to represent energy trade is the share of energy exports that goes to the other countries in the region (as proportion of total energy exports). This reflects the preferred partners for energy trade. The higher proportion exported to nearby countries or regions can indicate closer ties between the areas. This indicator does not directly reflect energy independence of the region, but is rather intended to show the directions chosen for outgoing trade.
The energy integration indicator is defined as the energy export share that stays within the macro-region. Country-level data from Eurostat for the latest available year (2015) is used (Data table Exports - all products - annual data [nrg_131a]). Energy exports considered include all types of energy products: solid fuels, oil, gas, electricity and renewables.
The indicator for a specific country is constructed as follows:
1. Ratio between the macro-regional exports of the country and total energy exports is calculated.
Total exports = Energy export in tonnes of oil equivalent (toe) from the country to all trading partners
Macro-regional exports = energy products export in toe from the country to trading partners within the macro-region.
2. This ratio is divided by the number of partners in the macro-region, to obtain an average share of exports per partner in the macro-region.
3. Benchmark values are set-up in the same way as the integration indicators for macro-regional level, for EU-level energy trade integration, defined as the (per partner) share of exports to other EU countries as compared to all exports to the world.
This allows the degree of integration within each macro-region to be benchmarked against the degree of integration in the EU as a whole.
NOTE: Since the indicator is defined at the country level, it is not known what exact proportion of trade occurs within the macro-region, hence this indicator is a proxy.
Figure 2-8: Share of energy products exported to the macro-region by each country, 2015
The Alpine macro-region shows a relatively low level of energy integration based on the energy export indicator. Approximately 6% of energy products (7,7 out of 133,5 Million Tonnes oil equivalent) are exported to other countries in the macro-region. Slovenia exports the largest share of its energy products to other countries within the macro-region, but it is the smallest exporter in the region The bilateral energy exports from Germany and Italy to the other countries inside the macro-region are very low with share values below 5%. At the same time, they are two of the largest exporters of energy products in the macro- region, and they have a larger number of export partners, in other macro- regions, elsewhere in Europe and in other parts of the world.
The benchmarked indicator shows that Slovenia performs higher than the EU- level top-performer, while Austria is also close to the top benchmark at 147. The rest of the countries are either above, or just below the median, showing overall high levels of integration compared to the EU-level.
22% 15%
10% 6% 3% 2%
0%
10%
20%
30%
40%
50%
60%
70%
80%
90%
100%
2.4.5 Accessibility Potential
Figure 2-9: Accessibility Potential by NUTS-2 in 2014, on an EU-wide (top) and Macro- regional (middle) comparison. The bottom figure shows the Upper/Lower Regions, including their components
Text Box 2-8: Explanation of the indicator: 'Accessibility Potential’
The concept of accessibility refers to the ease of getting around from place to place (Saleem and Hull, 2012)30. Hull (2011) identifies two fields of accessibility: the first refers to the ability to travel and is based on the classical location theory. This shows the direct correlation between changes in the transport system (e.g. transport costs) and journey length (Banister, 2002; Ney, 2001; Geurs and van Wee, 2006). The second focuses mainly on the “ease of reaching” a number of daily activities at different destinations. The first conceptualisation of accessibility has been more intensively studied by the academic literature. This conceptualisation of accessibility forms also the basis of the indicators which are investigated below.
These assess the accessibility potential measured as an index31 related to the ESPON average for various transport modes such as road, rail, air, and multimodal transport.
Multimodal transport refers to the transportation of goods under a single contract, but carried out with at least two different means of transport (e.g. rail, sea and road), where the carrier is liable (in a legal sense) for the entire carriage. In order to achieve a feasible number of regions, the NUTS-3 regions were aggregated to a NUTS-2 level, by averaging the values of the aggregated regions.
In the macro-region, the best accessibility values for road and rail transport modes are in the regions of Germany, Switzerland, and France.
The highest accessibility by air and by multimodal transport can be found in Germany and the lowest in Liechtenstein and Slovenia, which is due to the small size and the topography of those countries. The regions in Austria, France, Italy, and Switzerland show relatively high accessibility index values for the air and multimodal transport.
Inside the countries, accessibility differs quite strongly from one region to another in all countries for all transport modes. The lowest disparities among the regions can be observed in Slovenia, while the highest in France and in
Germany. The size of the country and the mountainous relief plays a role in this respect. Due to the implementation of successful investments co-financed through EU Cohesion Funds accessibility by road and rail improved significantly in 2014 compared to 2011 in Slovenia. In the most NUTS-3 regions in all other countries of the macro-region it decreased, however. This is due to modest investments, in the aftermath of the economic crisis, as accessibility depends on infrastructure investments, which need besides substantial financing a long time for planning and implementation. At the same time, the accessibility by air and by multimodal transport declined in Germany, Austria, Switzerland and
Liechtenstein and increased in France, Slovenia and Italy.
30 Saleem Karou, Angela Hull (2012): Accessibility Measures and Instruments, in Angela Hull, Cecília Silva and Luca Bertolini (Eds.) Accessibility Instruments for Planning Practice.
COST Office, pp. 1-19. URL: http://www.accessibilityplanning.eu/wp- content/uploads/2013/01/Accessibility-Measures-and-Instruments-R.pdf
31 For each NUTS-3 region the population in all destination regions is weighted by the travel time to go there. The weighted population is summed up to the indicator value for the accessibility potential of the origin region.
2.4.6 Transnational Cooperation
Figure 2-10: Territorial Cooperation by NUTS-2 in 2011, on an EU-wide (top) and Macro- regional (middle) comparison. The bottom figure shows the Upper/Lower Regions, including their components