STUDY ON
MACROREGIONAL
STRATEGIES AND THEIR LINKS WITH COHESION POLICY
DATA AND ANALYTICAL REPORT FOR THE EUSBSR
NOVEMBER 2017
EUROPEAN COMMISSION DIRECTORATE-GENERAL REGIONAL AND URBAN POLICY
STUDY ON
MACROREGIONAL
STRATEGIES AND THEIR LINKS WITH COHESION POLICY
DATA AND ANALYTICAL REPORT FOR THE EUSBSR
ADDRESS COWI A/S Parallelvej 2
2800 Kongens Lyngby Denmark
TEL +45 56 40 00 00 FAX +45 56 40 99 99 WWW cowi.com
CONTENTS
1 Introduction to the Report 9
1.1 The EUSBSR – Background 10
2 State of the Macro-Regions (Task 1) 17
2.1 Introduction to Task 1 17
2.2 Methodological Framework for Task 1 17
2.2.1 Macro-regions 17
2.2.2 Indicator Analysis 19
2.2.3 Composite Benchmarks 20
2.3 Macroeconomic Overview 24
2.3.1 Economic Performance 26
2.3.2 Employment 29
2.3.3 Social Progress Index 31
2.4 Macro-regional Integration 32
2.4.1 Labour Integration 35
2.4.2 Trade Integration 38
2.4.3 Capital Integration 40
2.4.4 Energy Integration 42
2.4.5 Accessibility Potential 45
2.4.6 Transnational Cooperation 48
2.5 Competitiveness 50
2.5.1 Overall Competitiveness 51
2.5.2 Business 62
2.5.3 Transport 66
2.5.4 Tourism 70
2.5.5 Fisheries 74
2.5.6 Blue Growth 76
2.5.7 Energy 78
2.5.8 Climate Change: Adaptation 85
2.5.9 Climate Change: Mitigation 88
2.5.10 Environment: Air Quality 92
2.5.11 Environment: Air Pollution 94
2.5.12 Environment: Waterbodies 97
2.5.13 Biodiversity: Natura 2000 100
2.5.14 Diversity of Land Cover (Shannon Index) 102 2.5.15 Biodiversity: Coverage of marine protected
areas in Europe’s seas 104
2.5.16 Eco-Innovation Scoreboard 105
2.5.17 Resource Efficiency (composite of Eco
Innovation Scoreboard) 107
2.5.18 Bathing Water Quality 109
2.5.19 Agricultural Impact 111
2.6 Political, Institutional, and Governance factors 115
2.6.1 Governance 117
2.6.2 Public Institutions 119
2.6.3 Voice and Accountability 121
2.6.4 Human Trafficking 123
2.6.5 Number of Drug Seizures 125
2.7 Meta-analysis 126
2.7.1 Macroeconomic Indicators 126
2.7.2 Macro-regional Integration 128
2.7.3 Competitiveness 130
2.7.4 Political, Institutional, Governance indicators 131
3 Review of the Macro-regional Strategies (Task
2) 134
3.1 Introduction to Task 2 134
3.2 Methodology for Task 2 135
3.3 Review of the EUSBSR (Task 2a) – Summary 141 3.4 Achievements of the EUSBSR (Task 2b) 144 3.4.1 Achievements – contents-wise 145
3.4.2 Achievements – process-wise 153
3.5 Comparison of objectives of the EUSBSR with
achievements (Task 2c) 163
3.6 EUSBSR and ESIF (Task 2d) 179
3.7 EUSBSR Case fact sheets 188
APPENDICES
Appendix A TASK 2a: Review of the EUSBSR A.1 Methodological Framework for Task 2a A.2 Review of the EUSBSR
Appendix B List of literature
List of Abbreviations
Abbreviation Stands for
AG Action Group
AP Action Plan
BSAP Baltic Sea Action Plan BSLF Baltic Sea Labour Forum
BSN Baltic Science Network
BSR Baltic Sea Region
BSR Stars PA Innovation (EUSBSR) flagship
BUP Baltic University Programme
CBC Cross Border Cooperation
CBSS The Council of the Baltic Sea States
CEF Connecting Europe Facility
CF Cohesion Fund
CISE Common Information Sharing Environment
DG Directorate-General
EAFRD European Agricultural Fund for Rural Development
EC European Commission
ECTS European Credit Transfer System
ECVET European Credit system for Vocational Education and Training
EFTA European Free Trade Association EMFF European Maritime and Fisheries Fund
ERASMUS+ EU Programme for Education, Training and Sport ERDF European Regional Development Fund
ESF European Social Fund
ESIF / ESI funds European Structural and Investment Funds ETC European Territorial Cooperation
EU European Union
EUSAIR European Union Strategy for the Adriatic-Ionian Region
EUSALP European Union Strategy for the Alpine Region EUSBSR European Union Strategy for the Baltic Sea Region EUSDR European Union Strategy for the Danube Region EWTCA East West Transport Corridor Association
HAC Horizontal Action Coordinator (EUSBSR)
HELCOM Baltic Marine Environment Protection Commission
HLG High Level Group
IALA Navigation in the IMO, International Association of
Marine Aids to Navigation and Lighthouse Authorities
ICPDR International Commission for the Protection of the Danube River
IHO International Hydrographic Organisation IMO International Maritime Organisation
MA Managing Authority
MRS Macro-regional strategy/-ies
MS European Union Member States
MSFD Marine Strategy Framework Directive
NCs National Coordinators
NCM Nordic Council of Ministers
NDEP Northern Dimension Environmental Partnership NEFCO Nordic Environment Finance Corporation
NGO Non-governmental organisation
NUTS Nomenclature of territorial units for statistics
OP Operational Programme
OVI Objectively Verifiable Indicators
PA Policy Area / Priority Area / Pillar / Action area PA Education Policy Area Education (EUSBSR)
PA Innovation Policy Area Innovation (EUSBSR) PA Nutri Policy Area Nutrition (EUSBSR) PA Safe Policy Area Safety (EUSBSR) PA Transport Policy Area Transport (EUSBSR) PAC Policy / Priority Area Coordinator
RDP Rural Development Programme
S2W School to Work (PA Education (EUSBSR) flagship)
SG Steering Group
SME Small and medium-sized enterprises
SWD Commission Staff Working Document
TEN-T The Trans-European Transport Networks
TO Thematic objective
TNK Transnational Component
TSG Thematic Steering Group
VET Vocational Education and Training
WFD Water Framework Directive
1 Introduction to the Report
The 'Study on macro-regional strategies and their links with cohesion policy' consists of four task, which are summarised and concluded upon in the Final Report. The first two tasks (Task 1 and Task 2) have been reported on individually, and the present report contains the data and analysis for these two tasks for the European Union Strategy for the Baltic Sea Region (EUSBSR).
This report begins with a brief section presenting the EUSBSR, followed by
› the first major part (section 2) of the report, which contains the data and analytical report for Task 1, i.e. a description and an analysis of the overall context of the Baltic Sea macroregion;
› thereafter, the second major part (section 3) contains the data and analytical report for Task 2, analysing the overall achievements of the EUSBSR and an evaluation of its contribution to strengthening the territorial cohesion objective of the EU. Task 2 is divided into the following four sub- tasks:
› Task 2a: Review of the EUSBSR
› Task 2b: Achievements of the EUSBSR
› Task 2c: Comparison of objectives of the EUSBSR with achievements
› Task 2d: EUSBSR and ESIF Data and analysis
report for Task 1 and Task 2
Structure of the
report
1.1 The EUSBSR – Background
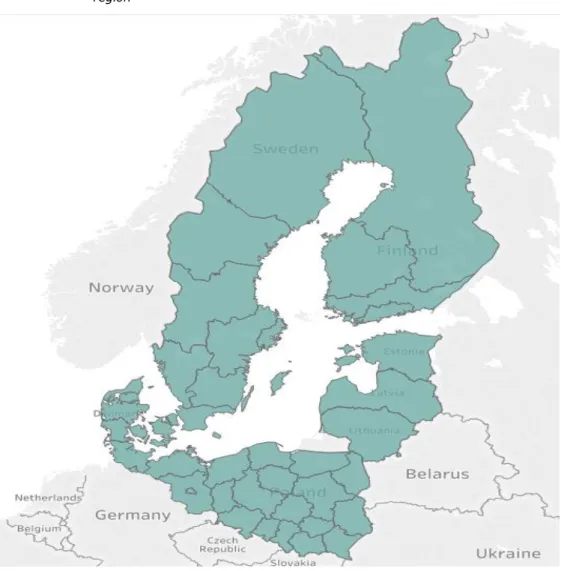
The European Union Strategy for the Baltic Sea Region (EUSBSR) is the first of the macro-regional strategies. It was developed by the European Commission in consultation with the Baltic Sea Region member states and stakeholders.
The cooperation in the EUSBSR focused on environmental challenges connected to the Baltic Sea, as well as two more objectives under the headings of "Connect the Region" and "Increase Prosperity". The EUSBSR aims at enhancing the regional integration of the involved EU Member States in the Baltic Sea Region.
The EUSBSR also extends cooperation to neighbouring countries, specifically Belarus, Iceland, Norway, and Russia. It aims to strengthen the integration of the region through collaboration on its currently 13 policy areas and 4 horizontal actions
1The EUSBSR includes eight countries, all of them EU Member States, amongst which a relatively high level of cooperation existed prior to the strategy.
Table 1-1 Countries and key features of the EUSBSR
Countries and regions Key features
Estonia
Denmark
Finland
Germany (Berlin; Brandenburg;
Hamburg; Mecklenburg-Vorpommern;
Schleswig-Holstein)
Latvia
Lithuania
Poland
Sweden
Representing 80 million inhabitants or nearly 16% of the EU population
EU Member States
Cooperation with non-EU members (Norway, Russia, Belarus, Iceland)
1
https://www.balticsea-region-strategy.eu/ and COMMISSION STAFF WORKING
DOCUMENT. European Union Strategy for the Baltic Sea Region. ACTION PLAN
{COM(2009) 248}, SWD(2017) 118 final.
Figure 1-1 The EUSBSR by the nomenclature of territorial units for statistics (NUTS2) region
The EUSBSR strategy includes a number of objectives and sub-objectives which
are implemented through 13 policy areas (hereafter PAs).
Table 1-2 EUSBSR: objective, policy areas and horizontal actions
Objectives Policy Areas Horizontal
actions Save the sea
1.Clear water in the sea 2.Rich and healthy wildlife 3.Clean and safe shipping 4.Better cooperation
Nutri Hazards Bio-economy Ship Safe Secure
Spatial planning Neighbours Capacity Climate Connect the region
5.Good transport conditions 6.Reliable energy markets 7.Connecting people in the region
8.Better cooperation in fighting cross-border crime
Tourism Culture Innovation Health Education Increase prosperity
9.Baltic Sea region as a frontrunner for deepening and fulfilling the single market 10.EUSBSR contributing to the implementation of Europe 2020 Strategy 11.Improved global competitiveness of the Baltic Sea region
12.Climate change adaptation, risk prevention and management
Transport Energy
The strategy and first action plan was endorsed by the Council in October 2009.
The action plan has been amended several time since then and the current action plan is from March 2017. The revisions of the actions plans has also resulted in a reduction of policy areas. The current action plan includes 13 policy areas
2.
Governance of the EUSBSR relies on a number of actors and institutions as listed in Table 2-1. The PA steering committees and the Policy Area Coordinator (PAC) and Horizontal Actions Coordinator (HAC) together with Flagship leaders are key implementers of the strategy.
2
COMMISSION STAFF WORKING DOCUMENT. European Union Strategy for the Baltic Sea Region. ACTION PLAN {COM(2009) 248}. Brussels, 20.3.2017. SWD(2017) 118 final.
Strategy and action plan
Governance
Table 1-3 Roles and responsibilities in the EUSBSR
3Actors/roles Description
National Coordinators overall coordination of EUSBSR and implementation in country Coordinators of policy areas/horizontal actions
(PAC and HAC)
key forces to drive implementation of relevant thematic areas forward
Steering Groups National sector experts (check)
Flagship Leaders; responsible for implementation of flagships
Managing Authorities bodies in charge of implementation of programmes/financial instruments
European Commission, High level Group strategic coordination
3
Roles and responsibilities of the implementing stakeholders of the EUSBSR and a flagship
project concept. Working document. January 2013. EUSBSR.
STATE OF THE
MACRO-REGIONS
EUSBSR (TASK 1)
2 State of the Macro-Regions (Task 1)
2.1 Introduction to Task 1
This report presents the results of Task 1 of the 'Study on Macro-Regional Strategies and their links with cohesion policy' for Baltic Sea Macro-regional Strategy. Three other reports of the same structure cover the remaining three macro-regions: Adriatic and Ionian Sea, the Alpine and the Danube Strategy.
This report provides an 'indicator-based description and analysis of the overall context of [the] macro-regions'
4. This report aims further to provide a context that is detached from the Macro-regional Strategy concept and does not provide an evaluation of the Macro-regional strategies objectives; which is addressed in the Task 2 report. The description and analysis is structured along four specific headlines: macro-economic overview; macro-regional integration;
competitiveness; and the political, institutional and governance context. There is a chapter on each of these dimensions, followed by a synthesised meta-analysis.
Prior to these indicator-based chapters, the report provides a brief methodological overview.
For each indicator that is described, the report first provides a graphical
illustration of the indicator values. This is followed by a description and analysis of the indicator values in question.
2.2 Methodological Framework for Task 1
2.2.1 Macro-regions
The concept of Macro-regions refers to a grouping of regions that principally share a common functional context, such mountains, sea-basins, or river-basins,
4
The study Specifications The Macro-Regional
Framework
and 'in which the priorities and objectives set out in the corresponding strategy can be properly addressed'
5. While this grouping of territories into macro-regions thus follows a functional logic, it remains an artificial construct in terms of a governance or territorial unit. Therefore, contextual information for a macro- region as a whole is not readily available. This is reflected in the fact that no selection of relevant information is available on an aggregated level.
The family of reports under Task 1 aims at filling this gap. They seek to provide a set of relevant information that closes this gap and draws valid inferences on the overall context of the macro-region in question.
More specifically, the context of the macro-regions is described through a set of indicators on four dimensions (macroeconomic overview, integration,
competitiveness and the institutional / governance context). The four types of indicators provide a research framework upon which the Task builds, and essentially reflect the EU’s principal policy of Economic-, Social-, and Territorial Cohesion as follows:
› Macroeconomic indicators reflect the (socio) economic context of the individual economies as well as the macro-region as a whole. Further, they also serve as overview indicators on the overall social- and economic cohesion.
› Macro-regional economic integration indicators describe the intensity of cooperation, integration and (economic, cultural) exchange among the countries of a macro-region, and essentially reflect the state of territorial cohesion.
› Competitiveness indicators provide a more detailed insight into the (broadly defined) competitiveness of countries and macro-regions on various aspects. These indicators provide inference on factors that affect the three Cohesion objectives.
› Political, institutional and governance indicators mirror the political state of a macro-region in terms of governments’ accountability or effectiveness of legislation. These indicators mirror the likely capacity to effectively pursue interventions on the economic, social as well as territorial cohesion.
The reports provide a picture of the status of the macro-region in question, of the developments inside the macro-regions and when possible (i.e. data allows) a comparison of the current results with the results of the past. The family of Task 1 reports thus explores and analyses the overall context of the four
existing Macro-Regional Strategies (MRS), namely the EU Strategy for the Baltic Sea Region (EUSBSR), the EU Strategy for the Danube Region (EUSDR), the EU Strategy for the Alpine Region (EUSALP) and the EU Strategy for the Adriatic and Ionian Region (EUSAIR). The analysis is thus as such detached from the
5
Study specifications Indicators to
provide an overall
context of the
Macro-regions
contents of each of the macro-regional strategies. Rather, it focuses on the comparable assessment of the socioeconomic and macro-regional integration status within the macro-regions, as well as on the comparable investigation of their performance regarding competition and efficient institutions and
governance.
2.2.2 Indicator Analysis
A first step of Task 1 focused on the construction of a set of indicators which are relevant to macro-regions on a macro-regional level. For this, indicators were first identified by the consultant, and the final selection was done in close cooperation with DG REGIO. Consultations with DG REGIO and members of the Steering Committee served to ensure an eventual comprehensive and relevant picture of the macro-regions.
For the identification of indicators statistical units had to be considered. Given that the macro-regions in some cases consist of regions and not entire
countries, the geographical level of the analysis is principally conducted at level 2 of the Nomenclature of territorial units for statistics (NUTS-2), as defined by the EU. However, in some cases data are not available at NUTS-2 level of aggregation but at NUTS-1 level or country level only. In these cases the missing information for the NUTS-2 level has been substituted by data from the first available aggregation level above it, i.e. if statistical information on a measure was available at NUTS-1 level, the same performance measure was assumed to apply at the NUTS-2 level. For some variables only country-specific information was available. This applies for example to the macro-regional integration indicators.
The statistical units for regions outside the EU were chosen according to the countries’ own aggregation at NUTS-2 level (equivalent to SR3
6) as defined by the EU. Only very few data were available at a level comparable with the NUTS- 2 level of the EU. Furthermore, most analysed countries outside the EU are quite small, and most data for the regions outside the EU have therefore been chosen at country level of aggregation.
The main sources of data used in this report are the Eurostat-Database supplemented with data from the World Bank Database, OECD, UNCTAD, COMTRADE, EEAA, ESPON project. Most NUTS-2 data are published with a time lag of one or two years. In order to create a common basis across the macro- regions and the themes, the description and analysis are generally based on data available for the year 2015 or the latest available data for all considered regions. When possible, a comparison is provided between the latest available year data and the data for 2008 for the Baltic Sea and Danube macro-regions.
6
The NUTS classification is defined only for the Member States of the EU. Eurostat, in agreement with the countries concerned, also defines a coding of statistical regions (SR) for countries that do not belong to the EU but are either candidate countries, potential candidate countries or countries belonging to the European Free Trade Association (EFTA).
Eurostat and Serbia have not yet agreed on statistical regions for the country.
Choosing macro- regionally relevant indicators
Emphasis on
regional indicators
where possible
The year 2008 also is the year just before the creation of these two macro- regional strategies. For the two newer macro-regions, the Alpine and Adriatic Ionian macro-regions it is the year 2011 that is compared to 2015. The year 2011 is the year just before the creation of the Alpine and Adriatic Ionian macro- regions and it offers a timespan long enough in order for changes to become visible.
Each of the quantitative and qualitative indicators identified as best describing the socio- economic context, integration, as well as the competitiveness, institutional and governance situation of the four macro-regions was subject of an assessment against the RACER framework. RACER stands for “Relevant, Acceptable, Credible, Easy, Robust” and enables a judgement on each indicator’s properties and qualities. Each RACER criterion has been assessed on a three- level scoring scale (green: criterion completely fulfilled; orange: criterion partly fulfilled; red: criterion not fulfilled). Based on the strengths and weaknesses of each of the quantitative and qualitative indicators across all the RACER criteria, a list of indicators was selected out of a pool of indicators considered.
The indicators which complied with all RACER criteria (green overall) have been definitely included into the set of selected indicators; those, which did not comply with all RACER criteria (a mix of green, red and yellow) and were not of high importance for the considered macro-region have been left outside.
2.2.3 Composite Benchmarks
As it is not possible to monitor all dimensions of a macro-region with one single indicator, a larger number of indicators has been selected. An additional challenge is that a macro-region’s picture comprises the four dimensions (macro-economic, macro-regional integration, competitiveness and political- institutional- governance) but each dimension cannot be captured by one single quantitative indicator.
In order to cope with this challenge, all indicators with a common theme have been aggregated into composite indices. Composite indices bundle separate (component) indicators into one index which allows the values of the whole bundle expressed as only one measure
7; examples of such indices are the Human Development Index, Environmental Sustainability Index, and stock indices like the NASDAQ Index. In the course of gathering indicator data, the data have been grouped into sets of related indicators according to appropriately identified themes. Themes have been chosen so that the indicators together represent an “essential feature” of and within a macro-region. The individual indicators have been aggregated without any weights and each composite index hence represents the unweighted average of all indicators.
Different indicators generally apply different scales, such as percentages, currencies or categorical data (e.g. chemical status of waterbodies). The
aggregation of such different scales only makes sense for comparable variables.
7
See http://www.investopedia.com/terms/c/compositeindex.asp Composite Indices
Composite
Benchmarks
Each indicator therefore needs to be normalised (to a common scale) before these can be combined into a composite index. For this aggregation, the proprietary ‘emb’ model (equilibrated medial benchmarking) has been applied
8. The benchmarking analysis focuses on the four macro-regions and the four dimensions inside each macro-region compares countries and/or NUTS-2 regions inside the individual macro-region based on a common reference framework of EU countries. The reference framework for each component indicator or composite index is delineated by the “top performer” of EU28 countries (benchmarked at 150), the “lowest performer” (50) and the median performer(s) at 100
9. A high benchmarking score always reflects a more
“desirable” situation. Taking unemployment rates as an example, higher scores reflect lower unemployment rates. In this way, the benchmarking results can always be read as showing whether – and to what extent – they are above or below the median in the EU at country level. This common framework enables observations to be made across different regions, even though the main focus remains within each macro-region.
The benchmark is always scaled on a country level against all EU28 Member States. The benchmarking score hence indicates a country’s or region’s relative position to all EU28 countries. This means in turn that one can observe values above 150 and below 50 in the cases summarised in the table below.
Table 2-1: Cases with benchmarking scores above 150 and below 50
Case Explanation
Regional analyses (NUTS-2 level)
A NUTS-2 region may out-/underperform its country. Such as Stockholm (SE), performing higher than Sweden as a whole.
Non-EU countries A non-EU country is not included in the benchmarking scale. Thus, a country like Ukraine may score above 150 or below 50, as they are not included in the scaling.
Macro-regional Integration analyses
Countries that are stronger/weaker integrated in a macro-region than the EU’s ‘top performing’/’bottom performing’ country is integrated in the EU28 (see paragraphs below).
For example, Germany’s trade integration with countries in the Danube region comprises only a small share of its trade with all EU28 countries and is at the same time lower than that of the EU’s
‘bottom performer’.
8
For the Proprietary Method of constructing indices from multiple indicators refer to: Fink, M. et al. (2011), Measuring the impact of flexicurity policies on the EU labour market, IHS Research Report, commissioned by DG EMPL (Employment, Social Affairs and Inclusion).
9
The median is the point in a dataset in which a split of that dataset results in two sets with an equal number of data points. See http://www.investopedia.com/
terms/m/median.asp for more details
The chapter on integration includes new integration indices. These IHS- proprietary indices cover respectively Labour Integration (three indices plus a composite of these 3 components), Capital Integration (Foreign Direct
Investment (FDI), Energy Integration, and Trade Integration. Each of these seven indices is constructed on a similar principle, which is outlined as follows.
When the amount or value of labour, capital etc. supplied by a country to another country (a ‘partner’), or, equivalently, received from a partner, increases, it can be said that the level of integration between the two has increased. Considering a particular group of countries, the focus is on the bilateral flows between them. For the task of estimating integration within macro-regions, i.e. between individual countries belonging to the macro-region in question, the first step is the development of a “Bilateral Flow Matrix”, as shown in the table below.
Table 2-2: Energy Integration Example (Baltic Sea), energy exports (kTOE)
Partner Denmark Germany Estonia Latvia Lithuania Poland Finland Sweden Denmark 0.0 1,917.4 0.0 0.0 0.0 0.0 505.6 3,503.5
Germany 3.5 0.0 0.0 0.0 0.0 916.5 0.0 0.0
Estonia 0.0 0.0 0.0 522.7 0.0 0.0 25.6 0.0
Latvia 0.0 0.0 0.4 0.0 293.9 0.0 0.0 0.0
Lithuania 0.0 0.0 79.7 14.4 0.0 51.4 0.0 0.0
Poland 0.0 251.7 0.0 0.0 5.6 0.0 0.0 1.7
Finland 0.0 0.2 432.8 0.0 0.0 0.0 0.0 0.1
Sweden 477.6 168.3 0.0 0.0 0.0 302.0 1,484.4 0.0
Immediately, certain strong relationships between certain country-pairs are visible. What such a table of absolute values does not make clear is the
‘importance’ of a bilateral relationship for a specific country. A second step therefore converts the data to a relative share of all its exports (or foreign investments, migration flows, remittances) (in worldwide).
Table 2-3: Energy Integration Example, Share of total exports to partner country (in %) Partner Denmark Germany Estonia Latvia Lithuania Poland Finland Sweden
Denmark 0.0 11.8 0.0 0.0 0.0 0.0 3.1 21.5
Germany 0.0 0.0 0.0 0.0 0.0 1.5 0.0 0.0
Estonia 0.0 0.0 0.0 24.8 0.0 0.0 1.2 0.0
Latvia 0.0 0.0 0.0 0.0 13.8 0.0 0.0 0.0
Lithuania 0.0 0.0 0.9 0.2 0.0 0.6 0.0 0.0
Poland 0.0 1.2 0.0 0.0 0.0 0.0 0.0 0.0
Finland 0.0 0.0 5.8 0.0 0.0 0.0 0.0 0.0
Sweden 2.6 0.9 0.0 0.0 0.0 1.6 8.1 0.0
The new integration index provides a common basis for measuring integration in each of the four macro-regions, just as the case for every other indicator
considered in this study. Given that the number of countries in the macro-
Integration Indices
regions vary, the total share of e.g. energy exports to the macro-region would grow with the number of member countries. Therefore, to provide a measure of integration that is not affected by the size of a macro-region, the chosen measure for each country’s degree of integration within its macro-region is its per partner share (ppShare); i.e. the average flow to a destination country.
Table 2-4: Energy Integration Example, resulting per partner share Partner ppShare
Denmark 5.21 Germany 0.22 Estonia 3.72 Latvia 1.98 Lithuania 0.23 Poland 0.18 Finland 0.83 Sweden 1.90
In the case of integration indices, the procedure to establish the benchmark is identical in formation as for the other indices, except that in this case the bilateral flow matrix is 28 x 28 for the EU28. Thus, the benchmark is defined by the average share that each Member State exports to the EU28 countries. This results in a per partner share of each Member State, but to the whole EU28, instead of a macro-region.
In other words, using the per partner share as a unit of measure enables the degree of integration within each macro-region to be benchmarked against the degree of integration in the EU as a whole. This provides a deep insight into the question of whether the common geographical basis (and more) for the macro- regions is actually, and to what extent, of particular relevance compared to the entire setting of all EU countries, which may in general cover a more or less contiguous area, but which course also comprise (even more) multiple regional contexts.
As mentioned in Table 3-52 above, there are many cases found to score well below 50 or well above 150. This is entirely consistent: The reason, expressed mathematically, is that the two-dimensional flow matrices gives rise to country index values in macro-regions that are not subsets of the EU index; for non- integration indices, in contrast the (EU) country indicator values form by definition a subset of the EU28.
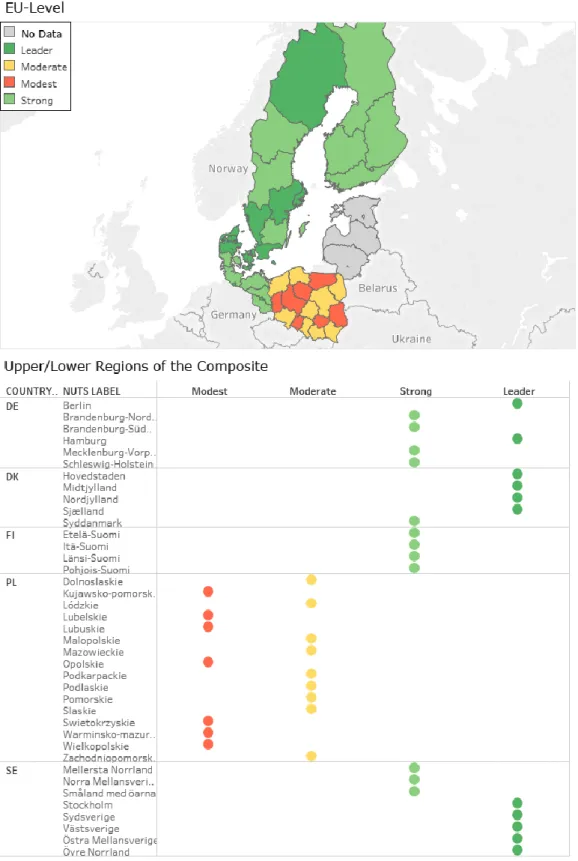
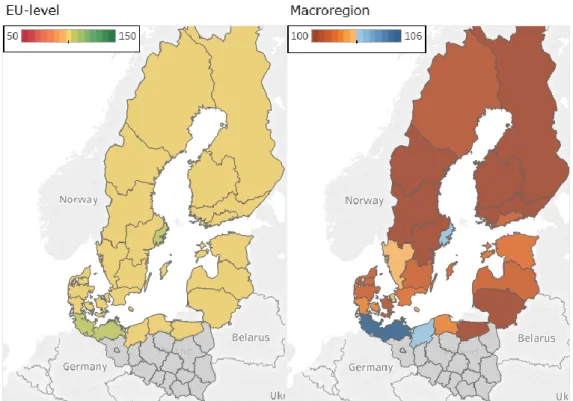
Each composite index is accompanied by a figure that consists of two maps and one bar chart. Both maps show the composite index values for each NUTS region in differing colour schemes. The first map provides a coloured illustration of the scores on a scale from 50-150 and reflects how a given region performs on the EU28-wide level (i.e. 100 reflects the EU28 median). Any regions scoring outside this defined range are displayed as 50 or 150.
The scale of the second map is in turn defined by the lowest and highest composite index scores found for the macro-region and seeks to highlight the Benchmarking
Integration Indices
Illustrative Maps
differences between the high and low performing regions of that macro-region more clearly. As a result, the range of this scale depends on the maximum and minimum scores for each individual composite index in a given macro-region.
The bar chart identifies the two regions with the highest and lowest composite index scores in each country, accompanied by the (benchmarked) scores of the index’s components. The colouring scale ranges from 50 to 150.
Synchronous to this report, a digital toolbox has been developed. The digital toolbox comprises a set of data files for each of the four macro-regions. Each file contains data sheets for each indicator used to assess the context of the macro- regions. As mentioned above, data has been organised separately for the appropriate NUTS regions and countries in each of the four macro-regions, and each indicator, or composite, corresponds to an excel sheet for each macro- region. The excel sheets have been grouped according to the four dimensions (macro-economic, macro-regional integration, competitiveness and political- institutional- governance). Furthermore, within each dimension, sheets have been grouped according to agreed aggregated compositions i.e. as composite indices).
An index page (usually on the first data sheet of each file) will enable users to directly find the data sheet for a named indicator (by clicking on an excel hyperlink).
A second set of excel files has been established for documenting the results of the benchmarking process. There is a file for each individual macro-region. This contains datasheets corresponding to indicators, grouped according to the above-mentioned four dimensions. Within these, they are further grouped according to the agreed aggregated composition of composite indices.
2.3 Macroeconomic Overview
In this chapter the overall macroeconomic state of the macro-region is assessed through analyses focused on three major themes: economic performance, employment, and social equality. The macroeconomic indicators are used to reflect the (socio) economic context of the individual economies as well as of the macro-region as a whole.
The table below provides an overview of the indices that are presented in this chapter:
Digital Toolbox
Table 2-5: Overview of macro-economic overview indicators
Composite Economic performance indicators
Employment indicators Social progress indicators
Components
GDP/capita Employment index Social progress index
10GDP growth Unemployment rate Labour productivity Youth unemployment
Long term unemployment Economic activity rate Employment rate
10
A composite index based on 53 indicators covering basic human needs, conditions for
well-being and opportunity to progress
2.3.1 Economic Performance
Figure 2-1: Economic Performance by NUTS-2 in 2015, on an EU-wide (left) and Macro-
regional (right) comparison. The bottom figure shows the Upper/Lower Regions, including
their components
Text Box 2-1: Explanation of indicators: ‘Economic Performance’
To assess the economic performance on NUTS-2 regions inside the macro-region three indicators: regional Gross Domestic Product (GDP) per capita (at purchasing power parity), Real GDP growth rate and Labour Productivity have been bundled into one composite indicator: Economic performance index.
Regional gross domestic product (GDP) is used for the measurement and comparison of the economic activity of regions. It is the most important indicator used in the EU's regional policy for the selection of regions eligible for support under the investment for growth and jobs goal of the EU. GDP is the standard measure of the value of the production activity (goods and services) of resident producer units.
11For this indicator regional data are available with a time lag of two years. Thus regional GDP data for the reference year 2015 have been released at the beginning of 2017. Real GDP is usually a proxy for economic prosperity. GDP per capita, however, does not reflect the equality of distribution of that prosperity, so it is not representative for many social issues.
The real percentage-growth rate of gross value added (i.e. Real GDP growth) allows the identification of the most and less dynamic regions in the EU and the non-EU regions inside the macro-region.
Labour Productivity has been calculated as Regional Gross Value Added (GVA) per employee. According to the OECD, Labour Productivity measures “how efficiently
production inputs, such as labour and capital, are being used in an economy to produce a given level of output.” Productivity is considered a major source of economic growth and competitiveness. It is used as a main indicator to assess a country’s performance and to perform international comparisons. Over time a country’s ability to raise its standard of living depends to a great extent on its ability to raise its output per worker. There are different measures of productivity.
An investigation of growth-generating economic activities on the regional level requires the availability of relevant regional indicators. Compared to data on the national level, the availability of regional data is much more limited. Moreover, regional data are published with sizable time lags which in the case of national accounts may amount to two years.
The analysis of the composite indicator Economic Performance in the macro- region shows a mixed picture regarding the economic development of its NUTS- 2 regions. The highest performers in 2008 and 2014 were the regions in
Sweden, Denmark and Germany (Berlin, Brandenburg, Hamburg). These regions show simultaneously a high GDP per capita and a high productivity. The highest GDP per capita and productivity is to be found in the NUTS-2 regions:
Hovedstaden, Brandenburg, Hamburg, Stockholm, and Östra Mellansverige.
These are urban centres with qualified workforce and high quality infrastructure.
In the middle range Estonia, Lithuania, as well as NUTS-2 regions in Germany
11
https://www.oenb.at/en/Statistics/Standardized-Tables/Economic-and-Industry-
Indicators/Economic-Indicators/nominal-gpd-growth-expenditure-side.html
(Mecklenburg-Vorpommern, Schleswig-Holstein) and in Finland and about a third of the Polish regions. The lowest values for the indicator Economic performance exhibit Latvia and about two thirds of the NUTS-2 regions in Poland. The lower performing regions have a low GDP per capita and low productivity. However, all low performing regions except for the Finnish ones, where progress was only modest, reduced their gap to the EU-median regarding the considered indicators significantly in 2014 compared to 2008.
An important role in this process played the investment co-financed by the EU Structural and Investments Funds (of which particularly the Cohesion Fund), as well as strong inward Foreign Direct Investment (FDI) flows. Estonia, Latvia, and Lithuania recovered after the recession in the years 2008 and 2009 and
recorded high growth rates during the period 2011 to 2013. However, the sanctions and countersanction imposed on and by Russia affected their growth performance since 2014. Poland was the only European country that did not record a recession during the crisis, due to successful policies supporting internal demand. After a moderate growth in 2012 and 2013 growth accelerated in Poland the following years, due to dynamic internal and external demand.
Following the recovery in 2010, the Finnish regions were again confronted with a prolonged recession in the period 2012-2014. Finland’s economy suffered from a lack of export demand from its main trade partners as the euro-area crisis prompted governments to cut budget spending, as well as austerity measures at home to keep debt low. The decline of Nokia (accounting for 4% of Finnish GDP, 21% of Finnish exports and 14% of corporate tax revenues by 2000
12), the biggest taxpayer and job provider in the Finnish economy combined with the decline of the paper industry contributed significantly to the contraction of Finnish economy.
12
http://www.wired.co.uk/article/finland-and-nokia
2.3.2 Employment
Figure 2-2: Employment by NUTS-2 in 2015, on an EU-wide (left) and Macro-regional (right)
comparison. The bottom figure shows the Upper/Lower Regions, including their components
Text Box 2-2: Explanation of the indicator: 'Employment'
Labour market statistics are crucial for many EU policies. There are significant labour market disparities within the EU territory as well as in candidate/neighbour countries. The first figure on the left shows the employment situation from the perspective of a
composite index based on the following indicators. i) Economic activity rate, which describes an economy’s ability to attract and develop a great share of human capital from its population; ii) Employment rate combined with Unemployment Rate, providing useful information about the ability to utilize available labour; iii) Youth unemployment rate, as an indicator showing the match between the existing skills within the young people and the employment opportunities offered by the regional economies; iv) and Long term unemployment rates, which indicate inefficient labour markets. More elaborate descriptions of the composite indicator can be found in the methodology.
Four out of five NUTS-2 regions in the Baltic Sea region exhibit a more positive state than the EU-median (35 out of 43 NUTS-2 regions perform above the EU- median). The highest performing NUTS-2 regions are in Sweden followed by those in Denmark. The lowest performers were eight NUTS-2 regions in Poland.
Compared to 2008, the regions in Denmark lost their leading position, which is taken over by the regions in Sweden (particularly Stockholm performing better than any EU country as a whole). This is because of the reduction in the activity and employment rates in Denmark since 2008. It should be noted though that the 2008 levels were very high in Denmark. Germany and Poland in turn improved their position considerably over the last seven years. Most NUTS-2 regions in Sweden, Germany and Poland thus increased their activity and employment rates significantly. The rise in the value of these indicators was in the case of the Polish and German regions quite substantial but starting also from relatively low levels.
High GDP growth rates in Poland since 2008, also due to the high absorption of EU cohesion funds, supported the catching up of the Polish economy to the EU- average. At the same time, high growth is reflected in many NUTS-2 regions in a rise of the activity and employment rates and - since 2014 - also in a gradual decrease of unemployment.
Except for the German regions, all regions experienced an increase in
unemployment rates when comparing 2008 and 2015. The German regions even managed to reduce unemployment, youth unemployment and long-term
unemployment rates. This can be attributed to successful labour market policies
implemented during the first five years of the first decade of the millennium, and
providing lasting results after a couple of years. Other factors contributing to the
good performance of German regions are the successful vocational training
schemes in Germany and the flexibility of German employees (60 % of employed
persons are commuters). Dual vocational training thus provided for a strong
decline of youth unemployment in Germany, while all other regions in the macro-
region experienced significant increases in this.
2.3.3 Social Progress Index
Figure 2-3: Social Progress by NUTS-2 in 2016, on an EU-wide (left) and Macro-regional
(right) comparison. The bottom figure shows the Upper/Lower Regions, including their
components.
Text Box 2-3: Explanation of the indicator: ‘Social Progress Index’
13There is a correlation between the level of economic development and social progress. Thus, the regions with the highest GDP per capita, such as NUTS-2 regions in Denmark, Finland and Sweden are also the highest performing
regions, with the highest scores for the European Union Regional Social Progress Index (above 145 on the benchmark). These regions register the highest
performance for the areas ‘Basic Human needs’ and ‘Opportunity’. The highest performing NUTS-2 regions in the macro-region are: Övre Norrland in Sweden, Midtjylland, Hovedstaden and Nordjylland in Denmark, and HelsinkiUusimaa in Finland. German NUTS-2 regions Berlin, Hamburg, Brandenburg, Mecklenburg Vorpommern with scores exceeding 120 points show also a performance above the EU28-median. The lowest performers are found in Poland, with scores below 90 points. These are Slaskie, Opolskie, Lódzkie, Swietokrzyskie, Lubuskie, Dolnoslaskie, Kujawsko, and Pomorskie. Deciding for this result is their low performance in the area ‘Foundation of Wellbeing’ (environmental quality) and
‘Opportunity’ (personal rights). Also Latvia and Lithuania exhibit low values for the Social Progress Index, as a result of a poor performance on ‘personal rights’
and ‘health and wellness’. A correlation between GDP per capita and performance on social progress can be noticed for these regions.
2.4 Macro-regional Integration
The emergence of the “new trade theory” (Krugman, 1979)
14in late 1970 with its emphasis on economies of scale put economic integration in the centre of economic debate. According to this theory, companies in small countries tend to
13
The index is published by the nonprofit organization Social Progress Imperative. A custom version for the EU regions has been developed in cooperation with the European Commission. See http://www.socialprogressimperative.org/custom-indexes/european- union/
14
Krugman, Paul R. (1979): Increasing returns, monopolistic competition, and international trade, URL: http://www.sciencedirect.com/science/article/pii/0022- 1996(79)90017-5.
The Social Progress Index measures the extent to which countries provide for the social and environmental needs of their citizens.
The Social Progress Index from 2016 bases on fifty-three indicators that cover the
fields of Basic Human Needs (Nutrition and Basic Medical Care, Water and Sanitation,
Shelter, Personal Safety), Foundations of Well-Being (Access to Basic Knowledge,
Access to Information and Communications, Health and Wellness, Environmental
Quality), and Opportunity to Progress (Personal Rights, Personal Freedom and
Choice, Tolerance and Inclusion, Access to Advanced Education). A ranking of the
values of Social Progress Index shows the relative performance of the countries
included. For the purpose of this Task, this index has been re-scaled this report’s
format.
exhibit relatively high average costs, while companies in large countries can profit from lower average costs due to size advantages.
15As a result, regional integration represents an important national policy
alternative for small economies in order to overcome the small size handicap. By joining a regional integration agreement, companies from a small domestic economy may enlarge and be better prepared to face competition from countries with larger domestic economies.
16However, while regional integration gives rise to new opportunities, new challenges may appear. These may take the form of strong restructuring at microeconomic level, with some companies disappearing and other companies growing bigger and becoming successful in international competition.
17In the restructuring process, relatively large and strong companies overtake their weaker competitors. An important role in this respect play mergers and acquisitions involving companies from different countries. Foreign direct investment (FDI) represents thus a channel in the integration process.
Companies with foreign participation, which are usually involved in vertical production networks, are also responsible for a large share of exports and imports. Integration may also lead to trade diversion and erosion of sovereignty.
18In the context of the EU’s long-term objectives, this chapter provides a context on the territorial cohesion of the macro-region, which is one of the three
cornerstones of Cohesion Policy next to economic and social cohesion
19, as well as the degree to which the Single Market
20is fulfilled within the macro-region.
For this analysis, various indicators have been chosen to provide a context of integration. The table below lists the chosen indicators. The macro-regional economic integration indicators chosen describe the intensity of cooperation, integration and (economic, cultural) exchange among the countries of the macro-region.
15
Gustavson, Patrick & Koko, Ari (2004): “Regional Integration, FDI and Regional Development. European Investment Bank”. In: Papers of EiB-Conferences, Vol. 9, No. 1, pp. 122, Luxembourg.
16
Gustavson, Patrick & Koko, Ari (2004): “Regional Integration, FDI and Regional Development. European Investment Bank”. In: Papers of EiB-Conferences, Vol. 9, No. 1, pp. 122, Luxembourg.
17
Gustavson, Patrick & Koko, Ari (2004): “Regional Integration, FDI and Regional Development. European Investment Bank”. In: Papers of EiB-Conferences, Vol. 9, No. 1, pp. 122, Luxembourg.
18
https://www.globalpolicy.org/nations-a-states/political-integration-and-national- sovereignty-3-22.html
19
Territorial Cohesion, http://ec.europa.eu/regional_policy/en/policy/what/territorial- cohesion/
20
The European Single Market, https://ec.europa.eu/growth/single-market_en
Table 2-6: Overview of Macro-regional economic Integration indicators
Composite Components
Labour Integration Intra macro-regional migration Mobile students from abroad Workers’ Remittance
Trade Integration Share of exports to macro-region out of total exports Capital Integration Inward FDI stocks
Energy Integration Exports of energy Accessibility Multimodal
Road Rail Air
Territorial Cooperation Number of organisations participating in INTERREG-IVB
2.4.1 Labour Integration
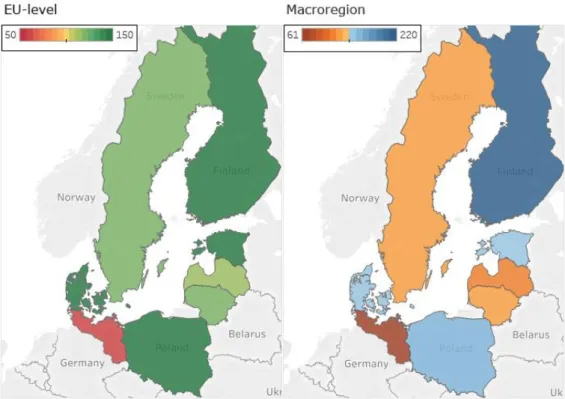
Figure 2-4: Labour Integration by country, on an EU-wide (left) and Macro-regional (right) comparison. The bottom figure shows the Upper/Lower Regions, including their
components
Text Box 2-4: Explanation of the indicator: ‘Labour Integration’
To get a picture on the status of labour integration in the macro-regions three indicators are selected: a) Bilateral estimates of migrant stocks in 2013, b) Bilateral Remittance Estimates for 2015 using Migrant Stocks, Host Country Incomes, and Origin Country Incomes (millions of US$) (October 2016 Version) both indicators provided by the World Bank and the c) Share of mobile students from abroad by education level, sex and country of origin, provided by Eurostat have been used to create a composite indicator.
Data on Migration and remittances are based on the Migration and Remittances Factbook 2016 published by the World Bank. It provides a comprehensive picture of emigration, immigration, and remittance flows for 214 countries and territories, and 15 country groups, drawing on authoritative, publicly available data. The data are collected from various sources, including national censuses, labour force surveys, and population registers.
According to the “Recommendations on Statistics of International Migration” by the United Nations Statistics Division (1998), “long-term migrants” are persons who move to a country other than that of their usual residence for a period of at least one year, so that the country of destination effectively becomes their new country of usual residence.
“Short-term migrants” are persons who move to a country other than that of their usual residence for a period of at least three months but less than one year, except for the cases where the movement to that country is for purposes of recreation, holiday, visits to friends and relatives, business, medical treatment, or religious pilgrimage (UN Statistics Division 1998).
A new notion of remittances introduced in the sixth edition of the IMF Balance of Payments and International Investment Position Manual (BPM6)
21is starting to be used by many countries (IMF 2010a). According to the new definition, personal remittances are the sum of two main components: “compensation of employees” and “personal transfers”.
Personal remittances also include a third item: “capital transfers between households,”
but data on this item are difficult to obtain and hence reported as missing for almost all countries.
Compensation of employees
22, unchanged from BPM5, represents “remuneration in return for the labour input to the production process contributed by an individual in an
employer-employee relationship with the enterprise.” The definition of “personal transfers,” however, is broader than the old “worker’s remittances” – it comprises “all current transfers in cash or in kind made or received by resident households to or from non-resident households.” Therefore, “personal transfers” include current transfers from migrants not only to family members but also to any recipient in their home country. If migrants live in a host country for one year or longer, they are considered residents, regardless of their immigration status. If the migrants have lived in the host country for
21
IMF (2013): Sixth Edition of the IMF's Balance of Payments and International Investment Position Manual (BPM6). URL:
https://www.imf.org/external/pubs/ft/bop/2007/pdf/appx5.pdf
22
See footnote above
less than one year, their entire income in the host country should be classified as compensation of employees.
23Share of mobile students from abroad enrolled by education level, sex and field of education refers to students from abroad enrolled in tertiary education (level 5-8) in percentage of all students.
In the Baltic Sea macro-region, labour integration is higher than the EU-median in all countries except Germany. The highest degree of labour integration within the countries in the macro-region can be observed for Finland and Poland followed by Denmark and Estonia. Sweden, Lithuania and Latvia fall below the average of the macro-region, but still above the EU28-median
24.
A close look at the migration, remittances and students’ mobility flows inside the macro-region, discloses some interesting integration patterns. Statistical
evidence shows that geographical proximity, historical and cultural ties and language advantages play an important role for labour integration. Family and friends network that migrants already have in the destination country is another contributing factor (Taylor, 1986)
25. Thus, there is a high degree of integration between Denmark and Sweden and to a lower extent between Denmark and Germany, and there is a high degree of labour integration between Estonia and Finland and to a lower extent between Estonia on one side and Germany and Sweden on the other side. Also, integration is highest between Finland and Sweden and to a lower extent between Finland and Germany, and labour integration is high between Germany on the one side and Poland, Sweden and Denmark on the other side. About 31% of the Polish migrants are located in Germany. A high degree of labour integration registers Poland also with Denmark and Sweden.
The data show that the flow of migrants takes place to a larger extent from East (Poland, Estonia, Latvia, and Lithuania) to West (Germany, Sweden, Finland, Denmark) or from the new EU Member States to the old EU Member States, the flow of remittances follows an opposite direction. For the Baltic countries, Estonia, Latvia, and Lithuania a high labour integration with the Russian Federation can be observed
24.
23
IMF (2013): Sixth Edition of the IMF's Balance of Payments and International Investment Position Manual (BPM6). URL:
https://www.imf.org/external/pubs/ft/bop/2007/pdf/appx5.pdf
24
There were no data on students’ mobility available for Germany
25
Taylor, J. Edward, 1986. Differential migration, networks, information and risk. In:
Stark, Oded (Ed.), Migration, Human Capital and Development. JAI Press, Greenwich, CT
2.4.2 Trade Integration
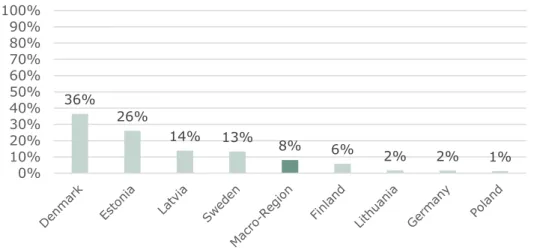
Figure 2-5: Trade Integration by country in 2015, on an EU-wide (left) and Macro-regional
(right) comparison. The bottom figure shows the Upper/Lower Regions, including their
components
Text Box 2-5: Explanation of the indicator: 'Trade Integration'
To measure Trade Integration, the analysis benchmarks a country’s share of exports to the macro-region out of its total exports. The result of the benchmark thus indicates the degree to which a country is able to sell its goods in the macro-region, and what importance the single market concept has on a macro-regional scale.
Next to the high economic importance of the macro-region associated with a high indicator score, the ‘functional’ definition of a macro-region through a common geographic feature is manifested through economic evidence.
The data was obtained from the COMTRADE Database of the United Nations, which provides comprehensive trade data.
26In the Baltic Sea macro-region, Latvia and Estonia present the highest trade integration within the countries in the macro-region. A share ranging between 50 and 60% of the exports of these countries are absorbed by the other countries in the macro-region. These shares increased in 2015 compared to 2008. Latvia’s main trade partners in the macro-region are Estonia and Lithuania, Estonia’s main trade partners are Finland, Sweden and Latvia. The lowest trade integration in the macro-region is seen in Germany. Only about 9%
of the German exports go to the other members of the macro-region. This share decreased slightly in 2015 compared to 2008. Due to its large size, German economy has a more diversified pool of trade partners compared to the small countries. Lithuania, Denmark, Poland and Finland show a medium degree of trade integration in the macro-region, with shares of trade within the macro- region in 2015 between 33% in Finland and 41% in Lithuania. Trade inside the macro-region increased for all these countries since 2008. Sweden’s trade share within the region accounts for 28%. However, this share did not change since 2008.
An interesting development showed by the data is the rise in the bilateral trade relation of the Baltic countries (Estonia, Latvia and Lithuania) following their EU accession in 2004. Foster et. al. (2011) attribute this development to the rising engagement of the foreign investors in the region and the increase in intra- company trade, while Hornok (2010) underlines the importance of the elimination of non-tariff barriers.
26
UN COMTRADE, URL: https://comtrade.un.org/
2.4.3 Capital Integration
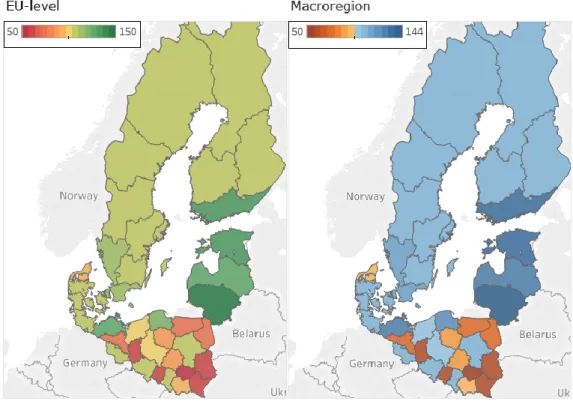
Figure 2-6: Capital Integration by country in 2012, on an EU-wide (left) and Macro-
regional (right) comparison. The bottom figure shows the Upper/Lower Regions, including
their components
Text Box 2-6: Explanation of indicators: ‘Capital Integration’
2728The Baltic macro-region shows a high degree of Capital Integration: The average share of FDI inward stocks from countries of this macro-region out of the EU is 5.37 (i.e. per partner share), which is well-above the EU-average share of 3.09.
Estonia, Finland and Lithuania account for the largest share of FDI stocks from the other partners in the macro-region and score 666-687 points on the benchmark (nearly 60% of total FDI stock in the country derives from this macro-region), followed by Latvia with a share of about 44% (score of 453). In the case of Finland, about 60% of the FDI stock originated in 2015 from Sweden, Denmark or Germany
29. Germany has by far the lowest share of FDI from the other partners in the macro-region with only 4%, resulting in an even negative benchmark of (-9). This very low score is in parts explained by the small share of Germany that is part of the macro-region. Poland, Denmark and Sweden are placed in the middle, with shares ranging from 22 to 30% and score above the EU-median.
27
Folfas, P. (2011): FDI between EU Member States: Gravity models and Taxes, http://www.etsg.org/ETSG2011/Papers/Folfas.pdf
28
Grozea-Helmenstein, D., G. Grohall, C. Helmenstein (2017): Convergence and Structural Change in Romanian Regions, in Larisa Schippel, Julia Richter, Daniel Barbu (2017): Rumäniens "Rückkehr" nach Europa. Versuch einer Bilanz. - Wien: new academic press.
29