PHYSIK DEPARTMENT
The CRESST Dark Matter Search -Background Considerations
and Data Analysis
Diplomarbeit von Manuela Jelen
angefertigt am
Max-Planck-Institut f¨ur Physik Werner-Heisenberg-Institut
M¨unchen 15.03.2006
TECHNISCHE UNIVERSIT ¨ AT
M ¨ UNCHEN
1. Gutachter: Dr. Franz Pr¨obst
2. Gutachter: Priv.-Doz. Dr. R. Kotthaus
Zusammenfassung
Das Experiment CRESST (Cryogenic
RareEvent Search withSuperconducting Thermometers) versucht, Dunkle Materie (DM) in Form von WIMPs (Weakly Interacting Massive Particles) durch ihre elastische Streuung an Kernen direktnachzuweisen. Die geringe R¨ uckstoßenergie der Atomkerne und die niedrige Streurate solcher Ereignisse machen eine Energieschwelle von nur wenigen keV sowie aktive und passive Untergrundunterdr¨ uckung erforderlich.
Zur passiven Untergrundsminimierung werden die CRESST-Detektoren in einem radioaktiovit¨atsarmen Aufbau betrieben, der im Gran Sasso-Untergrundlabor in Italien untergebracht ist.
Aktive Untergrundunterdr¨ uckung wird erreicht, indem neben dem Temperatur- signal das bei der Energiedeposition im Kristall gleichzeitig erzeugte Szintillations- licht gemessen wird. Die Lichtausbeute von Kernr¨ uckst¨oßen ist bei gleicher Energie wesentlich geringer als die von Elektronr¨ uckst¨oßen. So kann das ur- spr¨ ungliche Ereignis identifiziert und
α-,γ- und Elektronenuntergrund aktiv un-terdr¨ uckt werden.
Ein CRESST-Detektormodul besteht aus einem szintillierenden CaWO
4-Kristall (300 g) als Target f¨ ur WIMP-Wechselwirkungen und einer direkt daneben ange- brachten Siliziumscheibe als Detektor f¨ ur das Szintillationslicht, die beide als Tieftemperaturkalorimeter betrieben werden.
Im Rahmen dieser Arbeit werden zwei verschiedene Fitmethoden, der ”Trun- cated Fit” und der ”Nonlinear Fit”, zur Analyse der 2004 mit einem einzelnen CaWO
4-Kristall (”Daisy”) gewonnenen Daten verglichen. Besonders bei hohen Energien (einige MeV) wird sichtbar, dass der nichtlineare Fit eine sehr viel bessere Aufl¨osungen der dort betrachteten
α-Linien liefert. Aus der Identifika-tion der Linien durch den Vergleich mit nat¨ urlichen Zerfallsreihen ergeben sich Informationen ¨ uber die im Kristall vorhandenen Verunreinigungen.
Eine auff¨allige Kippung der hochenergetischen
α-Linien in einer zweidimensiona-len Darstellung (Licht- ¨ uber Phononenausbeute) wird quantitativ ausgewertet.
Einige ¨ Uberlegungen zu den m¨oglichen Ursachen der negativen Steigung werden vorgestellt. Das Ph¨anomen verbreitert die Energieaufl¨osung der Linien. Mit einer geometrischen Drehung der 2D-Darstellung wird die Aufl¨osung merklich verbessert.
Im letzten Abschnitt wird ein Ausblick auf CRESST II gegeben, die weiter- entwickelte Version des Experiments mit einer totalen Detektormasse von etwa 10 kg (33 CaWO
4-Kristalle von je 300 g), die momentan aufgebaut wird.
i
The CRESST (Cryogenic
Rare Event Search with Superconducting Thermo-meters) Dark Matter search is aiming to directly detect
Weakly Interacting Massive Particles (WIMPs) via their elastic scattering off nuclei in a target.The low event rate (
≤1 per day and kg of target mass) and transferred energy (a few tens of keV) of WIMP-nucleus elastic scattering imposes the need for an extremely low energy threshold as well as active and passive background sup- pression.
Passive background suppression is achieved by operating CRESST detectors in a low background facility located in the Gran Sasso underground laboratory.
For active background suppression, the temperature- (phonon-) signal and scin- tillation light signal produced in the scintillating target crystal are measured simultaneously.
α-, electron- or γ- interactions can be distinguished from nu-clear recoils via the lower light yield of nuclear recoils with respect to electron recoils of the same energy. For this experimental feature, CRESST uses detectors consisting of a 300 g CaWO
4scintillating crystal as target for WIMP interactions and a silicon wafer as detector for the scintillating light in close vicinity, both operated as cryogenic calorimeters.
In this work, two different fit methods, the ”Truncated Fit” and the ”Nonlinear Fit”, for analysing the background data taken in 2004 with one of the CaWO
4crystals (”Daisy”) are compared. Especially for high energies (more than 4 MeV) the nonlinear fit leads to a significant improvement in resolution of the examined
α-lines. Identifying those lines by comparing them with natural decay chainsprovides information about radioactive contaminations present in the crystal.
A noticeable tilt of these high energy
α-lines in a two-dimensional graph (lightover phonon yield) is analysed quantitatively and some possible explanations concerning the physical origin of the tilt are introduced. This negative slope broadens the energy resolution of the
α-lines. By rotating the 2dimensional plot,the resolution of the measurement at high (phonon) energies can be considerably improved.
The final chapter gives an overview of the upgrade experiment CRESST II with a total detector mass of about 10kg (33 CaWO
4- crystals, 300 g each), which is currently being constructed.
ii
Contents
1 Introduction to Dark Matter 1
1.1 Dark Matter Motivation . . . . 1
1.1.1 Observational Evidence for Dark Matter . . . . 2
1.1.2 Dark Matter Problems . . . . 3
1.2 Dark Matter Candidates . . . . 5
2 The CRESST Dark Matter Search 9
2.1 Dark Matter Searches . . . . 9
2.1.1 Direct Detection . . . 10
2.1.2 Experimental Requirements . . . 11
2.1.3 Sources of Background . . . 11
2.2 The experimental Setup . . . 12
2.2.1 Radioactivity at L.N.G.S. . . 13
2.2.2 The Cryostat . . . 14
2.2.3 External Shielding . . . 16
2.3 CRESST- from Phase I to Phase II . . . 16
2.3.1 The Detector Module . . . 17
2.3.2 Background Discrimination with combined light-phonon Measurement . . . 20
3 Cryogenic Detectors 21
3.1 Detector Principle . . . 21
3.1.1 Heat Capacities . . . 22
3.1.2 Thermometer . . . 23
3.1.3 Pulse Formation . . . 23
3.2 Thermal Model . . . 25
4 Data Analysis 31
4.1 Data Acquisition System . . . 31
4.1.1 Setup . . . 31
4.1.2 Transition Curves . . . 32
4.1.3 The Stability Control . . . 32
4.2 Data Analysis . . . 34
iii
5 Gran Sasso Run 28 43
5.1 Setup, Fitting and Calibration . . . 43
5.1.1 Truncated and Nonlinear Fit . . . 44
5.1.2 Calibration . . . 46
5.1.3 Resolution . . . 47
5.2
α-Background . . . 495.2.1 Identification . . . 49
5.2.2 Quantitative Analysis . . . 51
5.3 The Phenomenon of the tilted
α-lines . . . 555.3.1 A closer Inspection . . . 55
5.3.2 Possible Explanations for the Origin of the negative Slope 58 5.3.3 Calculation of the Light Yield . . . 60
5.3.4 Improving the Phonon Detector Resolution . . . 63
6 Conclusions and Perspectives 67
6.1 Status and Perspectives of CRESST II . . . 67
6.2 Conclusions . . . 68
Appendix i
Bibliography ii
iv
Chapter 1
Introduction to Dark Matter
The existence of Dark Matter was first suggested, using simple gravitational arguments, in 1933 by Fritz Zwicky [Zwi33]. Nowadays there is overwhelming indirect evidence for the existence of Dark Matter, but despite increasing experi- mental efforts, it has not been detected directly . Precision measurements of the microwave background spectrum, combined with other astronomical and astro- physical data, have unveiled the basic parameters of the cosmological model of the Universe with high accuracy. Ordinary baryonic matter represents only about 4% of the mass of the Universe, while non-baryonic Dark Matter supplies about 26% of the total mass. About 70% of the total density needed for the presently favoured flat Universe is an energy of unknown nature, indicated as Dark Energy.
1.1 Dark Matter Motivation
Edwin P. Hubble’s observation of an expanding Universe in the 1930s [Hub29]
together with the first observation of the Cosmic Microwave Background (CMB) [Pen65] represented a solid base for the Standard Cosmological Model, which is based upon the successful hot Big Bang theory
1. The “Cosmological Principle”, built from assumptions of an homogeneous and isotropic Universe, translates into the Friedmann-Robertson-Walker (FRW) metric:
ds2
=
c2dt2−a2(t)
dr2
(1
−kr2) +
r2 dθ2+ sin
2θdφ2(1.1) where the scale factor
a(t) determines the physical size of the Universe and kcharacterizes its spatial curvature. Using the generic Einstein equation for the FRW metric for the Universe as a perfect fluid, it becomes obvious in a few
1Although powerfully predictive, the hot Big Bang theory suffers from problems concerning the initial conditions.
1
mathematical steps that the sign of
k, in absence of a cosmological constant, isdetermined by the value of Ω (Ω
≡ ρρc), with
ρcbeing the critical density of the universe as defined by Steven Weinberg [Wei72].
ρ < ρc
; Ω
<1;
k=
−1; open Universe
ρ=
ρc; Ω = 1;
k= 0; flat Universe
ρ > ρc; Ω
>1;
k= 1; closed Universe
In terms of the critical density it is possible to define the ratios Ω
i=
ρi/ρcfor matter (Ω
m), curvature k (Ω
k) and cosmological constant Λ (Ω
Λ) today. With these values the Friedmann equation of today’s Universe can be written as:
Ω
m+ Ω
k+ Ω
Λ= 1 (1.2)
Cosmic inflation (exponential expansion in the early stage of the Universe) pre- dicts a Universe very close to flat (i.e.
k≈0).
At present there is direct evidence from Cosmic Microwave Background (CMB) anisotropies measurements that Ω is very close to unity (Ω
tot= 1.02
±0.02 [Spe03]).
1.1.1 Observational Evidence for Dark Matter
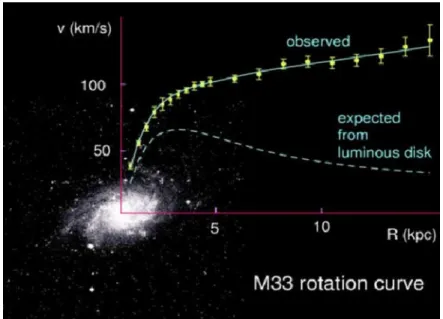
The most convincing and direct evidence for Dark Matter on galactic scales comes from the observations of the flat rotation curves of galaxies
2(see figure 1.1). In newtonian dynamics the rotational velocity is expected to be given by:
v(r) =
rG M
(r)
r .
(1.3)
where
M(r)
≡4π
Rρ(r)r2dr, withρ(r) the mass density profile. ForMtot
concen- trated in the optical disk, the circular velocity should be falling proportionally to 1/
√r
beyond the visible radius. The measured rotation curves of disk galaxies (v(r) is approximately constant for
r > rdisk) provide strong evidence for the existence of a spherical Dark Matter halo containing the galactic disc.
Besides galactic rotation curves a number of other observations indicate the presence of Dark Matter in both galaxies and galaxy clusters.
Studying gravitational lensing confirms the previous conclusion. In this case a galaxy cluster acts as a lens which distorts the light emitted by sources in its background due to the gravitational bending of light (see figure 1.2). All these analyses favour a value of Ω
dm ≈0.2
−0.3 ([Bah98], [Hoe02]).
2Rotation curves are graphs of rotational velocities of stars and gas as a function of their distance from the galactic center.
1.1. DARK MATTER MOTIVATION 3
Figure 1.1:
Observed rotation curve of the dwarf spiral galaxy M33, superimposed on its optical image. For comparison the expected velocity from the luminous disk is shown [Kha02].Figure 1.2:
Gravitational lensing observed around the galaxy cluster Abell-2218 by the Hubble Space Telescope [hub]. A luminous source in the background is projected as many arclets surrounding the cluster.1.1.2 Dark Matter Problems
Observational evidence for Dark Matter appears to be compelling, but the total
amount of Dark Matter in the Universe has only recently been estimated from
the precision analysis of the Cosmic Microwave Background [Spe03].
Background radiation originating from photons created in the early Universe was already predicted in the 1940s [Gam48], but it was (unintentionally) discovered only in 1965 by Arno A. Penzias and Robert W. Wilson [Pen65].
At present, the CMB is known to be isotropic at the 10
−5level and to fol- low a black body spectrum corresponding to
T=2.762 K. The analysis of its anisotropies (see figure 1.3) enables accurate testing of cosmological models and puts stringent constraints on cosmological parameters [col03]. The precision data
Figure 1.3:
CMB temperature fluctuations observed by WMAP. Image courtesy of WMAP Science Team.of WMAP CMB measurements [Spe03] taken in combination with the discovery of the cosmic expansion acceleration via supernova observations [Kno03] has led to a “concordance model” (ΛCDM):
Ω
m ≈0.27 Ω
Λ≈0.73
This is in good agreement with the inflationary prediction of the matter and cosmological constant contributions adding up to unity.
The concordance model is summarized in figure 1.4. One fraction of Dark
Matter is present in the form of baryons since the baryon density predicted by the
combination of CMB and BBN (Big Bang Nucleosynthesis) is much larger than
the measured amount of luminous matter. Similarly, the difference between the
best fit for Ω
mand the predicted Ω
bmust be present in the form of non-baryonic
Dark Matter.
1.2. DARK MATTER CANDIDATES 5
Figure 1.4:
Current cosmological constraints on the matter density Ωmand the energy density ΩΛ give the best estimate marked with a cross at Ωm=0.27, ΩΛ=0.73. The baryon density (black vertical band) does not exceed 0.05. The rest of the matter is non-baryonic. Luminous matter (pink vertical band) does not contribute more than 0.006. Figure adapted from [Gon04].1.2 Dark Matter Candidates
The evidence for the existence of Dark Matter is compelling on all astrophysical scales. The diversity of Dark Matter candidates is rather large. They are classi- fied in two fundamental groups:
Baryonic Dark Matter
These baryons are dark in the sense that they neither emit nor absorb light.
This results in stringent observational limits on many candidates [Spi99] [Spi00].
Brown dwarfs, stars with low mass (0.01 M
<M
<0.08 M
) which shine only
due to gravitational contraction, are the most plausible candidates. As most
of the stars are small, one expects a significant number of such objects in the
galaxy, nevertheless their existence is difficult to prove.
Primordial black holes created in the early Universe could also be good can- didates. The main objection against their existence is the lack of a plausible mechanism for their formation. All those relatively “standard” astrophysical bodies are collectively known as MAssive Compact Halo Objects (MACHOs).
Non-baryonic Dark Matter
These candidates are mainly classified based on their temperature at the time of decoupling from thermal equilibrium which has fundamentally different con- sequences for structure formation in the Universe.
Hot Dark Matter candidates (HDM)
were relativistic at the time of decou- pling. The first structures formed by HDM particles would be clouds of super- galactic size, all smaller fluctuations being erased. HDM models yield a top-down scenario in which supergalaxies are formed first and galaxies later evolve from their collapse
3.
Cold Dark Matter candidates (CDM)
were non-relativistic at the time of decoupling. They were slow enough to be bound in perturbations on the galactic scale. CDM models do produce galaxies naturally and large scale structures have to be assembled from those later
4.
A consistent scenario modelling the universe results if a substantial cold Dark Matter component and a subdominant hot Dark Matter component are assumed.
Here only the best motivated and most interesting candidates will be presented.
Neutrino
scenarios have the obvious advantage that these particles are known to exist in nature.
Solar and atmospheric neutrino oscillations indicate that they do have a mass;
they could compose a fraction of the Dark Matter. The CMB and large scale structures’ data suggest a relic
ν-density of Ωνh2 <0.0067 (95% C.L.). Such astringent upper limit rejects currently known neutrinos as a major constituent of Dark Matter. Moreover, since they are light
5and were relativistic at the time of galaxies formation, they are a hot, therefore subdominant, Dark Matter com- ponent.
3There are several examples of galaxies that are older than the group in which they exist; in addition, in this scenario galaxies in clusters would be expected to fall in rather than streaming away.
4In this scenario, there is not enough time to achieve the observed structures within the known age of the Universe.
5The upper limit on the neutrino mass is mi <2.05 eV (95% C.L.) for all three active neutrinos mass eigenvalues since the mass differences among them are constrained by the observation of flavor oscillation [GG03].
1.2. DARK MATTER CANDIDATES 7
Axions
are hypothetical light pseudoscalar particles often discussed as Dark Matter candidates [Tur90].
Laboratory searches [col04a], stellar cooling and the dynamics of the supernova SN1987A constrain axions to be very light and extremely weak coupled to or- dinary matter and therefore to have an extremely long lifetime (many orders of magnitude larger than the age of the Universe). Axions produced in the Big Bang were never in thermal equilibrium and always non-relativistic (i.e. they are cold Dark Matter). The calculation of axion relic density depends on the as- sumed production mechanism. Nevertheless there is a range where axions satisfy all present day constraints to represent a possible Dark Matter candidate.
Supersymmetric candidates - WIMPs
Supersymmetry is a symmetry of space-time
6important for cosmology because it requires the existence of a new particle for each one in the Standard Model of particle physics
7. Superpartners can be much heavier than their normal coun- terpart if supersymmetry is broken (as assumed, since superpartners are not detected)
8.
The lightest supersymmetric particle (LSP) is stable and can only be destroyed via pair annihilation, making it an excellent Dark Matter candidate. It has zero electric charge and color, otherwise it would have condensed with baryonic mat- ter producing heavy isotopes, in conflict with observations.
Among possible LSP, the best motivated Dark Matter candidate is the lightest neutralino,
χ.Neutralinos represent a particular realization of a generic Weakly Interacting Massive Particle (WIMP).
WIMPs were in thermal equilibrium with ordinary particles in the early Uni- verse and non-relativistic at the time of decoupling. The calculation of the relic density of such a thermal WIMP from the freeze-out condition shows that the canonical weak interaction cross section value is just right to yield a relic density in the range needed to obtain the observed density of the Universe. This raises the hope of detecting relic WIMPs directly [Goo85].
The aim of the CRESST experiment is to search for WIMPs as non-baryonic Dark Matter candidates.
6Supersymmetry was introduced in the process of unifying the fundamental forces of nature.
7Supersymmetric partners differ by half a unit of spin. Such a transformation turns fermions into bosons and vice-versa.
8If supersymmetry was an explicit symmetry of nature, superpartners would have the same mass as the Standard Model partners.
Chapter 2
The CRESST Dark Matter Search
The aim of the CRESST (Cryogenic
Rare Event Search with Superconducting Thermometer) experiment is to detect WIMP Dark Matter particles via theirelastic scattering off target nuclei in the absorber of a cryogenic detector.
Due to the small energy deposited in a detector by a WIMP-nucleus elastic scattering event and the small expected event rate, it is of crucial importance for all direct detection experiments to suppress signals from radioactivity, which would hide or mimic the WIMP signal. In all experiments passive suppression is achieved via a low background setup and the location in a deep underground site. The residual radioactive background represents the main limitation to the sensitivity of experiments, therefore dramatic improvements are achieved if the detector itself is able to distinguish between radioactive background and nuclear recoil signals induced by WIMPs in the absorber.
In this chapter a characterization of the CRESST direct detection experi- ments, especially the setup in Gran Sasso and an overview of the detector module developed for the second phase of the CRESST experiment, are presented.
2.1 Dark Matter Searches
Direct detection experiments appear today as one of the most promising tech- niques to detect WIMP Dark Matter. The basic idea of all direct detection experiments relies on the fact that WIMPs cluster gravitationally with ordinary matter in galactic halos and therefore must be present in our own galaxy. The scattering of such particles off the nuclei of ordinary matter on Earth can be detected.
9
2.1.1 Direct Detection
The WIMP-nucleus elastic scattering in a detector is simply the interaction of the WIMP with the nucleus as a whole, causing it to recoil. Here the observed signal is the recoil energy spectrum in the target, therefore detector sensitivity to nuclear recoils is crucial.
WIMP elastic scattering off nuclei is commonly discussed in the context of two classes of couplings. Spin dependent (axial) interactions result from the coupling to the spin content of a nucleon, therefore the cross section for spin dependent scattering is proportional to
J(J+ 1).
In the case of spin independent (scalar) interaction, the cross section scales as
A2. Therefore, for coherently interacting WIMPs, massive nuclei are desirable.
Recoil Energy Spectra
Figure 2.1 illustrates the quasi-exponential dependence of the signal rate on the recoil energy. In the case of CaWO
4, the target used in the CRESST setup, the expected recoil energy spectrum extends only up to about 40 keV.
Figure 2.1:
Normalized recoil spectrum for WIMP elastic scattering on CaWO4 for WIMP masses of 10, 100 and 1000 GeV/c2.2.1. DARK MATTER SEARCHES 11
2.1.2 Experimental Requirements
The described characteristics of the WIMP-nucleus elastic scattering determine the main experimental requirements for direct detection experiments:
Energy threshold
as low as possible due to the quasi-exponential decreasing of the signal as a function of the recoil energy.
Target mass
as high as possible in order to compensate the small cross section for WIMP-nucleus elastic scattering.
Background
highly suppressed in order to allow a spectrum of rare nuclear recoils to be observed.
The suppression of background is particularly important because the ability to detect a WIMP energy spectrum on top of a background spectrum of unknown shape determines the sensitivity of a WIMP search.
One strategy to enhance the experimental sensitivity relies on distinguishing the background. Due to the fact that WIMPs and neutrons interact predominantly with nuclei while ionizing radiation interacts mainly with atomic electrons, the possibility to discriminate between nuclear and electron recoils establishes an efficient background rejection technique. A significant number of experiments which apply an event-by-event discrimination make use of cryogenic detectors (CDMS, EDELWEISS, CRESST-II).
2.1.3 Sources of Background
Rare event searches are limited by
radioactive backgroundsignals due to cosmic rays, natural or induced radioactivity. In carefully constructed low back- ground experiments, materials used for detectors are the dominant source of background; therefore careful selection of materials is mandatory.
Cosmic radiation at sea level is composed of about 70% muons, nearly 30% elec- trons and less than 1% protons and neutrons. Muons represent the most pene- trating component that contribute to the detector background in various ways:
by depositing energy in traversing the detector itself; by producing energetic elec- trons, which induce secondary electrons and gamma radiation; by interactions with materials surrounding the detector followed by X-,
γ- and neutron-emission.Spallation processes induced either directly by muons or via muon-produced neu- trons result in additional radioactive nuclei.
Besides these cosmogenic radionuclides the main contribution to environmental
radioactivity is due to primordial radionuclides and to radioisotopes man-made
in the last decades.
2.2 The experimental Setup
The shielding of experiments against cosmic radiation is achieved by installing the setup in a deep underground site.
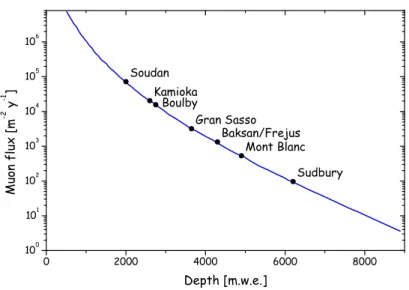
The CRESST facility is located in the Abbruzzo mountains, Italy (Laboratori Nazionali del Gran Sasso, L.N.G.S.) in a very low background environment below the Gran Sasso mountain at an average depth of about 3500 m.w.e.
1. This reduces the cosmic muon flux by 6 orders of magnitude to about 1 m
−2·h
−1(see figure 2.2).
Figure 2.2:
The depth - intensity relation of cosmic ray muons. The circles indicate values for some underground laboratories. Figure adapted from [Kos92].Sample
γactivity [Bq
·kg
−1]
232
Th
238U
40K
214Bi
Hall A Rock 8.8
±0.3 84.7
±8.4 224
±6 41.9
±0.6
Table 2.1:
Activity of samples of rock from the Gran Sasso underground laboratory [Arp92].1Meter water equivalent.
2.2. THE EXPERIMENTAL SETUP 13
0 20 40 60 80 100
10−7 10−6 10−5 10−4 10−3 10−2 10−1 100
Deposited Energy (keV)
cts/kg/keV/day
a
b c d
e
Figure 2.3:
Simulated recoil spectra in a CaWO4 detector in different scenarios: (a) low energy neutrons from the rock/concrete in the L.N.G.S. halls without neutron moderator; (b) low energy neutrons from the rock/concrete moderated by 50 cm of polyethylene; (c) low energy neutrons from fission reactions due to 1 ppb 238U con- tamination in the lead shield; (d) high energy neutrons induced by muons in the rock;(e) high energy neutron induced by muons in the experimental setup. Figure from [Wul04].
2.2.1 Radioactivity at L.N.G.S.
The activity of samples of rock from each of the three halls of the L.N.G.S.
has been measured. The results for Hall A (the CRESST location) are re- ported in table 2.1. The integral gamma flux calculated for all natural chains is
∼
1
γ·cm
−2·s
−1[Arp92].
A separate treatment is needed for
222Rn that comes from
226Ra
αdecay (
238U decay chain) which is widely present in rock and soil. The
222Rn half life is long enough for this noble gas to diffuse into the air and groundwater. With the present ventilation system the activity due to
222Rn and its daughter nuclei is between 10 and 20 Bq
·m
−3.
In the case of WIMP search experiments particular attention must be devoted to neutrons since they scatter off nuclei in the absorber simulating a WIMP signal.
Neutrons can originate from muon interactions in the last meters of material
surrounding the experiment and from spontaneous fission or (α,n) reactions due
to natural radioactivity of the rock or shielding material. A simulation of dif-
ferent possible arrangements shows that, with a neutron moderator installed,
the remaining neutron flux is dominated by neutrons induced by muons in the
experimental setup (see figure 2.3). This background can be suppressed with a
muon veto system.
2.2.2 The Cryostat
The CRESST cryostat is a commercial
2dilution refrigerator whose design had to combine the requirements of low temperature with those of low background.
The main challenge was to avoid any line of sight between detectors housed in a low background cold box and non-radiopure materials. The low temperature
coldboxdilutionrefrigerator
liquid Nitrogen
liquid Helium
mixing chamber internal Lead shields
external Lead shield
external Copper shield thermal radiation shields
prototype detectors cold finger
passive shielding support wagons rails
m
0 0.5 1 m
0 0.5 1
Figure 2.4:
Schematic view of CRESST cryostat and passive shielding2No special selection of materials for low radioactivity has been applied for the dilution unit.
2.2. THE EXPERIMENTAL SETUP 15
of the dilution refrigerator (abouy 6 mK) is brought to the detectors via a 1.5 m long radiopure copper cold finger. A 20 cm thick internal lead shield (
210Pb with an activity of 3.6 Bq
·kg
−1) is placed between the mixing chamber and the cold finger. This shield, combined with another one at liquid nitrogen temperature surrounding the cold finger, blocks the line of sight for radiation between the dilution refrigerator and the experimental volume.
The cold box consists of concentric copper radiation shields at five different temperatures: room temperature, liquid nitrogen and liquid helium temperature and two inner radiation shields at 600 mK and 80 mK.
To reduce external vibrations the cryostat hangs from a 20 cm thick wood plate which rests on air dampers. To decouple the detector unit from the surroundings, it is mounted onto a spring loaded support plate hanging from the cold finger inside the cold box.
A three level building (figure 2.5) houses the whole setup. A two level Faraday cage surrounds the experiment. Its ground floor, containing the cold box and the lower part of the cryostat, is equipped as a clean room. The upper level of the Faraday cage is outside the clean room so that maintenance can be done without entering the clean environment. The cryostat gas handling and the pumping system, as well as the data acquisition system, are located outside the Faraday cage. The third floor serves as a small chemistry laboratory and has a laminar flow area to prepare detectors.
Figure 2.5:
Cross section of the CRESST building. The external passive shielding is shown in both its open and closed positions.2.2.3 External Shielding
Materials with high density and high atomic number Z like lead and radiopure materials like copper provide shielding against environmental radioactivity. The CRESST passive shielding is made of two closely fitting halves that can be opened without handling the individual pieces (see figure 2.5). It is composed of a 14 cm radiopure copper inner shielding followed by 20 cm of Bolidean lead with a
210Pb activity of 35 Bq
·kg
−1[B¨ uh96]. The entire shielding is enclosed in an air tight radon-box which is constantly flushed with nitrogen atmosphere in order to prevent radon from penetrating the shielding.
No neutron shield was available for the measurements presented in this work.
2.3 CRESST- from Phase I to Phase II
Nokogiriyama (LiF)
UKDM DAMA
CRESST EDELWEISS (Al2 O3)
Spin Dependent Interaction
σ WIMP-Proton [pb]
WIMP mass [GeV/c2]
Figure 2.6:
Equivalent WIMP-proton cross section limits (90% C.L.) for a spin- dependent interaction as a function of the WIMP mass from a 1.51 kg·day exposure of a 262 g sapphire detector. For comparison limits are shown from CDMS,[Abu00], EDELWEISS [Ben01], UKDM [Spo00] and [Ber00].In its first phase the CRESST experiment used sapphire crystals of 262 g as
detectors, equipped with tungsten superconducting phase transition thermome-
ters. With this setup 100% trigger efficiency down to a threshold of 580 eV and
a background of 0.73 counts/keV/kg/day throughout a dark matter run were
achieved [Ang02]. Sapphire, especially aluminum, has a low atomic mass but
a spin of +5/2, so that the former experiments were rather sensitive to spin
2.3. CRESST- FROM PHASE I TO PHASE II 17
dependent interactions. In figure 2.6 exclusion plots for spin dependent inter- action derived from this run are shown. The extremely low threshold achieved in CRESST I allowed to explore the WIMP scattering cross section for WIMP masses down to 1 GeV. The sensitivity of phase I was limited by the residual background in the detector. Significant improvements require the possibility to actively distinguish between radioactive background and a possible WIMP in- teraction in the absorber. In the second phase of the CRESST experiment, the technique of active discrimination of the background events was introduced and will be used to further improve the detector sensitivity.
2.3.1 The Detector Module
Starting from the 6 g proof-of-principle device, the development of 300 g proto- type modules has been started in [Fra02]. The schematic view of a module for coincident phonon and light measurement is shown in figure 2.7.
incident light
thermometer thermal coupling
heat sink
Silicon absorber
incident particle
heat sink
CaWO4
absorber
thermometer reflecting
cavity
Figure 2.7:
Schematic view of a particle interaction in a prototype module for coinci- dent light and phonon measurement.Phonon detectors
Phonon detectors developed for the second phase of the CRESST experiment
consist of a 300 g cylindrical CaWO
4crystal (40 mm in diameter and in height)
read out by a tungsten superconducting phase transition thermometer.
Dedicated to the CRESST application, scintillation properties of CaWO
4crys- tals have been thoroughly investigated at room temperature using a standard photomultiplier setup [Nin05].
Light yield and energy resolution strongly depend on the crystal sample and are affected by the crystal processing with a decrease in light yield up to 50% after sensor deposition as observed. An important improvement of energy resolution and light yield has been achieved by roughening the crystal surface facing the light detector. This reduces the influence of the internal total reflection and faciliates the escape of the scintillation light from the crystal.
Light detectors
An extremely sensitive light detector is required to be able to measure tiny amounts of light.
The detection of the light emitted by the scintillating absorber is obtained by using cryogenic light detectors which consist of a non-transparent absorber for the scintillation light, equipped with a tungsten superconducting phase transi- tion thermometer
3.
During the prototyping phase of CRESST II, the light detector absorbers con- sisted of a (30
×30
×0.45)mm
3n-type silicon wafer with 200 ˚ A SiO
2layer on both surfaces.
Holder
The detector holder represents the innermost layer of the CRESST setup, there- fore high radiopurity standards have been pursued. Highly radiopure copper is used for the support structure which consists of a cylindrical copper device that holds the scintillating crystal and two end-caps with the light detector in one of them. A schematic view of the holder is shown in figure 2.8 and an open detector module can be seen in figure 2.9.
During operation, the detector holders are thermally linked via the cold finger to the mixing chamber of the cryostat.
Light collection
The scintillation light escaping from the crystal must be absorbed in the light detector. The solution adopted by CRESST has both components of the detector module inside a reflector that leads to a fully exposed light detector. Due to the unfavourable ratio of areas between the light detector and the reflecting surface of the holder, an average photon has to undergo many reflections before hitting the light detector. Therefore the use of a reflector with a high overall reflectivity
3More common photo detectors like photomultipliers or photodiodes are not able to work at a few mK.
2.3. CRESST- FROM PHASE I TO PHASE II 19
Teflon clamps Copper holder
CaWO crystal4
Silicon absorber
Figure 2.8:
Exploded view of a detector module with main parts indicated. The reflector is not shown.Figure 2.9:
Picture of an open detector module for CRESST phase IIis mandatory. The reflective housing is made of a polymeric multilayer foil with a reflectivity above 98% for wavelengths in the range 400-1000 nm for all incident angles and polarizations
4.
Also for
α-decays which mimic a WIMP signal5, a scintillating surrounding
4The spectrum of the scintillation light of CaWO4 at 20 K peaks at about 420 nm [Kee02].
5In such cases the daughter nucleus reaches the detector while theαis absorbed in the foil.
should allow clear identification of these events as background.
The final goal of a 300 g module with a discrimination of better than 99.7% down to energies of 15 keV stated in the proposal for CRESST phase II [Alt01] has been completely fulfilled with prototype detectors that were running in Gran Sasso.
Analogous modules will therefore be used for the second phase of the CRESST experiment.
2.3.2 Background Discrimination with combined light-phonon Measurement
In the second phase of CRESST, scintillating crystals are used as absorbers. The energy deposited in the scintillating crystal by a particle interaction is mainly transferred to the phonon system and only a small fraction is converted into scintillation light
6. The background discrimination technique relies on the lower light yield of nuclear recoils, which result from WIMP or neutron interaction, with respect to electron recoils of the same energy resulting from
α-, β- and γ-interactions.By a simultaneous measurement of scintillation light and phonons via two tem- perature signals coming from the two calorimeters, it is therefore possible to discriminate the recoils [GM89] and reject the remaining background which is dominated by
β- and γ-emissions from radioactive contaminants inside and inthe surrounding of detectors. This opens significant possibilities of improvement.
The active background discrimination technique can work with many different scintillating crystals
7(BGO, BaF
2, PbWO
4, CaWO
4, ZnWO
4) whose light out- put has been studied at low temperature [Meu99].
CaWO
4has been chosen because of its relatively high light yield at low tempera- tures [Meu99]. In addition, the large atomic mass of tungsten (A
W=183.86) that enhances the WIMP-nucleus coherent interaction probability makes CaWO
4a very favourable target.
6Typically for CaWO4 only few percent (3.6% of the deposited energy, according to [Nin05])of the deposited energy is converted into scintillation light, but the light yield depends critically on the crystal sample.
7The discrimination based on the simultaneous detection of a phonon and a charge signal restricts possible targets to semiconducting materials.
Chapter 3
Cryogenic Detectors
The use of cryogenic detectors in WIMP searches has the advantage of having low energy threshold, excellent energy resolution and the ability to measure the full energy deposited by a particle interaction, independent of the interaction mechanism
1. This combination makes them unique for the detection of nuclear recoils that would result from a WIMP interaction.
In this chapter the general detection principle of low temperature detectors with dielectric absorbers is presented with a detailed description of detectors developed for the CRESST experiment.
3.1 Detector Principle
The typical detector studied here consists of a dielectric absorber where the parti- cle interaction takes place and of a stripe of superconducting material evaporated onto one of its surface serving as a thermometer. The detector response to an energy deposition depends on the various processes occurring in the device. A detailed description of a theoretical model for the signal evolution in a low tem- perature calorimeter is given in [Pr¨o95].
A thermal detector consists of an absorber and a temperature sensor in thermal contact, weakly linked to a heat bath. In a very simplified calorimetric model, an energy deposition in the absorber ∆E leads to a temperature rise of the detector with heat capacity C given by
∆T = ∆E
C ,
(3.1)
which then relaxes back in an exponential decay to its equilibrium value via the thermal coupling to the heat bath. The temperature rise is therefore a direct
1Conventional detectors that measure ionization or scintillation show a significant quenching for nuclear recoil events with respect to electron recoil events of the same energy.
21
measurement of the deposited energy.
3.1.1 Heat Capacities
Heat capacities of different parts of detectors play a fundamental role because they define the achievable temperature rise for a defined energy deposition.
Non-magnetic crystalline dielectrics have a heat capacity dominated by the lattice specific heat
cph. At low temperatures it is described by the Debye model as:
cph
= 12π
45
nakBT
Θ
D3
=
AT3(3.2)
where Θ
Dis the Debye temperature,
nais the number of lattice atoms per mole and
Ais a constant of the material. The heat capacity of dielectrics and pure semiconductors at mK temperatures is very small, making them suitable materials to be used as absorbers.
The temperature sensors used in CRESST are metal films in which, besides lattice vibrations, there are conduction electrons that can be thermally excited.
The electronic contribution
ceto the heat capacity is given by:
ce
=
π22
nekBT TF
=
γT(3.3)
where
TFis the Fermi temperature,
neis the number of conducting electrons per mole and
γis the Sommerfeld constant which depends on the material [Pob92].
Accordingly, by adding equation 3.2 and equation 3.3, the specific heat of metal can be expressed as
2[Pob92]:
cmetal
=
cmetalph+
cmetale= 12π
45
nakBT
Θ
D3
+
π22
nekBT
TF
=
AT3+
γT(3.4) The linear dependence of
cmetalemakes it the dominant term of the heat capacity of a metal at low temperatures.
In a superconductor below the critical temperature
Tc, the electronic specific heat has an exponential temperature dependence, whereas the lattice contribution is not influenced by the transition to the superconducting state. In the CRESST phonon detector (with
T < Tc/10), the electronic contribution is negligible andthe heat capacity is dominated by the lattice specific heat of the thermometer.
2The specific heat due to lattice vibrations and to conduction electrons in a metal can be treated independently, to a good approximation, due to the large mass difference of nuclei and electrons (Born-Oppenheimer approximation).
3.1. DETECTOR PRINCIPLE 23
Noise Sources
Noise limits the performance of a detector in terms of threshold and resolution critically. Noise sources originate from the detector itself, from the readout sys- tem and from the environment in which detectors are operated.
Phonon noise, spontaneous random energy flow into and out of the thermometer, occurs at all times leading to a fluctuation of the energy content of the calorime- ter. This phonon noise determines the ultimate physical limit for the achievable energy resolution because it represents a constant background noise. In CRESST detectors, the contribution of phonon noise to the measured signal shows a 1/
√C
dependence that makes it relevant for sensors with a small heat capacity C.
External disturbances like temperature fluctuations of the heat bath or vibra- tions and electrical interferences that reach the detector can show up as noise in the detector response. These external noise sources can be suppressed by a careful design of the experimental setup as described in chapter 2.2.
3.1.2 Thermometer
The thermometers developed for CRESST are superconducting phase transition thermometers (SPT) consisting of tungsten thin films (ca. 1-2 k˚ A thickness) evaporated onto the absorber. The SPTs are stabilized in the transition from the normal conducting to the superconducting phase where a small temperature rise leads to a relatively large increase in resistance, making them extremely sen- sitive thermometers.
Typical transitions (see figure 3.1) have a width of the order of 1 mK and a total variation in resistance of a few hundred mΩ. The width of the transition curve defines the dynamical range while its slope determines the sensitivity of the ther- mometer
3.
Thermometers are stabilized at the operating point within a few
µK using aheater. The same heater is also used to monitor the detector stability. The sen- sor is thermally connected to the heat bath by a normal conducting link.
3.1.3 Pulse Formation
Any energy deposition in the absorber creates high frequency phonons. Ionizing radiation mainly releases its energy in the electron branch, producing optical phonons via relaxation of the electronical excitations
4. These decay to an al- most monoenergetic frequency distribution of acoustic phonons of about half the
3The sensitivity of a thermometer is expressed as δRf/δT, resistance change versus tem- perature change.
4In the case of scintillating materials the emission of photons, however highly suppressed compared with the emission of phonons, is extremely important for the event discrimination.
Figure 3.1:
Typical measured transition curve of a tungsten film. The normal con- ducting resistance of the film depends on its geometry.Debye frequency (for CaWO
4 νD=
kBΘ
D/h ≈4.7
T Hz). However, by α- andheavy ion-events and dominantly by neutron- and WIMP-interactions, energy is deposited in the nuclear branch and nonthermal acoustic phonons are produced in a broad frequency range via the local deformation of the crystal lattice.
The initial phonon spectrum depends on the original interaction. The phonon populations are not in equilibrium and start to decay towards a thermal distri- bution. Longitudinal acoustic phonons, due to lattice anharmonicity, decay with a rate Γ
decay=
η(ν/νD)
5where
νis the phonon frequency. The ratio (ν/ν
D) contains the major dependency on the material whereas
ηis similar for all mate- rials. Initially, the average phonon frequency decreases rapidly due to the strong frequency dependence of Γ
decay. On the time scale of
µs, all differences in thephonon spectra are washed out. A much slower rate of change keeps the average phonon frequency distribution almost constant for a few milliseconds
5. During that time the nonthermal phonons spread ballistically over the entire absorber filling it uniformly.
The transmission probability across the boundary from absorber to thermometer gives the energy flux per unit area and unit time [Pr¨o95].
If
E/Vis the thermal energy density, the Kapitza boundary conductance
GKof thermal phonons between two materials can be derived from [Pr¨o95]:
GK
=
Q˙
abs→th(T + ∆T )
−Q˙
th→abs(T )
∆T =
C2V
hv⊥αi ∝T3(3.5)
5The phonon population does not thermalize in the absorber on such a time scale.
3.2. THERMAL MODEL 25
where
C/Vis the heat capacity per unit volume of the first material,
v⊥is the phonon group velocity normal to the interface,
αis the transmission probabi- lity and
h...idenotes the average over modes and wave vectors of the incident phonons. The cubic temperature dependence of the Kapitza coupling comes from the
T3dependence of the phonon heat capacity.
The electron-phonon coupling
Gepdetermines the thermal coupling of the ab- sorber to the electrons of the thermometer. For thermal phonons at low tempe- ratures, it can be expressed as:
Gep ∝T5.
(3.6)
The electron system is effectively thermally decoupled from the phonon system of the thermometer and thus from the phonon system of the absorber
6. Therefore, the absorption of nonthermal phonons overheats the thermometer with respect to the absorber. The temperature of the electron system of the thermometer determines its resistance and hence the measured signal.
The detector sensitivity is determined by the heat capacity of the thermometer film. The absorber material affects it only by means of its phonon transport properties. Therefore the detector sensitivity shows a linear dependence on the velocity of sound in the absorber material (see equation 3.13).
The thermal relaxation time
τ=
C/Gof the thermometer is defined through the strength of its coupling to the heat sink.
3.2 Thermal Model
Figure 3.2 is a schematic representation of a thermal model, where the detector consists of three weakly coupled thermal subsystems characterized by their heat capacity
Cand their temperature
T[Pr¨o95]. The phonon systems of absorber and thermometer are thermally coupled via the Kapitza coupling
GK; the phonon and the electron system of the thermometer are coupled by the electron-phonon coupling
Gep; finally the detector is coupled to the heat bath via the thermal link of the thermometer
Geband directly via its mechanical mounting that can be modelled as a thermal conductance
Gab. At low temperatures,
Gebcan be calculated from the Wiedemann-Franz-Law as
Geb
=
LT /R,(3.7)
where R is the residual resistance at low temperature T and L the Lorenz num- ber
7.
6In the superconducting phase, the thermal coupling between electrons and phonons is still further weakened.
7L=2.45·10−8W·Ω·K−2
Since the heat capacity of the phonon system of the thermometer at low tem- peratures can be neglected (see equation 3.2), the coupling between the electron system of the thermometer and phonon system of the absorber can be written as:
Gea
=
1
Gep
+ 1
GK−1
.
(3.8)
heat bath
G
ebG
abG
epG
KT
bC
e, T
eC
a, T
aC
p, T
pelectron system
phonon system in the thermometer
phonon system in the absorber
P
e(t)
P
a(t) G
eaFigure 3.2:
Schematic view of the thermal model of the calorimeter.To obtain a quantitative model, it is assumed that:
- the energy ∆E deposited by an interaction creates high frequency phonons directly after the interaction;
- those high frequency phonons fill the volume of the absorber
Vawith a uniform energy density ∆E/V
a;
- the thermalization rate of these phonons is independent of their frequency and
modelled by a direct time dependent power input
Pa(t) into the thermal
phonon population;
3.2. THERMAL MODEL 27
- the electron system of the thermometer experiences a time dependent power input
Pe(t) due to the interaction with nonthermal phonons.
The initial power input into the thermometer is:
P0
= ∆E
τn,
(3.9)
where represents the fraction of high frequency phonons thermalized in the thermometer and
τnis the effective time constant for the thermalization of high frequency phonons via two competing phenomena in the absorber and in the thermometer.
τncan be expressed as:
τn
=
1
τf ilm
+ 1
τcrystal−1
(3.10) where
τf ilmand
τcrystalare the time constants for the thermalization in the ther- mometer film and in the absorber crystal respectively.
The time constant
τcrystalis a property of the crystal and (in particular) the crystal surface and is expected to scale as the ratio between the volume and the surface area of the absorber (τ
crystal ∼Va/Aa).
The time constant
τf ilmis given by:
τf ilm
=
τ0¯
η , τ0
= 2V
aAhv⊥αi
(3.11)
with
Abeing the absorber-thermometer interface area and
τ0being the ideal thermalization time for complete thermalization in the thermometer ( = 1) and complete absorption of high frequency phonons transmitted into the film (¯
η= 1).
The fraction of phonons thermalized in the thermometer, given by =
τnτf ilm
=
τcrystalτcrystal
+
τf ilm ,(3.12)
affects the power input into the electron system of the thermometer
Pe(t). From equations 3.11 and 3.12, one can see that the initial power input
P0only depends on the area of the thermometer-absorber interface and on the transmission and absorption probabilities as:
P0
=
∆E τn= ∆E
τf ilm8
(3.13)
8The dependence ofP0 onτn explains the linear dependence of the detector sensitivity on the velocity of sound in the absorber material.
Assuming the thermalization rate to be frequency independent
9, the power inputs have a simple exponential time structure:
Pe
(t) =
P0e−τnt , Pa(t) = 1
−Pe
(t). (3.14)
The thermal model of figure 3.2 can be described by two coupled differential equations for the temperature
Teof electrons in the thermometer and for the temperature
Taof phonons in the absorber:
Ce
dTe
dt
+ (T
e−Ta)G
ea+ (T
e−Tb)G
eb=
Pe(t) (3.15)
CadTa
dt
+ (T
a−Te)G
ea+ (T
a−Tb)G
ab=
Pa(t) (3.16) where
Tbis the temperature of the heat bath.
With the initial conditions
Ta(t = 0) =
Te(t = 0) =
Tb, the equations have the following solution [Pr¨o95] for the thermometer signal ∆T
e(t):
∆T
e(t) = Θ(t)[A
n(e
−t/τn −e−t/τin) +
At(e
−t/τt −e−t/τn)] (3.17) where the step function Θ(t) takes into account the assumption of an instan- taneously established homogeneous distribution of nonthermal phonons in the absorber after the energy deposition. The solution consists of two components: a nonthermal component, that originates from the direct absorption of nonthermal phonons in the thermometer film, with amplitude
Anand a thermal component, caused by the temperature rise of the absorber as measured by the thermometer, with amplitude
At.
The time constants appearing in solution 3.17 are the effective time for therma- lization of nonthermal phonons
τn10, the intrinsic thermal relaxation time of the thermometer
τinand the thermal relaxation time of the absorber
τt.
For CRESST detectors
Ce Ca, therefore
τin,
τtand
Ancan be approximated as:
τin ≈ Ce
Gea
+
Geb(3.18)
τt ≈ Ca
GebGea
Geb+Gea
+
Gab(3.19)
An≈ P0
(G
ea+
Geb)
1
−ττinn1
−ττint=
− ∆E Ceτn
τin −
1 1
− ττint .(3.20)
9A frequency independentτf ilm results when the metal film is thick enough to absorb all transmitted phonons. The situation for τcrystal is less clear. However, the assumption of a frequency independent thermalization is justified by observation [Pr¨o95].
10τn =C/Gis defined by the coupling strength.
3.2. THERMAL MODEL 29
For the analytic solutions to the upper parameters and the approximations see [Pr¨o95].
At very low operating temperatures, where
Gea Geb, the intrinsic time con- stant of the thermometer
τincan be controlled by the thermal conductance of the thermometer to the heat sink
Geb.
The ratio
τin/τncontrols the sign of
An, thus determining the character of the nonthermal component.
A detector for which
τn τinholds, is operating in the bolometric mode, measuring the flux of nonthermal phonons. In this case,
τinis the rise time and
τnthe decay time of the nonthermal component. Apart from the short rise time, the nonthermal component is proportional to
Pe(t). The amplitude of the nonthermal component is then positive and proportional to the power input (A
n ≈ P0/(Gea+
Geb)). It is determined by the power absorbed in the ther- mometer and the total thermal coupling of the thermometer.
A detector for which
τin τnholds, integrates the power input
Pe(t) and the amplitude of the nonthermal component measures the total energy of the high- frequency phonons absorbed in the thermometer (A
n ≈ −∆E/Ce). This is the calorimetric mode of the detector. In this operating mode the time constant
τndefines the rise time of the nonthermal signal component and
τindefines its decay time.
Light detectors used in the CRESST experiment are optimized to work in the calorimetric mode. Phonon detectors, due to the characteristics of the CaWO
4crystals
11, operate in the bolometric mode instead.
11The effective time for the thermalization of high frequency phononsτnis dominated by an extremely longτcrystal.
Chapter 4
Data Analysis
The main setup of the CRESST experiment, used for the Dark Matter search, has been described in chapter 2.2.
First Dark Matter data using the light-phonon discrimination technique were collected in the Gran Sasso underground site with two CaWO
4crystals, ”Julia”
and “Daisy” with associated light detectors ”BE14” and “BE13”, respectively.
The prototype detector module Daisy/BE13 will be considered further in this work.
In this chapter a short overview of the data acquisition system is given in combi- nation with general experimental procedures. The data analysis techniques and two different fitting methods are introduced and explained.
4.1 Data Acquisition System
4.1.1 Setup
During data taking periods in the Gran Sasso setup the mixing chamber tem- perature was monitored with a carbon resistor and stabilized at
Tb ≈6
mK. Astability of
±7
µK was reached in normal running conditions.Electrical connections of the detectors are provided by twisted pairs of supercon- ducting wires in order to reduce electromagnetic interference.
The heaters of each detector are fed by a summing amplifier which adds the volt- age for regulating the temperature and the voltage corresponding to the heater pulses, followed by an analog square-rooter that linearizes the dependence of the heating power on the input voltage
1. The heating power (and thus the detector stability) is regulated by a digital to analog converter (DAC) connected to the
1The presence of a square-rooter is essential if the same heater is used for stabilization and for test pulses. The pulse energy would otherwise depend on the offset heating power applied to stabilize the detector at the operating point.