Study of Zinc Tungstate as Target Material for Cryogenic Dark Matter
Search
Diplomarbeit
am Max-Planck-Institut für Physik (Werner-Heisenberg-Institut)
Katrin Zimmermann von
Fakultät für Physik and Astronomie Julius-Maximilians-Universität Würzburg
12. Juli 2012
Verantwortlicher Hochschullehrer: Prof. Dr. K. Mannheim
Betreuer: Dr. F. Pröbst
Abstract
In my diploma thesis, the light yield of zinc tungstate, which is a new possible detector material for the CRESST experiment (Cryogenic Rare Event Search with Superconducting Thermometers), is investigated.
The CRESST experiment aims to directly detect Dark Matter particles in the form of WIMPs (Weakly Interacting Massive Particle) via their elastic scattering o nuclei with cryogenic detectors.
CRESST uses a modular detector, and each module consists of two types of detectors operating as cryogenic calorimeters. The rst is a scintillating crystal of calcium tungstate measuring the energy deposited by a traversing particle. The second detector measures the light emitted by the scintillating crystal. Hereby, the amount of emitted light depends on the interacting particle and allows therefore a distinction between background and possible WIMP signal.
Zinc tungstate seems to be a promising alternative to calcium tungstate as absorber material because it can be produced with lower radioactive contamination and it provides a good scintillating eciency. One detector module with a zinc tungstate crystal had been mounted in the last run of the CRESST experiment. However, while analysing the data collected from the zinc tungstate detector module, events which present a reduced light yield, have been observed.
A reduced light yield may cause a misinterpretation of background like electrons and alpha particles as possible WIMP signal. Therefore, the origin of these anomalies has to be investigated in order to nd a way to dispose them which is the aim of this diploma thesis.
The working hypothesis is that the reduced light yield is caused by the performed surface treatments on the crystal. Therefore, one zinc tungstate crystal without any surface treat- ment and one treated with hydrochloride acid were investigated in the local cryostat at the Max-Planck-Institute for Physics in Munich. In order to obtain a good estimation of the local neutron rate, a calcium tungstate crystal was also measured in the same experimental layout.
Already after a short measurement period, the measurements were able to reproduce the anomalies observed in the last run of the CRESST experiment. While the zinc tungstate crystal whose surface was not treated, provided a largest amount of events with reduced light yield, the second zinc tungstate crystal, treated with hydrochloride acid, presented no anomalies.
In general, the developed experimental setup for these measurements allows the investi- gation of crystals which may be promising alternatives to the calcium tungstate.
The rst chapter gives a short introduction of Dark Matter. Hereby, the focus is on
the main properties of zinc tungstate relevant for Dark Matter search and closes with
the presentation of anomalies observed in the last run of the CRESST experiment. The
complete experimental layout used for the measurements as well as the analysis of the
collected data are described in the fourth chapter. The diploma thesis concludes with the
fth chapter containing a discussion of the results and the outlook for future measurements.
Zusammenfassung
Das Thema meiner Diplomarbeit ist die Untersuchung der Szintillationseigenschaften von Zinkwolframatkristallen, da Zinkwolframat als Absorbermaterial der Detektoren des CRESST- Experimentes (Cryogenic Rare Event Search with Superconducting Thermometers) in Fra- ge kommen.
Das Ziel des CRESST Experimentes ist der direkte Nachweis von schwach wechselwir- kenden massiven Teilchen (WIMPs) durch elastische Streuung an Atomkernen. WIMPs stellen einen vielversprechenden Kandidat als Bestandteil der Dunkelmaterie dar.
Die CRESST Detektormodule bestehen aus zwei Arten von kryogenen Detektoren. Der erste ist ein szintillierender Kristall aus Kalziumwolframat. Hier wird die von einem durch- iegenden Teilchen abgegebene Energie detektiert. Das emittierte Licht des Kristalls wird durch den zweiten Detektor gemessen. Dabei ist die Menge des emittierten Lichtes abhän- gig von der wechselwirkenden Teilchenart und ermöglicht die Unterscheidung von Unter- grundereignissen und einem möglichen Signal der Dunkelmaterie.
Zinkwolframat scheint eine vielversprechende Alternative zu Kalziumwolframat als Ab- sorbermaterial zu sein, da dieses mit einer sehr geringen Konzentration radioaktiver Ver- unreinigungen hergestellt werden kann und eine gute Lichtezienz aufweist. Aus diesem Grund ist ein Detektormodul mit einem Zinkwolframatkristall in der letzten Messung des CRESST Experimentes getestet worden. Die Analyse der mit dem Zinkwolframat-Absorber gesammelten Daten zeigte für einen Teil der Ereignisse ein verringertes Szintillationssignal.
Ein verringertes Szintillationssignal birgt die Gefahr, dass beispielsweise von Elektronen oder Alpha-Teilchen verursachte Untergrundereignisse als mögliches WIMP Signal fehl- interpretiert werden könnten. Hier muss die Ursache der Anomalien verstanden werden um einen Weg zu nden, diese zu beseitigen. Diese Untersuchung ist Gegenstand meiner Diplomarbeit.
Die Arbeitshypothese besteht darin, dass das reduzierte Szintillationssignal durch die Oberächenbehandlung des Kristalles verursacht worden ist. Deshalb sind in einem Kryo- staten des Max-Planck-Institutes in München zwei Zinkwolframatkristalle in einem spezi- ellen Messaufbau verglichen worden. Während der erste Kristall unbehandelt war, war der zweite mit Salzsäure behandelt worden. Zu Vergleichszwecken ist im selben experimentellen Aufbau auch ein Kalziumwolframatkristall vermessen worden.
In den Messungen zeigte sich für den unbehandelten Zinkwolframatkristall bereits bei kurzer Messzeit eine hohe Anzahl an Ereignissen mit verringertem Szintillationssignal. Der zweite Zinkwolframatkristall, der mit Salzsäure behandelt worden ist, wies keine Ereignisse mit verringertem Szintillationssignal auf.
Der im Rahmen dieser Arbeit entwickelte experimentelle Aufbau bietet die Möglichkeit,
auch weitere neue Absorbermaterialien hinsichtlich etwaiger Oberächeneekte zu unter-
direkten Nachweises von WIMPs. Das CRESST-Experiment, das ihm zugrundeliegende
Messprinzip und die in diesem Experiment verwendeten Detektormodule werden im zwei-
ten Kapitel vorgestellt. Das dritte Kapitel beschreibt die Eigenschaften von Zinkwolfra-
matkristallen, welche relevant für die Suche nach der Dunkelmaterie sind, und zeigt die
Problematik der beobachteten Anomalien. Der in der vorliegenden Arbeit verwendete Mes-
saufbau sowie die Analyse der gesammelten Daten werden im vierten Kapitel erläutert. Im
fünften Kapitel werden die Ergebnisse und die daraus resultierenden Schluÿfolgerungen
diskutiert.
Contents
1. Introduction 1
1.1. Dark Matter . . . . 1
1.1.1. Evidence for Dark Matter . . . . 1
1.1.2. Candidates of Dark Matter . . . . 4
1.2. Detection of WIMPs . . . . 6
2. CRESST-Experiment 9 2.1. Experimental Layout . . . . 9
2.1.1. Sources of Background and their Passive Reduction . . . . 9
2.1.2. Cryostat . . . . 12
2.2. CRESST Detectors . . . . 12
2.2.1. Principle of Measurement . . . . 13
2.2.2. Signal Evolution . . . . 14
2.2.3. Phonon Detector . . . . 16
2.2.4. Light Detector . . . . 18
2.2.5. Detector Module and Active Background Discrimination . . . . 19
2.3. Electronics and Data Acquisition . . . . 22
3. Zinc Tungstate Detector Module 25 3.1. Properties of Zinc Tungstate . . . . 25
3.1.1. Radiopurity . . . . 26
3.1.2. Scintillation Properties . . . . 26
3.1.3. Optical Properties . . . . 29
3.2. Observed Anomalies . . . . 30
4. Study of Anomalies in a Zinc Tungstate Detector Module 33 4.1. Experimental Layout . . . . 33
4.1.1. Cryostat in Munich . . . . 33
4.1.2. Detector Module . . . . 34
4.2. Measurement . . . . 36
4.2.1. Transition Curves . . . . 37
4.2.2. Pulse Measurement . . . . 39
4.3. Data Analysis . . . . 40
4.3.1. Pulse Parameters . . . . 41
4.3.2. Template Fit . . . . 42
4.3.3. Cuts . . . . 46
4.3.4. Energy Calibration . . . . 51
4.4. Experimental Results . . . . 53
4.4.1. Energy Spectrum . . . . 53
4.4.2. Data . . . . 55
4.4.3. Determination of the Exposure Time . . . . 57
4.4.4. Fit of Particle Bands . . . . 59
5. Discussion and Outlook 67 A. Decay Chain 71 A.1. Uranium (4n+2) decay chain . . . . 72
A.2. Thorium (4n) decay chain . . . . 73
B. Fit Parameters of the Particle Bands 75
Bibliography 85
1. Introduction
In 1933 F. Zwicky by measuring the velocity dispersion of galaxies in the Coma cluster, found a discrepancy between the theoretical expected mass derived from the measured velocity and the observed luminous mass. Hence, he was the rst one to express the idea of further non-luminous matter - the so-called Dark Matter, which is not detectable by the emission, reection or absorption of electromagnetic radiation.
Since then, more evidence on various scales, from single galaxies to galaxy clusters, has been discovered leading to a better understanding of the composition of the universe.
Today the amount of Dark Matter in the universe has been determined to be 23 % [Sch08, Les04] of the total mass. The largest fraction of 73 % of the density of the universe is provided by so-called Dark Energy. However, its nature is still completely unknown.
Ordinary matter, mostly in the form of baryonic particles, contributes only 4 %.
Many models have been conceived to describe these particles that have not been detected directly so far. Also, a lot of experiments have been designed and constructed to detect these particles. Nowadays, the experiments are already highly sensitive, thus show promise for the discovery of Dark Matter. Until then, however, the true nature of Dark Matter remains still unsettled and poses a major challenge for research in astrophysics as well as particle physics.
1.1. Dark Matter
First, a very brief introduction is given to essential cosmological equations and correlations which is mostly based on [Les04, Lon08, Sch08]. Afterwards, evidence of Dark Matter on dierent scales is shortly presented.
There exists a variety of models on possible candidates for Dark Matter particles. Many of these models do not include only one kind of particle but are rather based on a com- position of various candidates, a small selection of which will be given in the last part of this section. More detailed information can be found in various books and articles like [Ber10, Lon08, BHS05].
1.1.1. Evidence for Dark Matter
Cosmological Framework
Today's cosmological theories are based on the assumption of a homogeneous and isotropic
universe, with no privileged point of origin, over scales greater than 100 Mpc. The theo-
retical framework of the dynamics of the universe, with gravitation as the driving force is
established by the Standard Cosmological Model, which is itself based on Einstein's theory of General Relativity. A solution of the General Relativity is obtained by the Friedmann- Lemâitre metric. Therein, a path element of the curved space-time is given by
dl
2= c
2dt
2− a
2(t)
dr
21 − kr
2+ r
2dθ
2+ sin
2θdφ
2(1.1) where a(t) is the cosmological scale-factor describing the size of the universe and k is a constant number whose value refers to spatial curvature
1. The expansion rate of the scale factor is described by the Hubble parameter H leading directly to the Friedmann equation with the form
H
2(t) = a(t) ˙
a(t)
2= 8πG
3 (ρ
R+ ρ
M) − kc
2a
2(t) + Λc
23 . (1.2)
Here, G is Newton's gravitational constant and ρ
Ras well as ρ
Mare the density of radiation and matter respectively. The "cosmological constant" Λ is dened by Einstein as
Λ = 8πGρ
Λc
2(1.3)
where ρ
Λis the density of the Dark Energy. The present value of the Hubble parameter is noted as H
0≡ H(t = t
0) with a value of H
0= (73.9 ± 2.9) km s
−1Mpc
−1[CT
+12].
In order to obtain the present density contributions in the universe, one uses the Friedmann equation evaluated at present time and divided by H
02to obtain
1 = 8πG
3H
02(ρ
R0+ ρ
M0) − kc
2a
20H
02+ Λc
23H
02. (1.4)
Assuming a at universe ( k = 0 ), a condition that lies between an eternal expansion and a recollapse of the universe, the critical density is the characteristic density of the present universe and is dened as
ρ
cr:= 3H
028πG . (1.5)
From this follows the denition of the dimensionless parameter Ω
Xwith X = R, M, k, Λ of the present density of each species as
Ω
X:= ρ
Xρ
cr. (1.6)
By combining the above denitions in eq. 1.5 and 1.6 with today's Friedmann eq. 1.4, one obtains
1 = Ω
R+ Ω
M− Ω
k+ Ω
Λ. (1.7)
1
k > 0 → closed universe
k = 0 → at universe
k < 0 → open universe
1.1. Dark Matter
Ω
Mis the contribution of all the matter in the universe
Ω
M= Ω
Dark Matter+ Ω
baryons+ Ω
neutrinos+ . . . . (1.8) In the following sections, evidence for the existence of a so far unknown contribution, the so-called Dark Matter is presented.
Clusters of Galaxies
As already mentioned, the rst evidence for the existence of Dark Matter was presented by F. Zwicky in 1933 [Zwi33] from observations of the Coma cluster. The total mass of the Coma cluster can be derived from the virial theorem in which the velocity is obtained from the measurement of the redshift of spectral lines. Zwicky found that the amount of the mass resulting from the virial theorem is 400 times larger than the observed luminous mass. In fact, most of the clusters surveyed to this day show a similar discrepancy. As the mass-to-light ratio is typically between 50 to 100, there has to be non-luminous mass.
Rotation Curves of Spiral Galaxies
On the scale of individual galaxies, further evidence is found in their rotation curves which describe the orbital velocity v
rotof the galactic disk as a function of its radius r (see g.
1.1). In a rotating galaxy where gravitation is the driving force, one would expect from Newtonian mechanics
mv
rot2r = GM (r)m
r
2(1.9)
→ v
rot=
r GM (r)
r (1.10)
where M (r) = 4π R
r0
ρ(r
0)r
02dr
0assuming a spherical symmetric matter density ρ(r) . If the mass, however, is concentrated within the optical visible disk r
disk, the orbital velocity should have the following properties: v
rot(r) ∝
1/
√rfor r > r
diskand v
rot→ 0 for r → ∞ .
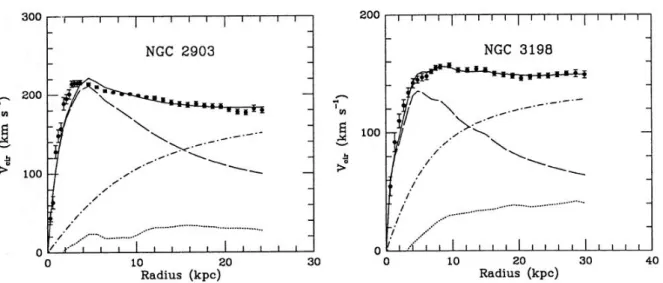
However, from observations of the emission of spectral lines, in particular of the 21 cm- hydrogen line, one derives a dierent behaviour. The orbital velocity rises roughly linearly with the radius, from centre to the outwards, which corresponds to a mass density approx- imately constant in the centre of the galaxy. At some point, however, the orbital velocity reaches a constant value. The Milky Way has, for instance, a value of v
rotof approximately 220 km s
−1at a radius of ∼ 5 kpc [KDKH07] and this value stays constant out to largest measured radii.
The observed behaviour of v
rotthus implies the existence of additional matter in the
form of a halo with M (r) ∝ r which is not luminous.
Figure 1.1.: Rotation curves of the galaxies NGC 2903 and NGC 3198, as measured, are overlayed by best tted curves whose components are also presented separately: The dashed curves stand for the visible component (mass), the dotted curves for the gas and the dash- dot curves for the halo of Dark Matter. The latter is responsible for the attening of the velocity for larger radii. Picture taken from [BBS91].
1.1.2. Candidates of Dark Matter
In order to verify if Dark Matter is normal matter, i.e. baryonic matter that could be for instance in the form of MACHOs (Massive Compact Halo Objects), the individual contribution in eq. 1.7 and 1.8 of each component has to be evaluated.
By analysing the universal abundances of light elements, as created during the primordial nucleosynthesis according to the standard Big Bang model of cosmology, and also by com- paring the height of prominent peaks in the multipole expansion of acoustic temperature uctuations of the Cosmic Microwave Background, one obtains the following components at the present time [KSD
+11, Sch08]:
1 + Ω
k= Ω
R+ Ω
baryons+ Ω
Dark Matter+ Ω
Λ' 1 (1.11)
Ω
R' 8.57 · 10
−5(1.12)
Ω
baryons= 0.0458 ± 0.0016 (1.13)
Ω
Dark Matter= 0.229 ± 0.015 (1.14)
Ω
Λ= 0.725 ± 0.016. (1.15)
(1.16)
This analysis provides a strong constraint ( Ω
baryons= 0.0458 ± 0.0016 ) on the total amount
of baryonic matter in the universe. Therefore, Dark Matter is supposed to be predominately
non-baryonic. Before going into details, some of the basic constraints for Dark Matter
candidates need to be considered.
1.1. Dark Matter First of all, Dark Matter candidates need to be stable on cosmological time scales. Fur- thermore, such candidates need to be electrically neutral in accordance with the absence of emission or absorption of electromagnetic radiation. As no direct interaction with ordinary matter could be detected so far, they also have to be colour neutral. Hence, there only remain the gravitational and the weak force as possible kind of interaction.
Most of the Dark Matter has to be non-relativistic at the time of structure formation, the so-called Cold Dark Matter (CDM), in order to allow for the creation of structures like those that are observed today [Les04].
Neutrinos
Neutrinos are the only Dark Matter candidates already known in the Standard Model of particle physics, wherein they are considered massless. Various extensions of the Standard Model account for the fact that neutrinos were demonstrated experimentally to be massive.
Several experiments have been established to measure the rest mass of the neutrino. The best laboratory result so far is obtained from the Troitsk and Mainz tritium β -decay ex- periments, constraining the neutrino mass m
νto maximal 2.05 eV/c
2at 95 % C.L. [Wei08].
This mass limit applies to all three avours since the mass dierence among them is maxi- mal of the order ∆m
2AT M≈ O(10
−3eV
2) [MSTV04]. By calculating the cosmic abundance of neutrinos in dependence of their mass, one obtains [BHS05]
Ω
νh
2=
3
X
i=1
m
i93 eV (1.17)
Ω
νh
2. 0.07 (1.18)
with the sum covering all three neutrino avours. Hence, the total neutrino relic density is estimated to be Ω
ν. 0.13 by taking the above mentioned mass into account and con- sidering that h =
H0/
100km s
−1Mpc
−1. Therefore, their mass density cannot account for the amount of Dark Matter in the present universe. Nevertheless, their contribution may still not be negligible and constitute a subdominant component of Dark Matter.
Axion
Axions were originally introduced to solve the 'strong CP problem' of QCD in the Stan-
dard Model of particle physics as very weakly interacting pseudoscalar bosons. These
axions constitute one of the lightest candidates of Dark Matter having a maximal mass
of 3 · 10
−3eV [Ber10]. Despite their low mass, they are non-relativistic because they never
acquired thermal equilibrium with the rest of the universe. Their relic density in the uni-
verse is still not determined, even their existence is still not proven. However, there are
scenarios, complying with the constraints on Dark Matter candidates, a satisfaction of
present constraints can be achieved [DvB09].
WIMPs
Until the measurements of the Z
0width at CERN, which established the existence of only three neutrino families, it had been hoped that there is a fourth more massive avour of the neutrino which could account for the Dark Matter density in the universe.
Consequently, a generic type of particle - the so-called Weakly Interacting Massive Par- ticle or WIMP - has been introduced as e.g. a supersymmetric extension of the Standard Model: The Standard Model particles and their supersymmetric partners dier by R - parity, dened as
R = (−1)
3B+L+2s(1.19)
where B, L and s are baryon number, lepton number and spin, respectively. Since R -parity is assumed to be conserved in this model, supersymmetric particles can only decay into lighter supersymmetric particles, thereby implying stability of the lightest supersymmetric particle (LSP). That is why the LSP is a promising Dark Matter candidate.
1.2. Detection of WIMPs
Apart from the neutrino, none of the possible Dark Matter candidates have yet been detected. As the WIMP is one of the most promising candidates the following section will concentrate on this kind of particle.
The following section gives a short overview over theoretical boundary conditions for direct detection experiments while indirect detection is only mentioned briey. The infor- mation below are, if not mentioned otherwise, based on [DFS98, Ber10, BHS05].
Direct search of WIMPs is based on the assumption that the Milky Way comprises a halo of Dark Matter where the Earth passes through. Accordingly, the resulting WIMP ux at the position of the Earth should be of the order 10
5(100 GeV/m
χ)cm
−2s
−1[Ber10].
Therefore, direct detection experiments look for the interaction of WIMPs with ordinary matter and aim to record the recoil energy transferred to nuclei by WIMPs scattering o.
Theoretical Boundary Conditions for Direct Detection
The direct detection rate is dependent on the WIMP matter density ρ
χand on the velocity distribution f (v) , at the position of the Sun r in the Milky Way.
The ux of WIMPs φ
χwith the mass m
χand the average velocity hvi φ
χ= ρ
χm
χhvi (1.20)
passes through the detector with the target mass M
targetand the number of target nuclei, given by
N = Detector mass
Nuclear mass = M
targetm
N. (1.21)
1.2. Detection of WIMPs
Hence, the total interaction rate R is obtained by R = X
i
N
iφ
χσ
i(v) = X
i
M
targetm
iρ
χm
χhvihσ
i(v)i (1.22) as a function of the WIMP-nucleus scattering cross section hσ
ii of each nuclear species i averaged over the relative WIMP velocity v with respect to the detector.
As a rst estimate, one can assume the average velocity of the WIMPs to be below their galactic escape velocity of v
escape= (550 ± 100) km s
−1[LT90]. Because of this velocity limit, the performed calculation is in the non-relativistic limit. Therefore, the recoil energy E
Rof the i
thnuclear species which is transferred while scattering o the nucleus, can be easily calculated to be
E
Ri= µ
2iχv
2(1 − cos θ) m
i. (1.23)
with the scattering angle θ in the centre of mass frame and the reduced mass µ
iχof the WIMP-nucleus system. Therefore, under the assumption of v < v
escape≈ 2 · 10
−3c the maximal possible recoil energy is
E (θ = π, m
χ= m
i)
R,max< m
χ10
−6c
2(1.24)
<
m
χ GeV/
c2keV. (1.25)
With a projected WIMP mass of m
χ≈ 100 GeV/c
2, the maximal recoil energy is of the order O(10 keV) which poses a challenge for its detection requiring very sensitive detectors.
Furthermore, the event rate is expected to be R . 0.1 kg
−1d
−1[Sch10] with an annual modulation of 7 % [BHS05] due to the annual variation of the Earth's velocity around the Sun. For this reason, such direct detection experiments need to be performed in a low background environment. The approach followed by CRESST is described in detail in chapter 2.
The estimate done so far is very rough. In order to obtain a precise estimation of the detection rate, an accurate and detailed model of the galactic halo would be required to get a valid distribution function of WIMPs. This exact information is not yet available, so approximations are necessary. The standard and most simple model of the dark galactic halo is an isothermal sphere. The basic assumptions in this model are spherical symmetry and thermal equilibrium. Herein, the distribution function is separable into
DF (~ r, ~ v ) = ρ
χ(r) · f(v) (1.26) where ρ
χ(r) is the matter density distribution
2and f (v) the Maxwell-Boltzmann velocity distribution.
The dierential cross section for the WIMP-nucleus elastic scattering
ddEσiRi
(v, E
Ri) can be separated into a spin-dependent and a spin-independent (scalar) fraction. As the nuclear
2
Note that ρ
χ(r = r
) ≡ ρ
χspin of the elements (W, Ca, O, Zn) used as target material in CRESST is zero, the spin- dependent contribution can be neglected. Therefore, the dierential cross section is given by the spin-independent contribution in the form of
d σ
id E
Ri(v, E
Ri)
SI
∝ 2m
iA
2πv
2. (1.27)
The full equation and its derivation can be found in [Ber10]. Note in eq. 1.27 that the spin- independent dierential cross section increases with the square of the number of nucleons ( A
2).
The above model exclusively considers elastic WIMP scattering o nuclei. Note that inelastic scattering could exist as well. On the one hand, the WIMP could interact with the orbital electrons leading to an excitation of the electron or to an ionization of the target.
On the other hand, it could interact with the target nuclei itself resulting in an excitation to a higher nuclear state. The latter produces a signal of a nuclear recoil followed by the emission of a photon emitted during relaxation.
Indirect Detection
Indirect detection aims to measure products of WIMP annihilations in the galactic halo.
as e.g. photons, antiprotons, or positrons. These signals have a stronger dependence on the matter density of the WIMPs, but are mainly independent on details of the velocity distribution because annihilating WIMPs are almost at rest.
Among the secondary particles, photons are particularly promising, as their direction of propagation points to their origin. For their detection both space-based and ground-based telescopes have been constructed.
Even though charged particles, as protons and positrons, are inuenced by magnetic elds, they can provide valuable data for the Dark Matter search, as well.
Regions of high Dark Matter density are particularly suitable for the indirect search.
These are, among others, the galactic centre, but also the Sun and the Earth itself, as
they may gravitationally trap Dark Matter particles which loose energy while scattering
o nuclei.
2. CRESST-Experiment
The aim of the CRESST experiment (Cryogenic Rare Event Search with Superconducting Thermometers) is the direct detection of WIMP particles by measuring their interaction with the target material of cryogenic detectors.
Due to the low event rate discussed in the previous chapter, a low background envi- ronment is essential. The CRESST experiment is therefore located in the underground facility of the Laboratori Nazionali del Gran Sasso, in central Italy. Additional suppres- sion of background is required which is achieved via radiation absorbing shields and by active discrimination: Coincident measurement of two complementary detectors allows to distinguish between background and possible WIMP signals.
2.1. Experimental Layout
The CRESST experiment is based on cryogenic detectors. To reach their operational tem- peratures between 10 and 20 mK, a
3He/
4He dilution refrigerator is used. The experiment is surrounded by shields of dierent materials (see in g. 2.1) in order to passively reduce background.
The background is caused by cosmic rays, environmental radioactivity and impurities within the experimental unit. In the following section, the individual inuence of these background sources on the CRESST experiment and the corresponding shielding are dis- cussed. Besides this passive reduction, background is also actively reduced as described in section 2.2.5.
2.1.1. Sources of Background and their Passive Reduction
Muons
The most relevant component of charged particles at sea level which emerge from inter- actions of primary cosmic rays in the atmosphere are muons. They produce background in the detector through dierent processes. Either they may pass directly through the detector or secondary particles as electrons, photons and neutrons may be produced by interactions of muons with ambient matter. The rst step to diminish the muon ux is the location of the experiment. The CRESST experiment is, as mentioned above, located in an underground facility placed under an average burden of 1400 m of rock. This reduces the muon ux by about six orders of magnitude to O(10
−8cm
−2s
−1sr
−1) [A
+95].
However, the remaining muons still introduce unwanted background and therefore, a
muon veto covering 98.7 % of the surface of the detector volume has been installed. It
Liquid nitrogen
Liquid helium
SQUIDs
Cryostat
Water
Internal lead
Cold nger
Radon box
Thermal shield
Detector modules
External lead
External copper
muon-veto
Polyethylene
Figure 2.1.: Schematic drawing of the CRESST experimental setup. Picture taken from
[Kie12]
2.1. Experimental Layout
Isotope
238U
232Th
40K
γ activity (Bq kg
−1) 11.7 ± 3.9 14.8 ± 2.8 62 ± 14
Table 2.1.: The γ activity of various natural radioactive isotopes measured in Hall A of the Gran Sasso Laboratory, with a 3 diameter NaI(T1) detector, by [HBB
+11]
comprises 20 plastic scintillating panels, each one read out by a photomultiplier. Once a signal is measured in the muon veto, signals in the CRESST detectors, occurring in coincidence, are discarded.
Natural Radioactivity
The rock surrounding the Gran Sasso Laboratory contains primordial radionuclides, such as
238U,
232Th and
40K. A summary of the decay products of the
238U and
232Th chains are given in appendix A.
One decay product of the
238U chain is
222Rn. This noble gas may diuse out of the rock and decays in several steps through the emission of α and β particles. The radon concentration is continuously monitored in the Gran Sasso Laboratory. In Hall A, where the CRESST experiment is located, it has a mean value of 64 Bq m
−3[Lau07]. In order to prevent this noble gas from entering inside the shielding, a radon box, consisting of an air tight container, has been installed inside the muon veto. This box is continually ushed with evaporated liquid nitrogen and kept at a minor overpressure.
Products arising from the natural decay chains are photons and electrons. The activities in Hall A of various γ emitting isotopes are summarised in table 2.1. This background is passively reduced by shielding the experimental unit with materials with particularly dense, high-Z materials. Therefore, the detector modules of the CRESST experiment are surrounded by a 20 cm thick lead shield with a weight of 24 t. However, lead has a relatively high intrinsic radioactivity especially from its isotope
210Pb. Its radioactivity is suppressed by a 14 cm thick and 10 t massive copper shield which has been installed between the detector modules and the lead shield. Copper can be produced with minimal radioactive contamination that is why it is used for most structures within the experimental unit.
Nevertheless, contaminations inside the experimental unit especially from the crystals are still present. Active background discrimination (see section 2.2.5), however, allows to drastically diminish their interference with a possible WIMP signal.
Neutrons
Neutrons are of particular relevance, as they may scatter o nuclei of the detectors' absorber material with no or only very little ionisation, thereby producing signals as those expected for WIMPs.
Neutrons of O (1 MeV) are mainly generated in ( α , n) reactions in light elements and in
the spontaneous ssion of mainly
238U. Moreover, neutrons of O (10 MeV) may be produced
by muon interaction in the rock or the shielding materials. The neutron ux in the energy range of 0-10 MeV is (3.81 ± 0.11)10
−6s
−1cm
−2[HBB
+11] measured in Hall A of the Gran Sasso Underground Laboratory.
In order to prevent non-thermal neutrons from entering the detector unit, a 50 cm shield out of polyethylene has been installed. As this material has a high content of hydrogen atoms, neutrons may get thermalized O (1 meV) rapidly by multiple scattering o hydrogen nuclei. Neutrons with this low energy are no longer detectable by the detectors.
2.1.2. Cryostat
The CRESST cryostat is a dilution refrigerator whose principle of operation can be found in [Pob07]. Since the dilution unit is commercially purchased, its material is not carefully chosen and treated for rare event search. In order to suppress background caused by this cryostat, the cooling power of its mixing chamber is transferred via a 1.3 m long copper rod to the so-called carousel where 33 detector modules can be mounted.
Mechanical vibrations are reduced as the complete cryostat including the carousel and the detectors is placed on air dampers having no physical contact to the shields.
The whole experimental setup including the shields is located in a Faraday cage to protect the most sensitive part of the readout electronics from electromagnetic interferences.
2.2. CRESST Detectors
As mentioned in the previous section, despite the shielding and the use of radiopure ma- terials, there is still radioactive contamination inside the experimental volume. Therefore, it is of utmost importance to be able to actively discriminate possible WIMP interactions from radioactive background.
By using scintillating crystals as absorber material, the energy deposited by a particle interaction in the crystal converts not only into phonons but also a small fraction of the deposited energy leaves the crystal in the form of scintillation light. As the amount of scintillation light depends strongly on the type of interacting particle active background discrimination becomes possible.
In order to measure both, the phonon signal and the emitted scintillation light, a CRESST detector module consists of two dierent detectors. The rst detector essen- tially consists of the scintillating absorber crystal and the sensor deposited thereon for reading out the phonon signal generated by particle interactions. Accordingly, it is gener- ally called phonon detector. The scintillation light caused by such particle interactions is measured by a dedicated separate detector, the so-called light detector.
First, the principle of measurement of the CRESST detectors will be illustrated including
a theoretical model of the signal evolution, followed by a more detailed description of each
of the two detectors in a module. In the last part, the detector module and its functionality
as a whole, as well as, the method of actively discriminating background are described.
2.2. CRESST Detectors
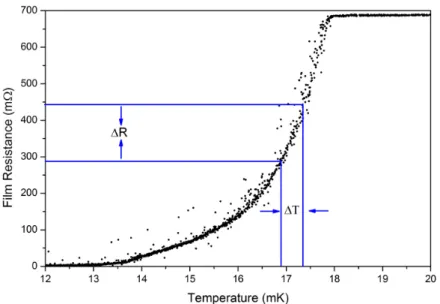
Figure 2.2.: Mode of operation of a SPT. Even a small temperature rise leads to a measur- able increase of the lm resistance.
2.2.1. Principle of Measurement
The CRESST detectors are operated as cryogenic calorimeters. Under the most simple assumptions, a deposition of energy ∆E in the target material of a detector causes a temperature rise ∆T given by
∆T = ∆E
C . (2.1)
Herein, C is the heat capacity of the absorber. A small C of the detector material leads to a larger temperature rise for a given energy deposition. Since the heat capacity of dielectric materials is dominated by the phonon system and at low temperatures proportional to (
T/
ΘD)
3with Θ
Dbeing the Debye temperature, the temperature rise estimated to be in the order of O(µK) at an operating temperature of O(10 mK) for a possible WIMP interaction and is thus measurable with sensitive thermometers.
In the CRESST experiment, Superconducting Phase Transition thermometers (SPT) are used. They operate within the transition of the superconducting state to the normal conducting state. Here, a small temperature rise ∆T leads to a relatively large increase of the resistance ∆R which is measured by the readout electronics, as described in section 2.3. A typical transition curve is shown in g. 2.2.
The SPT is a thin lm of tungsten, usually 200 nm thick, evaporated onto the surface
of the absorber. The transition temperatures of these lms are commonly between 10 and
20 mK, depending strongly on the conditions of the evaporation process.
2.2.2. Signal Evolution
The rst estimation for the temperature rise after an energy deposition that was given in eq. 2.1 is extremely simplied. A more detailed picture of the physical processes behind the pulse formation following a particle interaction is shortly presented in this section. A more detailed description can be found in [PFC
+95].
An energy deposition in the absorber leads to the creation of high frequency phonons. If the energy deposition is mainly in the electron branch, highly excited electrons arise which after transferring their energy to other electrons and exciting electron-hole pairs, generate optical phonons. These phonons decay within 100 ps into acoustical phonons of about half the Debye frequency.
If the energy deposition is rather in the nuclear branch, acoustical phonons of a contin- uous energy spectrum up to the Debye frequency are excited. In general, in both kind of interaction high frequency phonons which are often referred to as non-thermal phonons, are created only diering in their energy spectrum. The strong frequency-dependent de- cay rate of Γ
d∝ ν
5results in a fast initial decay of the average phonon frequency due to lattice anharmonicities followed by an almost constant distribution for a few milliseconds.
During this time period, these non-thermal phonons spread ballistically throughout the whole absorber and ll it uniformly after a few reections at the surfaces. When one of these non-thermal phonons reaches the thermometer, it is eciently absorbed by the free electrons of the metal lm. The heating of the electron system in the thermometer is caused by the strong interaction among the electrons which rapidly share and thermalize the phonon energy.
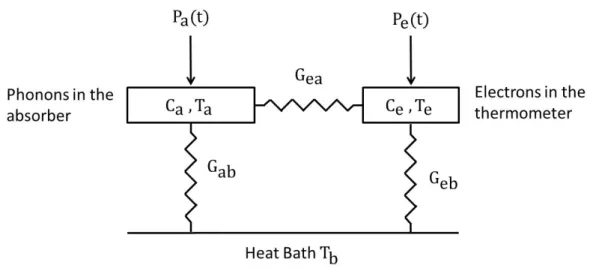
In order to obtain a quantitative characterization of the pulse shape, the thermal model of the detector shown in g. 2.3 is assumed. Since the heat capacity of the electron system of a dielectric as well as the heat capacity of the phonon system of a metal are negligible in the mK temperature range, each of the low temperature detectors can be split into just two subsystems which are the electron system of the thermometer characterized by its temperature T
eand its heat capacity C
eand the phonon system of the absorber described in the same manner by T
aand C
a. The two subsystems are coupled to each other and to the heat bath respectively. The heat bath is characterized by its temperature T
b.
Following an energy deposition in the absorber, the electron system of the thermometer experiences a time-dependent power input P
e(t) because of the absorption of the non- thermal phonons. Additionally, non-thermal phonons decay via inelastic scattering in the absorber leading to the direct power input P
a(t) in the phonon system. Considering ε as the fraction of non-thermal phonons which is absorbed in the thermometer and (1 − ε) as the one thermalized in the absorber, the time dependent power inputs are
P
e(t) = Θ(t)ε ∆E
τ
ne
−τnt(2.2)
P
a(t) = Θ(t)(1 − ε) ∆E
τ
ne
−τnt. (2.3)
Here, Θ(t) is the Heaviside step function determining the time t of the energy deposi-
2.2. CRESST Detectors
Figure 2.3.: A schematic illustration of the thermal model of a detector. Each detector is represented in two subsystems - the phonons in the absorber and the electrons in the thermometer. Both are characterized by their temperatures T
aand T
eas well as their heat capacities C
aand C
e. The thermal coupling between the subsystems and the heat bath is parameterized by G
ea, G
aband G
eb. The temperature of the heat bath is given by T
b.
tion ∆E . τ
nis the life time of the non-thermal phonons which can be calculated from thermalization time constants in the thermometer τ
f ilmand in the absorber τ
absorberas
τ
n= 1
τ
f ilm+ 1 τ
absorber −1. (2.4)
These two time constants also determine the fraction ε of phonons which is thermalized in the thermometer as
ε = τ
absorberτ
absorber+ τ
f ilm. (2.5)
The above mentioned power inputs in eq. 2.2 and 2.3 lead to an increase of the temper- atures in the absorber and the thermometer respectively. However, the coupling between the absorber and the thermometer as well as between each of the two subsystems and the heat bath causes a transfer of energy. These processes lead to the following system of dierential equations dening the temperatures of the thermometer T
eand of the absorber T
a:
C
ed T
ed t = P
e(t) − (T
e− T
a)G
ea− (T
e− T
b)G
eb(2.6) C
ad T
ad t = P
a(t) − (T
a− T
e)G
ea− (T
a− T
b)G
ab. (2.7)
C
eand C
aare the heat capacities of the thermometer and the absorber respectively. Before
the deposition of energy by e.g. a particle interaction, the temperatures T
eand T
aare equal
to the constant temperature of the heat bath T
b. Hence, T
e(t = 0) = T
a(t = 0) = T
b.
The solution of the system of dierential equations 2.6 and 2.7 is
∆T
e(t) ≡ T
e(t) − T
b= Θ(t) h A
ne
−τnt− e
−τint+ A
te
−τtt− e
−τnti
. (2.8) Here, τ
inis the intrinsic thermal relaxation time of the thermometer and τ
tis the thermal relaxation time of the absorber which can be written in the form
τ
in= 2 a + √
a
2− 4b τ
t= 2
a − √
a
2− 4b (2.9)
a = G
ea+ G
ebC
e+ G
ea+ G
abC
ab = G
eaG
eb+ G
eaG
ab+ G
ebG
abC
aC
e. (2.10)
The solution of 2.8 comprises two parts: The rst one is generally referred to as non- thermal component which is due to the direct absorption of non-thermal phonons in the thermometer, with the amplitude A
nin the form
A
n= ∆E τ
n1
τin
−
GCaba
1 τt−
τ1in
1 τin
−
τ1n
1 τt
−
GCaba
G
eb−
CCea
G
ab− ε C
e!
. (2.11)
The second term is referred to as thermal component which originates from the increase of the temperature in the absorber as measured by the thermometer, with the amplitude A
tgiven by
A
t= ∆E τ
n1 τt
−
GCaba
1 τt−
τ1in
1 τt
−
τ1n
1
τin
−
GCaba
G
eb−
CCea
G
ab− ε C
e!
. (2.12)
Two dierent modes of operation can be distinguished. If τ
nτ
in, the amplitude of the non-thermal component measures the total amount of energy of high frequency phonons absorbed in the thermometer. A
nis approximately given by A
n≈ −ε
∆ECe
. The heat capacity of the electron system denes the amplitude A
nfor a given energy deposition which is why this way of operation is referred to as calorimetric. The time constant τ
ndenes the rise time of the non-thermal component whereas τ
indetermines its decay time.
In the case of τ
nτ
in, the pulse height is proportional to the power input. Here, the rise time of the non-thermal component is dened by τ
inand its decay time by τ
n. This mode is the so-called bolometric mode.
In the CRESST experiment, the phonon detector is operated in the bolometric mode whereas the light detector runs in the calorimetric mode.
2.2.3. Phonon Detector
The phonon detector is a scintillating crystal in the form of a cylinder with a height and diameter of 4 cm and a weight of about 300 g. The SPT is either directly evaporated onto the surface of the crystal or more recently onto a separate carrier with a size of (20×10×1) mm
3which is then glued onto the crystal. The latter method has the advantage that the scintillation eciency
1does not degrade due to the evaporation process of the
1
The scintillation eciency is the ratio of the emitted light of a scintillator to the deposited energy (see
in section 3.1.2).
2.2. CRESST Detectors
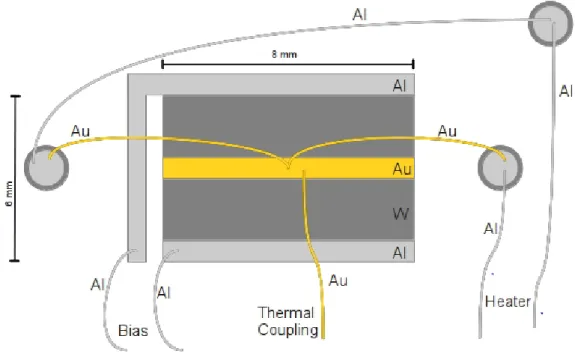
Figure 2.4.: Shown is a scheme of the lm structure of phonon detector. The SPT consists of a tungsten lm evaporated onto the surface of the scintillating crystal. The electrical connection between the tungsten lm and the readout circuit is provided by aluminium bond wires. Furthermore, a cross bonded gold wire is used as the heater to stabilize the lm at its operating point. An additional gold wire provides the thermal contact between the lm and the heat bath.
thermometer [Kie12].
In order for a crystal to be suitable for rare event search in a low background environment, certain criteria have to be fullled [MK06]: First, its intrinsic radioactive contamination must be as low as possible. Furthermore, the scintillation eciency should be high in the millikelvin temperature range. In order to avoid a reduction of the scintillation eciency at the crystal's surface, the crystal must be non-hygroscopic. Other relevant points are the costs and availability.
Since the spin-independent WIMP-nucleus cross section in eq. [1.27] is expected to rise with the square of the atomic number A , using heavier nuclei is advantageous.
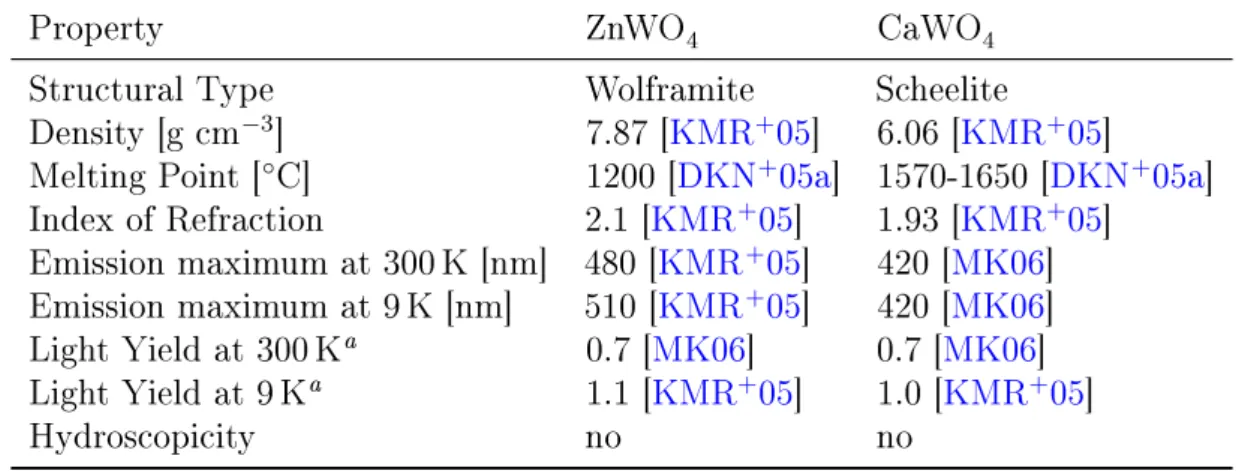
CRESST uses predominately calcium tungstate (CaWO
4) as target material which con- tains tungsten, a very heavy nucleus of A = 186 . More recently, a detector module with zinc tungstate (ZnWO
4) has been operated in the last run of the CRESST experiment.
ZnWO
4is a very promising candidate for a target material being the motivation for this work as will be discussed in chapter 3.
The SPT of a phonon detector shown in g. 2.4 consists of a lm of tungsten with a
thickness of 200 nm and an area of (6 × 8) mm
2evaporated onto a 200 nm thick layer of silicon dioxide which in turn is evaporated onto the surface of the scintillating absorber crystal (or of the carrier crystal). On the one hand, silicon dioxide acts as a diusion barrier that prevents impurities and also oxygen from the CaWO
4absorber crystal to spread into the lm. On the other hand, it turned out that tungsten lms deposited on thin lms of silicon dioxide reliably show a superconducting transition at about 20 mK.
A gold bond makes the thermal contact to the heat bath. Two aluminium pads evapo- rated onto the tungsten lm connect the SPT to the readout circuit.
The stabilization of the SPT at an operating point within the transition region is essential for providing a constant detector response. Therefore, a bonded gold wire of 25 µ m of diameter serves as heater. Circular aluminium pads provide for a connection to a heater circuit. The readout electronics and the heater circuit are briey explained in section 2.3.
CaWO
4has a high index of refraction of n = 1.93 [KMR
+05] leading to total internal reection of scintillation light on the crystal's surfaces at angles ≥ 31
◦. In a cylindrical crystal, considerable amount of scintillation light therefore may be trapped on closed tra- jectories inside the crystal. Roughening of the crystal's bottom surface at a roughness of about 10 µ m [Huf10] prevents the occurrence of such trajectories and allows the scintillation light to escape.
2.2.4. Light Detector
The photons emitted by the scintillating crystal are absorbed by the light absorbing mate- rial of the light detector. Here, they are transformed into phonons leading to a temperature rise which is detected by a SPT evaporated onto its surface.
Silicon-on-sapphire (SOS) wafers with a diameter of 40 mm and a thickness of about 0.46 mm are used as light absorbing substrate of the light detector. SOS wafers consists of sapphire (Al
2O
3) wafers with a silicon layer of 1 µ m thickness epitaxially grown onto their surface.
The layout of the SPT is shown in g. 2.5. In the case of the light detector, the tungsten lm has a signicantly smaller area of only (300 × 450) µm
2, thereby minimizing the heat capacity and increasing the sensitivity of the thermometer. An additional increase in sensitivity is achieved by providing the SPT with superconducting phonon collectors which do not contribute to the heat capacity of the SPT. Each of the two collectors is a 1 µ m thick aluminium lm with a size of (500 × 1000) µm
2, evaporated onto lateral areas of the tungsten lm, thereby providing an Al-W-bilayer. Due to the proximity eect, the transition temperature of this bilayer is close to the transition temperature of aluminium [Pet05]. Hence, it is superconducting at the operating temperature and its heat capacity is negligible.
After absorption of scintillation light, a thermal connection of the thermometer to the
heat bath in the form of a gold stripe and a gold bond wire provides the return to equilib-
rium. The heater is part of the gold stripe and stabilizes the thermometer at its operating
point.
2.2. CRESST Detectors
Figure 2.5.: Scheme of the SPT of the light detector. The SPT sensor consists of a tungsten lm and phonon collectors out of Al-W bilayers that also provide the connection to the readout circuit. After a temperature rise, the lm relaxes to the temperature of the heat bath via a gold stripe. The SPT is stabilized via a heater which forms part of the gold stripe.
The scintillation light measured in the light detector is essential for the active background discrimination described in the next section. Since only a small fraction of the energy deposited in the target crystal is converted into scintillation light and an even smaller fraction is transported to the thermometer of the light detector, the improvement of the performance and sensitivity of the light detector is of great importance and is the aim of several works as [Huf10] and [Tan11].
2.2.5. Detector Module and Active Background Discrimination
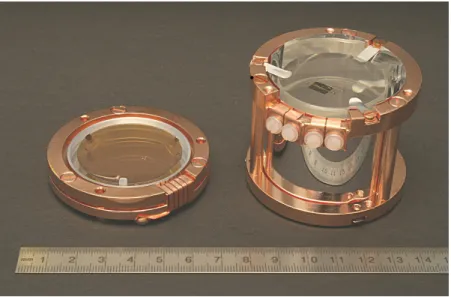
The phonon detector and the light detector are mounted such that the roughened surface of the crystal faces the light detector. Both are surrounded by a reective and scintillating housing. All together, they form a detector module, shown in g. 2.6 and 2.7.
A particle interaction in the scintillating crystal generally creates a response both in
the phonon detector and in the light detector. Since only a few percent of the total
amount of deposited energy is emitted as light, the phonon signal determines in a good
approximation the total deposited energy. The amount of light emitted by the scintillating
crystal depends on the nature of the interacting particle. Therefore, the measured light
signal allows an event-by-event distinction between particles of dierent nature referred to
as active background discrimination.
Figure 2.6.: A detector module comprises a scintillating absorber crystal with a SPT sensor evaporated onto its surface, as well as a light detector with another SPT sensor. A reective and scintillating housing surrounds the detectors. Both detectors are thermally connected to the heat bath.
Figure 2.7.: An open detector module is shown in the photo. On the left-hand side, the
light detector with the tiny structure of the SPT can be seen. On the right-hand side, the
phonon detector is presented with the scintillating crystal and the SPT structure on its
surface.
2.2. CRESST Detectors
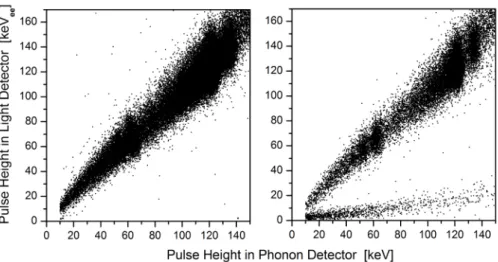
Figure 2.8.: The active background discrimination is illustrated in scatter plots wherein the height of signals from the light detector is plotted versus the height of signals from the phonon detector. The band in the left picture results from interactions with photons and electrons. In the right picture, an exposure to a neutron source created the additional lower band. Figure taken from [MBB
+99].
Its principle is nicely visible in a diagram where the light measured in the light detector is plotted versus the deposited energy in the phonon detector, as shown in g. 2.8. As depicted on the left-hand side, a detector module has been irradiated with photons of 122 keV and of 136 keV (
57Co) and with a continuous β -spectrum (
90Sr). The electrons and photons which are the dominant background interact electromagnetically with the electrons of the target material. Their recorded events turn up in an almost linear band. There is obviously, at least in rst order, a direct proportionality of the amount of scintillation light to the total energy deposition. The slope of the electron- γ -band is equal to one due to the energy calibration which will be introduced in section 4.3.4.
As depicted on the right-hand side, the detector module has additionally been exposed to an americium-beryllium neutron source, leading to nuclear recoils in the target crystal.
Due to the low mass of neutrons, the largest amount of energy is transferred to oxygen nuclei. As reected by the smaller slope of the neutron band, the specic light yield of nuclear recoils is smaller than that of electron recoils produced by incident electrons or photons.
Furthermore, alpha particles form a band in between the electron- γ -band and the neutron- band, since they are charged, but much heavier than electrons.
Previous measurements revealed that the scintillation light yield of nuclear recoils varies for nuclei of dierent elements [Sch10]. As WIMPs are expected to interact predominately with the heaviest nuclei (see eq. 1.28), their scattering interactions should show up in an additional band.
Usually, the slope of a certain band in the light-phonon plane is characterized with
respect to the slope of the electron- γ band by means of the quenching factor QF. This factor denes the ratio of the amount of scintillation light produced by a certain particle X with respect to the amount of scintillation light produced by a photon, at the same deposited energy ∆E .
QF
X:= light produced by particle X with energy ∆E
light produced by γ radiation with energy ∆E (2.13) Accordingly, in order to identify possible WIMP signals, the knowledge of the quench- ing factors is essential. The quenching factors of CaWO
4have been measured in several experiments [Kro10]:
QF
e,γ= 100 %
2(2.14)
QF
O= (11.08
+0.91−0.91) % (2.15) QF
Ca= (6.38
+0.62−0.65) % (2.16) QF
W= (3.91
+0.48−0.43) %. (2.17) A detailed description of the physics behind the quenching factor, its energy dependency and its measurement can be found in [Huf10] and in [Kro10].
Light Yield Parameter
Each event in the above scatter plots contains both the information of the amount of energy deposited in the phonon detector E
phononand of the amount of scintillation light detected in the light detector E
light. Instead, also the light yield parameter y
y = E
lightE
phonon. (2.18)
may be used as abscissa. Then, the resulting bands are approximately horizontal with the electron-band being centred at around one (see 4.3.4.). The other bands appear underneath because of the smaller light yield.
2.3. Electronics and Data Acquisition
So far it has been shown that the deposition of energy in the thermometer, of either the light or the phonon detector, leads to a temperature rise which in turn entails an increase of the resistance of the thermometer.
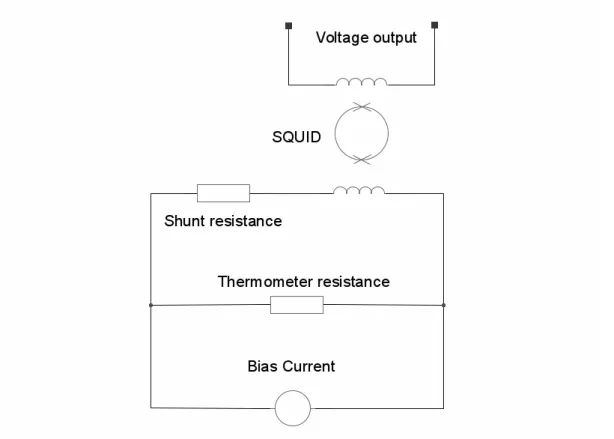
The thermometer lm is connected in parallel to a series connection of a shunt resistance of usually 40 m Ω and an input coil of the Superconducting Quantum Interference Device (SQUID; see the circuit diagram 2.9). The readout circuit is supplied with a constant bias current of usually a few µ A. This current divides into the two branches of the parallel
2
by denition
2.3. Electronics and Data Acquisition
Figure 2.9.: Scheme of the electrical readout circuit. The SPT is connected in parallel to a shunt resistance and the input coil of the SQUID. If a bias current is applied to this circuit, a change in the resistance of the SPT leads to a change of the current through the SQUID's input coil.
connection of the thermometer lm and the input coil of the SQUID. If the resistance of the lm R
Tchanges
3, as e.g. due to a temperature change, the current through the input coil of the SQUID and thus the magnetic ux Φ coupled to the SQUID loop changes as well. Basically, a SQUID is a ux-to-voltage transducer which provides an output voltage that is periodic in the applied ux Φ with a periodicity of one ux quantum Φ
0≡
2eh[Cla89]. A SQUID is a very sensitive device, being able to measure ux changes lower than Φ
0. In the CRESST experiment, it is operated in ux locked mode using a separate feedback coil to keep the ux through the loop constant. In this mode there is a linear relation between the applied magnetic ux and thus the current owing through the input coil and the output voltage of the SQUID electronics.
The readout circuit forms the rst part of the operational electronics of the detectors. A second module of electronics is used for the stabilization and control of the thermometer at its operating point within the superconducting transition.
3
![Figure 2.1.: Schematic drawing of the CRESST experimental setup. Picture taken from [Kie12]](https://thumb-eu.123doks.com/thumbv2/1library_info/4024941.1542029/18.892.118.759.160.1063/figure-schematic-drawing-cresst-experimental-setup-picture-taken.webp)