Limits on WIMP dark matter using sapphire cryogenic detectors
G. Angloher
a, M. Bruckmayer
b, C. Bucci
c, M. B€ u uhler
d, S. Cooper
a, C. Cozzini
b, P. DiStefano
b, F. von Feilitzsch
d, T. Frank
b, D. Hauff
b, Th. Jagemann
d, J. Jochum
d, V. J€ o orgens
c, R. Keeling
a, H. Kraus
a, M. Loidl
b,1, J. Marchese
a, O. Meier
b, U. Nagel
d,2, F. Pr € o obst
b,*, Y. Ramachers
a, A. Rulofs
b, J. Schnagl
d, W. Seidel
b, I. Sergeyev
b,3, M. Sisti
b,4, M. Stark
d, S. Uchaikin
b,
L. Stodolsky
b, H. Wulandari
d, L. Zerle
baDepartment of Physics, University of Oxford, Oxford OX1 3RH, UK
bMax-Planck-Institut f€uur Physik, F€oohringer Ring 6, D-80805 Munich, Germany
cLaboratori Nazionali del Gran Sasso, I-67010 Assergi, Italy
dPhysikDepartment, Technische Universit€aat M€uunchen, D-85747 Munich, Germany Received 27 September 2001; accepted 21 November 2001
Abstract
Data taken by CRESST with a cryogenic detector system based on 262 g sapphire crystals has been used to place limits on WIMP dark matter in the Galactic Halo. The experiment was especially sensitive for low-mass WIMPs with spin-dependent cross sections and improves on existing limits in this region. Ó 2002 Elsevier Science B.V. All rights reserved.
1. Introduction
The goal of the CRESST 5 experiment is to detect WIMP dark matter particles via the energy they deposit when elastically scattering on nuclei.
We have developed very sensitive massive cryo- genic detectors for this purpose and installed them in a low-background facility in the Gran Sasso Underground Laboratory (LNGS). This paper
*Corresponding author. Tel.: +49-89-3235-4270.
E-mail address:proebst@mppmu.mpg.de(F. Pr€oobst).
1Present Address: CEA Saclay, DSM/DAPNIA, 91191 Giff-sur-Yvette Cedex, France.
2Permanent Address: National Institute of Chemical Phys- ics and Biophysics, EE-12618 Tallinn, Estonia.
3Permanent Address: Joint Institute for Nuclear Research, Dubna, 141980, Russia.
4Present Address: INFN––Sezione di Milano, Piazza della Scienza 3, I-20126 Milano, Italy.
5Cryogenic Rare Event Search with Superconducting Ther- mometers.
0927-6505/02/$ - see front matterÓ 2002 Elsevier Science B.V. All rights reserved.
PII: S 0 9 2 7 - 6 5 0 5 ( 0 2 ) 0 0 1 1 1 - 1
www.elsevier.com/locate/astropart
describes our low-background facility in LNGS and Phase I of the project, which used 262 g sap- phire cryogenic calorimeters, and presents the re- sulting dark matter limits.
2. Low-background facility
Since our detectors operate at 15 mK, the central part of the CRESST low-background fa-
cility is the cryostat. The design of this cryostat had to combine the requirements of low tem- peratures with those of low background. Earlier cryostats in this field were conventional dilution refrigerators with some of the materials selected for low radioactivity. However, due to cryogenic requirements, some non-radiopure materials such as stainless steel cannot be completely avoided.
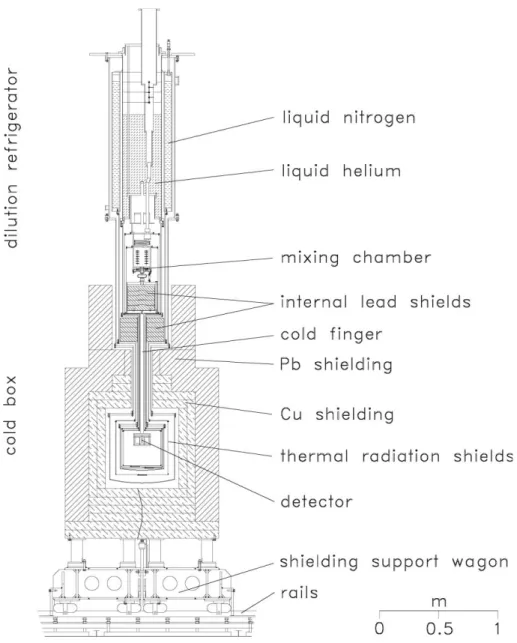
Therefore we chose the design shown in Fig. 1, in which the experimental volume is housed in a
Fig. 1. Layout of dilution refrigerator and cold box.
‘‘cold box’’, well separated from the dilution re- frigerator. The experimental volume can hold up to 100 kg of target mass. The cold box was made of low-background copper, with high-purity lead used for the vacuum seals. It was surrounded by shielding consisting of 14 cm of low-background copper and 20 cm of lead. Special consideration was given to the space between the dilution re- frigerator and the cold box. The separation was chosen large enough so that the ‘‘neck’’ of the external shielding, together with the internal shields, eliminated any direct line of sight from the outside world into the cold box. The low tem- perature of the dilution refrigerator was trans- ferred to the cold box by a 1.5 m long cold finger protected by thermal radiation shields, all of low-background copper. A 20 cm thick lead
shield inside a copper can was placed between the mixing chamber and the cold finger, with the low temperature transmitted here by the copper can. This internal shield, combined with another one surrounding the cold finger, served to block any line of sight for radiation coming from the dilution refrigerator into the experimental volume.
To avoid activation of the copper by cosmic rays we minimized the amount of time that the copper of the shielding and the cold box spent above ground. After electrolytic production the copper was stored in the cellar of a beer brewery near Munich, which shielded it from cosmic rays by more than 10 m water equivalent, reducing the hadronic component of the cosmic rays by a fac- tor of about 500. Each piece was only brought out
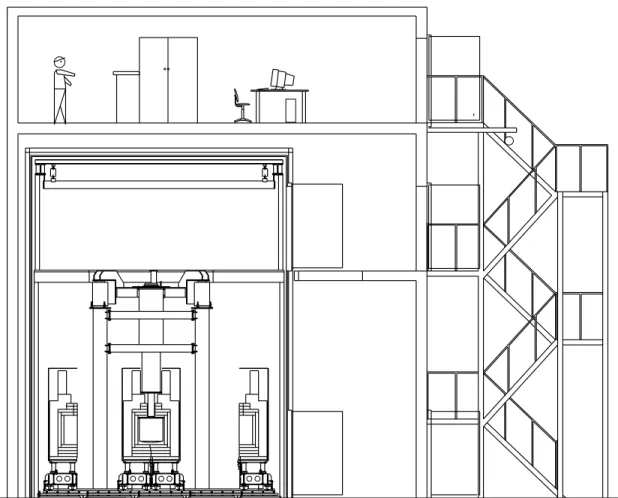
Fig. 2. Cross section of CRESST building in Hall B of LNGS. The external shielding is shown in both its open and closed positions.
of the brewery cellar for the few days needed for its machining, and then returned to the cellar. The total above-ground exposure of the copper was about 10 weeks.
It is not sufficient to use high-purity materials.
Their surfaces must also be kept clean during use, and we have taken care to design our facilities in Gran Sasso to make this possible. The Fara- day cage surrounding the experiment (Fig. 2) was chosen large enough so that all work on the low- background components of the experiment could be performed inside the cage. The cage was divided into two levels. The lower level was equipped as a clean room with a measured clean room class of 100 to protect the low-background compo- nents. Entrance to the clean room was through a changing room external to the Faraday cage (not shown in Fig. 2). The external lead and copper shields were in two closely fitting halves, each supported on a ‘‘wagon’’ on rails, so that the shielding could be opened without handling the in- dividual pieces. The entire shielding was enclosed in a gas-tight radon box that is flushed with boil- off N2gas and maintained at a small overpressure.
In its retracted position (shown in Fig. 2) the shielding was outside the dilution refrigerator support structure but still inside the clean room and sufficient room was then available to disas- semble the cold box.
The upper level of the Faraday cage was outside the clean room and allowed access to the top of the cryostat for servicing and to the electronics. To save on floor space in Gran Sasso, the counting room and a laminar-flow work space for handling the detectors were placed on top of the Faraday cage. All of this equipment was inside a building in Hall B.
The original installation used a prototype cold box, not made of radiopure materials. The pur- pose of the prototype was to test the cryogenic functioning of the design and to provide a well- shielded environment for completing the develop- ment of the 262 g detectors. At the end of 1998 the prototype cold box was replaced by a radiopure version of the same design. After machining, the new cold box was cleaned by electropolishing and subsequent rinsing with high-purity water. The pieces were then brought to Gran Sasso in gas-
tight transport containers made of PE and flushed with nitrogen.
3. Detectors used in Phase I 3.1. Sapphire cryogenic calorimeters
The detectors we have developed [1,2] consist of a dielectric crystal in which the particle inter- action takes place, and a small superconducting film evaporated onto the surface, serving as a thermometer. The detector is operated within the superconducting-to-normal transition of the ther- mometer, where a small temperature riseDT of the thermometer leads to a relatively large rise DRof its resistance. TheDT induced by a particle in the energy range of interest for dark matter is much smaller than the width of the transition, so that there is an approximately linear relation between DT andDR.
We have found [3] that the energy deposited by the particle does not thermalize in the dielec- tric crystal. Instead, to good approximation, the high frequency phonons created by an event spread throughout the crystal and reflect at the surfaces until they are directly absorbed in the superconducting film. Thus the energy resolu- tion is only moderately dependent on the size of the crystal, and scaling up to large detectors is feasible.
This technique can be applied to a variety of materials. The detectors employed in Phase I of the CRESST experiment in Gran Sasso used 262 g sapphire (Al2O3) absorbers and tungsten (W) thermometers operating near 15 mK. The 262 g sapphire detectors were developed by scaling up a 32 g sapphire detector [2]. Due to optimized de- sign, and because of the non-thermalization of the phonons, this scaling-up was achieved without significant loss in sensitivity.
Fig. 3 shows a 262 g sapphire detector mounted in its copper holder. The 4:04:04:1 cm3 crystal rested thermally insulated on supports at- tached to the holder. In the original design, these supports were sapphire balls. Some of the supports were fixed and others were on pins loaded with plastic springs.
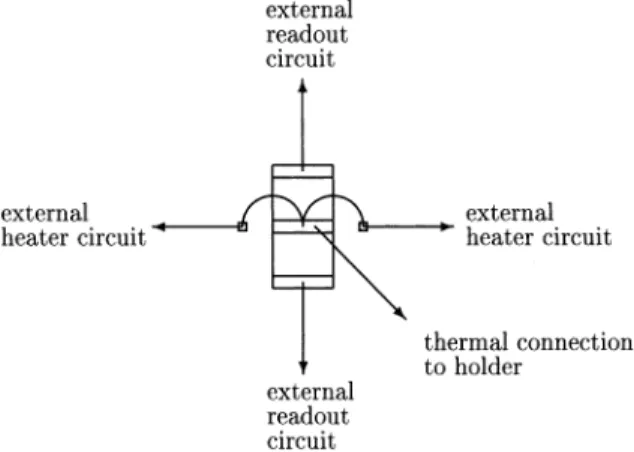
A succession of detectors were installed with varying thermometer geometry and electrical connections. Detector #8 (numbered in order of fabrication), which was used for dark matter limits presented here, had a W thermometer of size 3 mm5 mm. The electrical and thermal connections to the detector are shown in Fig. 4.
Thermal contact between the holder and the de- tector was provided by gold wires of 25 lm di- ameter bonded to the Cu holder and to a gold contact pad in the middle of the W thermometer.
The copper holder was thermally connected via the cold finger to the mixing chamber of the dilution refrigerator, which was stabilized to a temperature
of 6 mK. The electrical connection to the detector was made by superconducting Al wires bonded to Al pads on each end of the thermometer and to isolated contact pads on the holder. To avoid ra- dioactive solder joints, the superconducting wires from the holder pads to the external readout cir- cuit were screwed to the contact pads. The resis- tance of the thermometer (0.1 X) was measured by passing a constant current I0through the read- out circuit in which the thermometer was in par- allel with a small (0.05X) resistor and the input coil of a dc-SQUID (Fig. 5). A rise in the ther- mometer resistance was then measured via the current rise through the SQUID input coil.
In a separate circuit, a heater to control the temperature of the detector was provided by a5 mm long 25 lm diameter gold wire which was bonded to the gold pad in the center of the W thermometer and two very small Al contact pads on the sapphire crystal to either side of the ther- mometer. External connections to the two small Al pads were used to apply a controlled voltage across this gold wire. To avoid interaction between the heater circuit and the readout circuit, the place where they connect––the bond spot of the gold wire––was made as small as possible and its long axis was perpendicular to the direction of current
Fig. 3. Photograph of a 262 g sapphire detector. The trans- parent sapphire crystal (4) is in the center. The other visible components are (1) tungsten thermometer, (2) holder pads with screw contacts for connecting to the heater circuit, (3) plastic springs, (5) sapphire balls, (6) holder pads with screw contacts for connecting to the SQUID read-out circuit.
Fig. 4. Thermal and electrical connections to thermometer.
Fig. 5. Readout circuit to measure the resistance of the ther- mometer.
flow in the thermometer. The thermometer tem- perature was kept constant between pulses using the baseline of the SQUID output voltage as the temperature indicator and regulating the voltage to the heater under computer control using a proportional integral algorithm. The heater was additionally used to inject short heat pulses for monitoring the long term stability of the energy calibration and for measuring the trigger efficiency close to threshold.
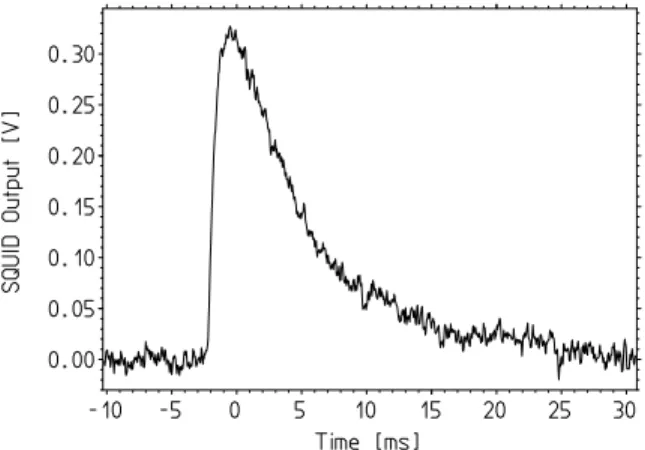
For the data-acquisition system, the output voltage of the SQUID electronics was split into two branches. One was shaped and ac-coupled to a trigger unit and the other passed through an anti- aliasing filter and was dc-coupled to a 16-bit transient recorder. The time base of the transient recorder was chosen to be 40 ls, which provided about 20 samples in the rise time of the pulse. The record length of 1024 time bins included a ‘‘pre- trigger’’ region of 256 bins, to record the base- line before the event, and a ‘‘post-trigger’’ region which contained the pulse. A typical recorded pulse is shown in Fig. 6. The transient recorder data for each triggered event were written to disk for off-line analysis. After each trigger there was a dead time of25 ms to allow time for the readout and the next pre-trigger region. Pulses arriving in another detector within half of the post-trigger period of the detector which triggered first were also recorded, including the time delay with re- spect to the first trigger.
3.2. Data taken in Gran Sasso
The sensitivity and size of the 262 g detectors meant that they could only be meaningfully tested in a low-background environment. This was first done in our setup in Gran Sasso using the proto- type cold box of normal copper. Using active thermal feedback, an energy resolution of 133 eV (FWHM) was achieved for 1.5 keV X-rays [4].
This active feedback was not used in our dark matter run, and without it the resolution at 1.5 keV was more typically 230–330 eV [5].
During 1999, a first series of measurements with four 262 g detectors under low-background con- ditions was performed in the new radiopure cold box. The measured background was much higher than expected. It was time-dependent and not Poissonian, indicating that it was not caused by radioactivity. The origin of this background was investigated in a series of runs and finally identi- fied as the spontaneous formation of microscopic cracks in the sapphire crystal at the points where it was supported by sapphire balls. Due to the ex- tremely small contact area of the balls, an exces- sive pressure resulted from the force needed to tightly hold the crystal. In the spring of 2000 the balls were replaced by plastic stubs with a larger contact area (3 mm diameter) and the spurious background completely disappeared. The use of these stubs did not lead to a noticeable loss of sensitivity, despite their larger contact area.
To study the background and obtain dark mat- ter limits, several runs were performed in 2000, with the longest one lasting about three months.
The high reliability, long-term stability and up- time during these runs demonstrated convincingly the suitability of such a system for dark matter searches.
In October 2000 the shaping of the trigger sig- nal was optimized and a lower trigger threshold was obtained. A week of data were taken under these conditions, with a few short interruptions to re-fill the cryostat with liquid helium. Due to the lower threshold, the dark matter limits obtained from these data are better than those from the previous longer runs, and it is these data which we discuss further. The data consist of a 10 h cali- bration run with an external57Co source, the dark
Fig. 6. Typical measured pulse of about 6 keV.
matter run without source (138.8 h of which 0.6 was dead time following triggers) and finally an- other calibration run. The data from detector #8, which had the lowest threshold, was used to set our dark matter limits. A second detector was used to eliminate coincident events.
3.3. Detector monitoring and calibration
The performance of each detector was moni- tored by injecting heater pulses into the small heater wire bonded to the W thermometer. These were produced by a voltage pulse from a pulser module, with the shape adjusted to create a de- tector response similar to that caused by a particle interaction. A pulse was sent every 30 s throughout both dark matter and calibration runs. The height of the pulses was varied to cover the whole dy- namic range, with more pulses in the low energy region. This method provided a monitor of the stability of the detectors, an extrapolation of the energy calibration over the whole dynamic range, and a measure of their trigger efficiency as a function of deposited energy. To calibrate the energy scale a 57Co source (122 and 136 keV c lines) was inserted inside the shielding via a re- movable plug, illuminating the cold box from be- low. Data were taken with this source along with the heater pulses. Comparison of the pulse heights from the source and heater pulses provided an absolute calibration of the heater pulses in terms of equivalentcenergy.
The amplitude of each pulse was determined by fitting it with a template. This avoids the bias of picking the highest point of suitably filtered pulses, which is systematically pulled by noise fluctuations to larger values. The absence of any bias is im- portant for a precise definition of the threshold. It was therefore checked by fitting randomly-sam- pled baseline noise taken throughout the data- taking period. The resulting distribution peaked with no significant bias at (0:00190:003) keV.
The first step in the energy calibration used the heater pulses. A separate heater pulse template for each pulser voltage was made by averaging many measured pulses from that voltage, and this tem- plate used to fit the amplitude of each heater pulse.
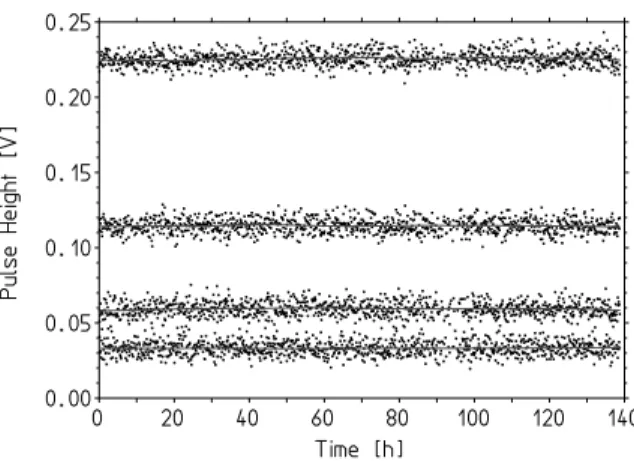
The stability of detector #8 during the dark mat-
ter run can be seen in Fig. 7 where the amplitude for heater pulses is shown as a function of time. To interpolate between pulser voltages, the ampli- tudes for heater pulses were plotted as a function of pulser voltage and fit with a polynomial func- tion. Similarly a template was made for pulses in the 122 keV c line of the calibration source to fit the amplitude of those pulses. This was compared to the heater pulse amplitudes to determine the scale factor between pulser voltage and c energy.
The resulting detector response as a function of c energy is shown in Fig. 8.
For the dark matter data, the response function determined above was used to convert each event’s pulse shape to energy in each time bin of the transient recorder record. A template was made from similarly-converted calibration-source pulses around the Compton edge (30–35 keV).
This template could be used to fit the pulse height, but it was found that an optimal filter gave a slightly better resolution. The optimal filter was calculated using the template and randomly sam- pled baseline noise. A comparison to the template fit showed that the optimal filter did not introduce an energy bias. The resulting spectrum for the dark matter run is shown as the upper histogram in Fig. 9.
Fig. 7. The measured pulse height of detector #8 as a function of time during the dark matter run for the heater pulses of energy 0.58, 1.04, 2.04, and 4.08 keV. The detector is seen to be stable to within the resolution. The fitted lines were used to calculate the response function at the time of event pulses as shown in Fig. 8.
The reliability of the energy calibration method to low energy was later checked with a dedicated run where a low-activity57Co source was mounted inside the cryostat directly facing the crystals. Be- sides the 122 and 136 keVclines, this source gave a 14.4 keVcline and a 6.4 keV Fe X-ray line. The source was chosen to be very weak to reduce the chance of contamination, with the result that the one week run gave low statistics in the 14.4 and 6.4 keV lines. After applying the standard cali- bration method of extrapolation from the 122 keV
line as described above, the measured energies for the 14.4 and 6.4 keV lines were 15:16þ0:090:09keV and 6:70þ0:070:05 keV, respectively, with the fit errors cor- responding to 90% CL. Our calibration procedure puts the 14.4 and the 6.4 keV lines 5.3% and 5.4%
too high. Since it is the lower energies which most affect our dark matter limits, this tendency to shift events up in energy puts our limits on the conser- vative side.
4. Limits on WIMP dark matter
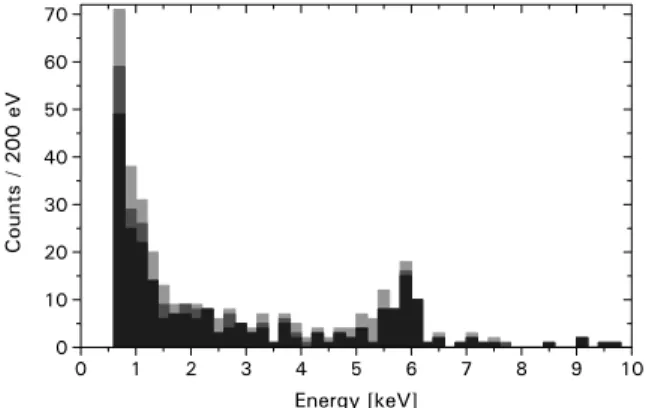
4.1. Energy spectrum from darkmatter run The individual detectors varied in their re- sponse, with detector #8 having a lower threshold and thus giving the best dark matter limits. The trigger efficiency of this detector was measured to be 100% down to an energy of 580 eV throughout the dark matter run. A software threshold of 600 eV was used to avoid reliance on the detailed be- haviour of the trigger efficiency at very low ener- gies. Detector #8 had 446 events from the software threshold to 120 keV. The uncut spectrum is shown as the upper histogram in Fig. 9.
Events in coincidence in two or more detectors cannot be due to WIMP interactions, and so can be discarded. The distribution of the time differ- ences between events showed a clear coincidence peak with a full width at half maximum of about 0.4 ms and long tails extending to about 4 ms for very low detected energies. The coincidence cut was set at4 ms, removing 76 events (17% of the total events) and introducing negligible dead time.
The pulse shape of the remaining 370 events was then examined. Some of the events were spuri- ous, induced by mechanical vibration or electronic noise, with an abnormal pulse shape. Particle in- teractions could also produce distorted shapes when the energy deposit was high and beyond the detector’s dynamic range. To judge the correctness of the pulse shape, each event was fitted with the template and the r.m.s. deviation calculated. A cut on this deviation was chosen to be conservative and have a retention efficiency of essentially 100% at all energies for good events. Its efficiency was tested
Fig. 8. The pulse heights for detector #8 for each injected heater pulse energy calculated from the lines in Fig. 7 are shown as points. The curve is the fitted polynomial which was used as the response function. The inset is an enlargement of the low energy region.
Fig. 9. Energy spectrum of events in detector #8 in the dark matter run (without source) in 200 eV bins. The upper histo- gram shows the uncut data, the middle histogram the data after coincident events were rejected, and the lower histogram after the pulse shape cut.
with heater pulses, resulting in only 1 out of 1032 of the 580 eV heater pulses being discarded. A second test with the calibration source showed that only 0.22% of the events were discarded. After the pulse shape cut 320 events remain. These are shown as the lower histogram in Fig. 9.
To investigate the significance of the coinci- dence rate in more detail, the order of the cuts was reversed. Applying the pulse shape cut first re- moved 59 events. The coincidence cut then re- moved 67 events. Thus nine events were both in coincidence and had bad pulse shapes and could be due to a common external source such as a microphonic disturbance from the cryostat. The energy of these nine events was below 6 keV in both detectors. The remaining 67 coincident events appear to be good pulses and could be due to a photon or neutron scattering depositing energy in two crystals. These 67 coincident events are 17% of the total events with good pulse shape. Consider- ing that only two detectors were active in this run and only one out of six faces was facing the other crystal, this coincidence rate of 17% is consistent with the solid angle for detecting coincidence and thus with all events being background. This shows that the coincidence cut could be very useful in eliminating background in a larger segmented de- tector.
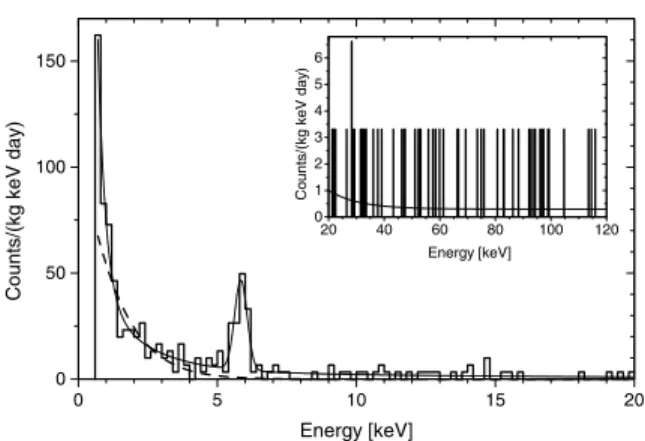
The final spectrum for detector #8 is shown again in Fig. 10. In the energy range from 15 to 25 keV there are 11 counts which translate into a background of (0:730:22) counts/kg/keV/day.
The background drops to about 0.3 counts/kg/
keV/day at 100 keV.
The spectrum shows a peak at about 5.9 keV with (7:01:2) counts/day. The position of the peak suggests a contamination with 55Fe in the vicinity of the crystal.55Fe emits Mn X-rays at 5.9 keV with no c’s and was used as a source for characterizing the performance of the detectors.
The spectra measured with other detectors were very similar, with nearly the same count rates in both the peak and the continuous part of the spectrum. However the peak is wider than ex- pected, 57290 eV FWHM compared to the 20050 eV of the 6.4 keV line from the internal calibration source, so that it may be due to more than a single X-ray line.
4.2. Extraction of limits
The extraction of upper limits for the WIMP scattering cross section as a function of WIMP mass involves comparing the measured energy spectrum to that expected for nuclear recoils caused by elastic WIMP scattering.
The recoil spectrum expected from WIMP scattering on the nuclei of the detector was calcu- lated using the formulae from Ref. [6] for a truncated Maxwell velocity distribution in an isothermal WIMP–halo model. The parameters are summarized in Table 1. For the spin-depen- dent interaction the only contribution is from the
27Al nuclei, which have spin of 5/2 and 100%
natural isotopic abundance. The WIMP–nucleus scattering cross section r0 remains as a free pa- rameter which scales with the number of expected events.
Fig. 10. Energy spectrum of detector #8 during the dark matter run (1.51 kg day) in 200 eV bins. The inset shows the spectrum at higher energies. The solid curve is an empirical fit to the experimental spectrum which was used in extracting dark matter limits. For illustration a 5 GeV WIMP excluded at 90%
CL is shown as the dashed curve.
Table 1
List of parameters used for calculating WIMP recoil spectra
Parameter name Value
WIMP Maxwellian velocity parameterv0 220 km/s
Escape velocity 650 km/s
Earth’s relative velocity 230 km/s
WIMP local halo density 0.3 GeV/cm3
The WIMP–nucleus scattering cross section at finite momentum transfersqis parameterized as
dr
dq2ðqÞ ¼ r0
q2maxF2ðqÞ; ð1Þ
where r0 is the total point like isotropic scatter- ing cross section, qmax is the largest momentum transfer andFðqÞis the form factor. For the spin independent interaction we have used the Helm form factor [9]
FðqÞ ¼3j1ðqR0Þ qR0
exp½ðqsÞ2=2; ð2Þ
wherej1is the spherical Bessel function of index 1, R0¼ ffiffiffiffiffiffiffiffiffiffiffiffiffiffiffiffiffi
R25s2
p ,s¼1 fm andR¼1:2A1=3fm (Ais the atomic number) as suggested in Ref. [10]. For small nuclei the effect of the form factor is small, for27Al reducing the cross section by only a factor of 0.712 at a recoil energy of 100 keV, so that details of the form factor have negligible effect on the resulting exclusion plot. For spin-dependent interactions we have used the form factor of Ref.
[11] explicitly calculated for the27Al nucleus.
The theoretical WIMP recoil spectrum must be convoluted with the experimental resolu- tion. The width of the 5.9 keV peak in Fig. 10 is DE¼57290 eV (FWHM), whereas the resolu- tion of the peak at 6.4 keV from the internal cal- ibration source is 20050 eV, in agreement with the energy resolution of the heater pulses. At the 122 keV peak of the calibration source the reso- lution degrades to about 5 keV. To be conservative we chose the larger value for the resolution at 6 keV and used an energy-dependent resolution formula which interpolates between 6 and 122 keV values: DE¼ ðð0:519 keVÞ2þ ð0:0408EÞ2Þ1=2. A comparison with the limits obtained using the smaller resolution at 6 keV showed negligible change. The recoil spectrum was convolved with a Gaussian curve with that full width at half maxi- mum. We assumed that electron and nuclear re- coils have the same fraction of their energy going into phonons (i.e. a quenching factor of 1). An experimental proof of this plausible assumption does not yet exist for our sapphire detectors;
however, quenching factors close to 1 have been measured with other cryogenic detectors [12].
There is no standard procedure for extracting upper limits in a case like this where the signal shape is a broad smooth spectrum on top of an unknown background spectrum of similar shape.
To be free of assumptions on the background shape, one intuitively wants to rule out WIMP cross sectionsr0where the WIMP recoil spectrum alone is above the data. The problem is how to do this in a statistically correct manner to obtain a limit at a given confidence level (here 90%). Below we describe three different approaches and com- pare their results.
The optimal interval method has been used by other groups [13–16]. This method uses the fact that for a given WIMP mass, some energy inter- vals (typically close to the threshold) are more ef- fective than others for constraining the existence of a WIMP signal in the data. The optimal interval method tries all possible energy intervals and chooses for each WIMP mass the one which gives the most stringent limit onr0. In each interval the total number of detected events is simply com- pared to the integral of the WIMP spectrum to find the r0 that is excluded to 90% CL, with no consideration given to whether the shapes agree within the interval. We applied this method, using a variable-width energy interval with a smallest width of 1.2 keV (twice our energy resolution). The result is shown as the dashed line in Fig. 11. The expected WIMP spectrum is always largest at the lowest recoil energy and falls more steeply for lower mass WIMPs. Therefore at low WIMP masses the optimal interval starts at threshold and is limited by the 1.2 keV minimal width, which is quite large for very low WIMP masses. The downward jump near 10 GeV in the optimal in- terval limits is due to the optimal interval shifting from below the 5.9 keV peak to above it. For WIMP masses above 10 GeV the optimal interval can be selected as a small section of a wide region with low statistics, which can result in a large se- lection bias. For example for WIMP masses be- tween 30 and 1000 GeV the relatively small interval from 22.6 to 26.4 keV with no counts is selected. To test the selection bias we have used two simple alternative methods.
In the fit method we fit the spectrum with an empirical functionBas shown in Fig. 10. using a
maximum likelihood method with Poissonian sta- tistics in each bin. The function is the sum of three falling exponentials, a constant term, and a Gaussian curve for the peak near 5.9 keV. The maximum likelihoodLof the best fit B0 is called L0. Without a WIMP contribution the function B0 just describes the background. Then a WIMP signalS is added and the background function is redefined toB0¼B0S, or if that is negative then B0¼0. With this redefinition we avoid in any sense subtracting the background, and are only using it as a way to calculate the likelihood. For a small enoughr0, for whichSis below the function B0 in each bin, the likelihood is unchanged. With increasingr0, whenSstarts to exceed the function B0in some energy bin,B0becomes limited at 0 and the likelihood L starts to decrease. The r0 ex- cluded at 90% CL is obtained when lnL¼ lnL01:282=2 is reached. (1:28r gives the two- sided 80% CL of a Gaussian distribution; the factor of 2 is because we use likelihood rather than v2.)
The Monte Carlo (MC) method starts from the same empirical fit of the data and uses this fit function B0 as the Poisson mean in each bin to generate a large number of synthetic MC spectra.
To determine the 90% CL upper limit the same functional formBis fit to each synthetic data set and ther0is found for whichS ¼Bin one energy bin for that data set. Those r0 values are then
ordered and the 90% CL upper limit is that r0
which is above 90% of the values determined from all the synthetic data sets. Finally, the adequacy of the fit function B0 to describe the real data was tested by comparing the likelihood of B0 for the data with the likelihoods of the fits to the synthetic data sets. The likelihood ofB0is near the middle of the distribution, with 53% of the synthetic likeli- hood values being larger, indicating a very ade- quate choice of fit function.
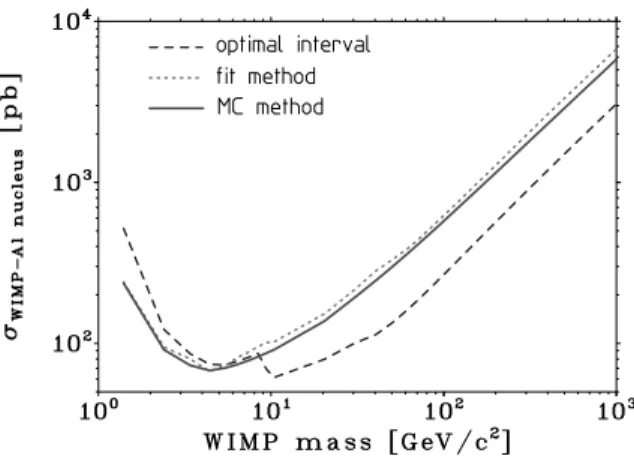
The results of all three methods are compared in Fig. 11. At low WIMP masses the optimal in- terval method yields weaker limits due to the re- striction to a 1.2 keV minimal width. For WIMP masses above 10 GeV the optimal interval gives the strongest limits, demonstrating the effect of the selection bias. The difference between MC and fit method is small and we have chosen the MC method to present our limits.
Fig. 12 shows our 90% CL upper limits on ther0
for spin-dependent WIMP interactions on Al. In order to compare our results to those of experi- ments using other target nuclei, we have converted our WIMP–nucleus cross sections to WIMP–
proton cross sections [18]. This conversion intro- duces some dependence on the model for the
Fig. 12. Equivalent WIMP–proton cross section limits (90%
CL) for a spin-dependent interaction as a function of the WIMP mass from a 1.51 kg day exposure of a 262 g sapphire detector. For comparison we show limits from the EDEL- WEISS dark matter search with cryogenic sapphire detectors [16], from the experiment at the Nokogiriyama site with cryo- genic LiF detectors [17], and from DAMA [19] and UKDMC [20] with NaI detectors.
Fig. 11. Comparison of the different methods described in the text to extract 90% CL exclusion limits for the WIMP-27Al spin- dependentr0limit. The MC method was selected to extract the limits shown in Figs. 12 and 13.
nuclear physics of the target nuclei and the SUSY composition of the WIMP.
The ‘conventional’ conversion procedure relied on the odd-group model [21,22] in which the only contribution to the WIMP–nucleus interaction for a nucleus with an unpaired proton or neutron comes from the protons or neutrons, respectively.
Then, when converted to the cross section on the unpaired nucleon (proton for Al, Na, I), the WIMP-model dependence conveniently cancelled.
In the notation of Ref. [22] the WIMP–proton cross section is then obtained from the WIMP–
nucleus cross sectionr0by
rWIMP–p¼r0
l2p l2A
k2pJpðJpþ1Þ
k2AJAðJAþ1Þ ð3Þ The reduced mass lA is given by lA¼mAmv= ðmAþmvÞfor WIMP massmv and target nucleus massmA. The values for thek2JðJþ1Þfactors are given in Ref. [22] as 0.750 for the proton and 0.087 for 27Al. These values and Eq. (3) were used to obtain the CRESST WIMP–p limits given in Fig.
12. In the odd group model a comparison to n- type nuclei like 73Ge becomes very problematic because the WIMP-model dependence does not cancel (see e.g. the discussion in Ref. [7, Table 4]).
Therefore in Fig. 12 we only compare our results to those of other p-type nuclei. As can be seen in Fig. 12, we improve existing limits for low-mass WIMPs. This is due to our low threshold, and was the goal of the first phase of CRESST.
According to shell model calculations (see Ref.
[7,8,23]) and references therein; for 27Al, (see Ref.
[11]) strict p- or n-type nuclei do not exist and in general both protons and neutrons contribute and can even interfere in the cross section. Using the spin factor from Ref. [11] would shift the whole CRESST exclusion curve down by a factor of 1/1.9 to lower cross sections, if one neglects the neutron part for the spin factor as described in [23].
For the spin-independent interaction both Al and O nuclei contribute. The spin-independent (scalar) interaction is dominated by the strange and heavy quark content of the proton and neutron, which are usually assumed to be equal, leading to an A2 dependence of the cross section [24]. We assumed this dependence in calculating
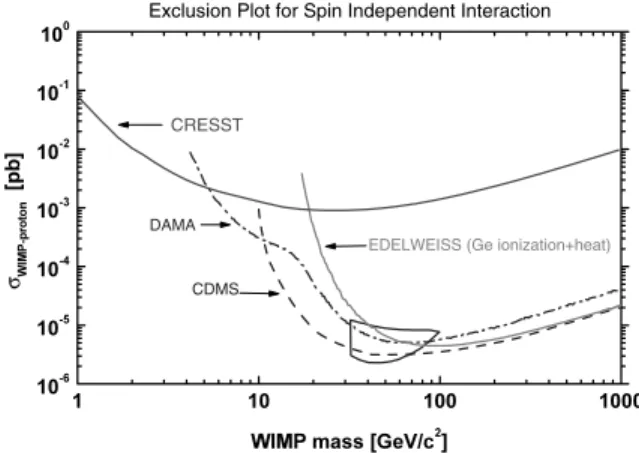
the expected recoil spectrum used to extract our spin-independent cross section limits, which are shown as the equivalent WIMP–p cross section in Fig. 13. The scalar channel is not very favourable for a target with light nuclei like sapphire, con- taining aluminium and oxygen, due to the crucial A2 coherence factor. However we still succeed in improving the limits for WIMP masses below 5 GeV.
5. Conclusions
The CRESST installation in Gran Sasso and our cryogenic detectors with superconducting phase transition thermometers and SQUID readout have been demonstrated to meet the needs of a dark matter search in terms of low radioactive back- ground and long-term stable cryogenic operation, with one run lasting for three months.
Phase I of the experiment used 262 g sapphire crystals as the target medium and was designed to provide a low energy threshold for nuclear recoils and thus good sensitivity for low-mass WIMPs.
The best WIMP limits were obtained from a 138 h
Fig. 13. Equivalent WIMP–nucleon cross section limits (90%
CL) for a spin-independent interaction as a function of the WIMP mass from a 1.51 kg day exposure of a 262 g sapphire detector. For comparison limits are shown from CDMS with cryogenic detectors and statistical subtraction of the neutron background [25], EDELWEISS with a heat and ionization Ge detector [26], and UKDMC [20] and DAMA [19] with NaI detectors, together with the allowed region at 3rCL from the DAMA annual modulation data [27].
run during which one of the detectors was 100%
efficient above a software threshold of 600 eV. The background level was below 1 count/kg/keV/day above 20 keV, falling to about 0.3 at 100 keV.
Events in coincidence in two detectors made up a significant fraction of the background, so that a coincidence cut could be a powerful tool in re- ducing the background in a larger segmented de- tector. Dark matter limits were obtained without the need for background subtraction or large efficiency corrections. Data from the best detec- tor yielded limits on both spin-dependent and spin-independent WIMP interactions which are more stringent than previously available limits for WIMP masses below 5 GeV.
The second phase of the experiment is now being prepared. This will use cryogenic scintilla- tors [28,29], with simultaneous measurement of the phonon and scintillation light to reduce the back- ground from local radioactivity and provide im- proved sensitivity for high-mass WIMPs.
Acknowledgements
This work was supported by the DFG SFB 375
‘‘Particle Astrophysics’’, the EU Network ‘‘Cryo- genic Detectors’’ (contract ERBFMRXCT980- 167), BMBF, PPARC, and two EU Marie Curie Fellowships.
References
[1] W. Seidel, G. Forster, et al., Phys. Lett. B 236 (1990) 483;
M. Frank, D. Dummer, et al., Nucl. Instrum. Meth. A 345
(1994) 367;
P. Ferger et al., Phys. Lett. B 323 (1994) 95.
[2] P. Colling, A. Nucciotti, C. Bucci, et al., Nucl. Instrum.
Meth. A 354 (1995) 408.
[3] F. Pr€oobst, M. Frank, et al., J. Low Temp. Phys. 100 (1995) 69.
[4] O. Meier et al., Proc. LTD-8, Nucl. Instrum. Meth. A 444 (2000) 350.
[5] M. Sisti, O. Meier, et al., Nucl. Instrum. Meth. A 466 (2001) 499.
[6] F. Donato, N. Fornengo, S. Scopel, Astropart. Phys. 9 (1998) 247.
[7] J.D. Lewin, P.F. Smith, Astropart. Phys. 6 (1996) 87.
[8] G. Jungman, M. Kamionkowski, K. Griest, Phys. Rep. 267 (1996) 195.
[9] R.H. Helm, Phys. Rev. 104 (1956) 1466.
[10] J. Engel, Phys. Lett. B 264 (1991) 114.
[11] J. Engel et al., Phys. Rev. C 52 (1995) 2216.
[12] A. Alessandrello et al., Phys. Lett. B 384 (1996) 316.
[13] HDMS, L. Baudis et al., Phys. Rev. D 59 (1999) 022001.
[14] IGEX, A. Morales et al., Phys. Lett. B 489 (2000) 268.
[15] ROSEBUD, S. Cebrian et al., Astropart. Phys. 15 (2001) 79.
[16] EDELWEISS, A. de Bellefon et al., Astropart. Phys. 6 (1996) 35.
[17] W. Ootani et al., Phys. Lett. B 461 (1999) 371.
[18] CRESST, W. Seidel et al., Proc. LTD-5, J. Low Temp.
Phys. 93 (1993) 797.
[19] DAMA, R. Bernabei et al., Phys. Lett. B 389 (1996) 757.
[20] UKDMC, N. Spooner et al., Phys. Lett. B 473 (2000) 330.
[21] J. Engel, P. Vogel, Phys. Rev. D 40 (1989) 3132.
[22] J. Ellis, R.A. Flores, Phys. Lett. B 263 (1991) 259.
[23] D.R. Tovey et al., Phys. Lett. B 488 (2000) 17.
[24] J. Engel, S. Pittel, P. Vogel, Int. J. Mod. Phys. E 1 (1992) 1.
[25] CDMS, R. Abusaidi et al., Phys. Rev. Lett. 84 (2000) 5699.
[26] EDELWEISS, A. Benoit et al., astrp-ph/0106094, 6 June 2001.
[27] DAMA, R. Bernabei et al., Phys. Lett. B 480 (2000) 23.
[28] P. Meunier et al., Appl. Phys. Lett. 75 (1999) 1335.
[29] CRESST, M. Bravin et al., Astropart. Phys. 12 (1999) 107.