New Technique for the Measurement of the Scintillation Efficiency of Nuclear Recoils
Jelena Ninkovi´c ∗ , Peter Christ, Godehard Angloher, Dieter Hauff, Emilija Panti´c, Federica Petricca, FranzPr¨ obst,
Wolfgang Seidel
Max-Planck-Institut f¨ur Physik (Werner-Heisenberg-Institut) F¨ohringer Ring 6, D-80805 Munich, Germany
Abstract
We present a new technique developed for the measurement of the scintillation efficiency of nuclear recoils in solid scintillators. Using this technique we measured the quenching of the scintillation efficiency for the various recoiling nuclei in CaWO4 crystals which are used in direct Dark Matter searches.
Key words: Scintillation efficiency,TOF,Dark Matter,CaWO4,Quenching factor PACS:32.50.+d,29.40.Mc,82.80.Rt,95.35.+d
Introduction
The direct detection and the understanding of the nature of Dark Mat- ter remain the outstanding challenges of present day physics and cosmology.
∗ Corresponding author: tel: +49 89 83940049; fax: +49 89 83940011;
Email address: ninkovic@mppmu.mpg.de(Jelena Ninkovi´c).
Manuscript
Searches for Weakly Interacting Massive Particles (WIMPs) which may con- stitute the galactic Dark Matter are presently being carried out by a number of groups world-wide [1][2][3]. Direct detection experiments appear today as one of the most promising techniques to detect particle Dark Matter. All di- rect detection experiments rely on the basic idea that many WIMPs should pass through the Earth, making their detection possible. Interaction with or- dinary matter is expected via elastic scattering on nuclei which, for the spin- independent case, should be coherent with all nucleons in a nucleus resulting in a cross-section rising in proportion to A2 (where A is the mass number) and therefore favoring heavy nuclei [4]. In addition a low energy threshold is an experimental requirement as the predicted energy spectrum falls expo- nentially with energy. Due to the extremely low WIMP - nucleus scattering cross section the ability to discriminate WIMP signals from the radioactive background is essential for this kind of experiments.
Cryogenic detectors based on simultaneous detection of light and heat fulfill these requirements [5]. They utilize the fact that the light output from nuclear recoil events in the scintillator is reduced compared to the light ob- served fromβandγ– interactions (“electron recoils”) of the same energy. This is characterized by the Quenching Factor (QF) which is defined as the ratio of the light output from electron recoils and from nuclear recoils of the same energy. For an effective background suppression the quenching factors have to be known, especially because different nuclei present in the scintillator are expected to have different quenching factors [6][7]. In contrast to the WIMPs, the residual neutron background comes mostly from elastic scattering off the lighter elements. Therefore the different quenching of different recoiling nuclei in the scintillator can be used for a discrimination of the neutron background.
In order to measure the quenching factors of different recoiling nuclei in scintillators we have developed a new technique. It relies on the measurement of the light output produced when the scintillating crystal is bombarded by different ions. This method allows to measure quenching factors for a wide range of different elements and scintillators.
1 Experimental technique
Nuclear recoil quenching factors have been measured for a variety of scin- tillators such as NaI [8][9], CaF2(Eu) [10], CsI(Tl) [11] with neutron scattering experiments.
Instead of measuring the light produced by the recoiling nuclei of the tar- get material as in the neutron scattering experiments, the technique presented here measures the light emitted when single ions impinge onto the scintillating crystal. As this work was done in the framework of the CRESST 1 experi- ment, CaWO4 was used as target material. Ions with fixed kinetic energy were produced with a Laser Desorption / Ionization ion source (LDI) in a time-of- flight mass spectrometer (TOF-MS). The CaWO4 crystal was mounted at the end of the flight tube and the light was detected using a photomultiplier. An
55Fe source was used for the reference measurement.
1 Cryogenic Rare Event Search with Superconducting Thermometers
1.1 TOF mass spectrometer with an LDI ion source
Figure 1 shows the scheme of the time-of-flight mass spectrometer with the LDI ion source used for this measurement. The ion source was separated with a small gate valve from the main vacuum chamber of the spectrometer.
This allowed to vent just the small compartment for the exchange of the target, with minimal interruption ( 20 min) of operation.
Six different target materials could be fixed on the target holder, using sil- ver epoxy (Fig. 2). The target holder could be rotated and moved transversely to be able to reach the whole target with the laser.
A shot from the pulsed UV laser of 337 nm wavelength desorbed and ionized the atoms. The shot duration was in the order of nanoseconds. The laser power could be controlled with a dielectric attenuator and the beam was focused on the sample disc with a lens of 200 mm focal length. At the sample target the laser power density was typically 106– 107W/cm2. The maximum acceleration voltage of the LDI ion source was 18 keV. The ion beam was focused on the scintillator using an Einzel lens and X–Y deflection plates (Fig. 1).
The MS was instrumented with an additional ion deflector which allowed the selection of ions with a certain mass. It consisted of a pair of plates the electric field of which was turned on when the laser shot was fired. It deflected all ions out of the beam path until the electric field was switched off. Therefore, all lighter ions preceding the ions of interest were deflected. The high voltage was then switched off to allow the passage of the desired ions and then switched on again in order to block higher mass ions (see Fig. 3).
The time-of-flight part used for the quenching factor measurements con- sisted of two ion reflectors (for details see [12]). Between these two reflectors a micro channel plate (MCP) could be inserted into the ion path at any moment of operation (Fig. 1). It was used to define the time window for switching off the voltage applied to the deflection plates to allow only the passage of the ion species of interest from a contaminated target material or from a multielement target (see figure 3). The selected elements and target materials are listed in table 1. The time-of-flight measured with the MCP, which is roughly half of the one at the outlet of the mass spectrometer, was used to adjust the photon counting window appropriately for each element (see Sec. 1.2 and Fig. 5).
The laser pulse was used as a start trigger and the signals of the MCP for the time-of-flight measurement were read out using a 500 MHzPCI transient digitizer.
1.2 PMT setup for photon counting
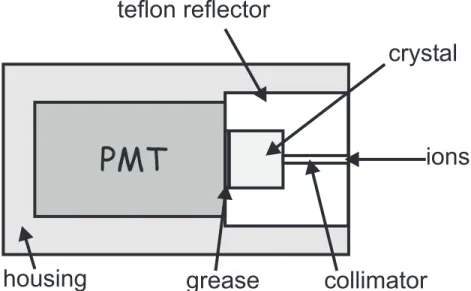
The photon counting setup consisted of a small CaWO4crystal (5×5×5 mm3) held in a teflon reflector and viewed by a photomultiplier tube that was placed in a housing which was mounted at a gate valve at the outlet of the mass spectrometer (Fig. 1 and Fig. 4). Ions reached the CaWO4 crystal via a small hole (ø = 1 mm, length = 8 mm) in the reflector. In order to reduce the effect of trapped light in the crystal, the crystal surface facing the photomultiplier tube (PMT) was roughened 2. Additionally, a thin layer of silicon grease was placed between the crystal and the PMT for optical coupling. The PMT was an Electron Tubes 9124B selected for the low rate of dark counts. A pream-
2 Polished with 10µm grain size.
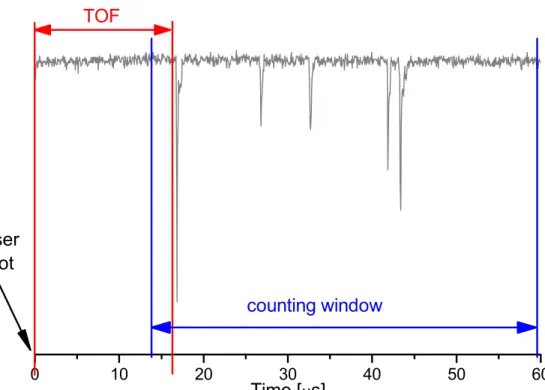
plifier followed by a 500 MHzdigitizer was used for the read out of the PMT signal. The data acquisition was triggered by the laser. For each laser shot the number of photons was determined by counting the number of voltage pulses exceeding a given threshold amplitude in a fixed time window after the arrival of the ion type of interest (see figure 5). The number of registered photons for each shot was then accumulated in a histogram. Additionally, for each registered photon its arrival time was collected in a second histogram, which gave the light curve of the scintillator and the time-of-flight of the ions (see figure 7).
The reference measurement for the quenching factor was made with 5.9 keV X - rays from an55Fe source. The radioactive source could be installed in front of the collimator without any change of the setup. For the reference measure- ment the data taking was triggered by the PMT signal. The photon counting was performed as in the case of ions.
2 Results and Discussion
2.1 MCP measurements
The elements (H, Be, O, Si, Ca, Cu, Y, Ag, Sm, W, Au) were chosen to smoothly cover the broad mass range of the elements in CaWO4 (see table 1).
For a proper placement of the time window for photon counting the arrival time of each ion type was measured with the MCP. As shown in Fig. 6 (left) the arrival times measured with the MCP follow the expected linear dependence
on√ A 3.
2.2 PMT measurements
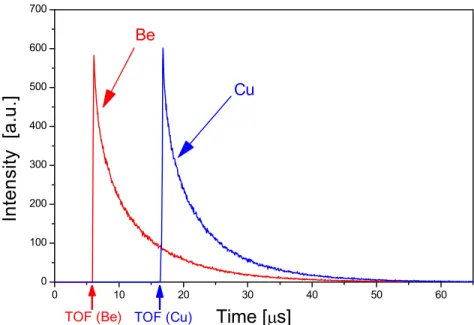
The width of the counting time window was kept fixed (30, 40, 50µs) for all measured elements. Figure 7 shows light curves of CaWO4 obtained with beryllium and copper ions. The times of flight extracted from the onset of the light curve (Fig. 6 right) were roughly twice as long as the ones measured with the MCP, consistent with the longer flight distance.
The sharp rise time (< 50ns) of the recorded light curves confirms the absence of electrical fields due to a charge up of the crystal or of its teflon holder during the measurement. Such charging up would slow down the ions before hitting the scintillator and therefore change their time of flight and this in turn would broaden the rise of the light curve or shift the onset posi- tion of the light curve in consecutive measurements. A comparison of several subsequently measured light curves confirmed the absence of such charging up.
3 Neglecting the time-of-flight in the ion source,the flight time tis
t = D
1
2eU A
z . (1)
where A and v are the mass number and the velocity of the ions,respectively,U is an electric potential difference, z charge state of the ions and D is the flight distance.
2.2.1 Reference measurement with X-rays
The electron recoil reference measurement for the determination of the quenching factors was made with 5.9 keV X-rays from an55Fe source. Figure 8 shows the spectrum measured with a 40µs photon counting window. Simul- taneous measurements with three time windows (30, 40, 50µs) were made in order to probe the dependence of the results on the width of the chosen time window. The spectra have been fitted using the fit procedure developed for ion spectra which will be discussed later. The results are presented in Table 2.
2.2.2 Spectra measured with ions
The laser power and the ion beam optics were adjusted such that the probability of multiple ion events (more than one ion impinging on the crystal surface per laser shot) was reduced as much as possible. The procedure is illustrated in figure 9. Laser power and focus were tuned that on average only each 15th laser shot gave an ion signal (figure 9 bottom).
2.2.3 Data analysis
For each laser shot a certain number of photons was detected. The main contribution to the recorded spectra comes from laser shots not producing ion signals and thus measure the dark counts of the photomultiplier. The number of dark counts obeys a Poisson distribution with a small mean value. The number of the photons produced by single ion events 4 gives a spectrum with a Poisson distribution with a higher mean value. If multiple ion events exist
4 Due to the reduced laser power and applied beam defocusing only single and a much smaller number of double ion events are occurring.
additional Poissonians will appear with a mean value equal to a multiple of the mean of the first one. In the counting procedure the origin of the registered photons cannot be identified. Therefore, the background had to be accounted for in the fit function.
For simplicity first only none (background) and one ion (signal) arriving per laser shot will be considered. In this case the probability to have k registered photons, Pt(k), is given by
Pt(k) = Pion(0) · P(k, B) + Pion(1)
k
l=0
P(l, B)PS(k−l, n · 1), (2)
where Pion(i) is the probability for i ions arriving per laser shot, P(k, B) is the probability of observing k background counts from a Poissonian distribu- tion with mean B and PS(m, n) is the probability that m signal counts are observed when n is the average number of observed photons for single ion events. The term describing the ion signal sums the probabilities of all possi- ble contributions of background and signal counts. When up toN ions arrive per laser shot equation 2 generalizes to
Pt(k) = Pion(0) · P(k, B) +
N
i=1Pion(i)
k
l=0
P(l, B)PS(k−l, n · i). (3)
Here, Pion(i),nand B are the fit parameters. The background is described by a Poissonian with a scale factor Pion(0) which can be fitted. The mean value B of the background Poissonian is determined by a separate background mea-
surement for each time window. The ion signal can be fitted with a selectable number of multiple ion events to be taken into consideration. The scale factor Pion(i) for each of the signal Poissonians i.e. the probability that a number i of ions arrives per laser shot and the average numbern of detected photoelec- trons per ion are the remaining free fit parameters. In figure 10 different fits
to the photon multiplicity spectra measured for H and W ions are shown. The dashed lines represent fitted spectra using the method described above.
As the peak positions of the single and double ion events of the hydrogen spectra are well separated from the background it was possible to check the validity of the background model used in the fit. Therefore, the three scale factors (Pion(0), Pion(1), Pion(2)), n and B were left as free fit parameters.
Within the statistical errors the values obtained for B are in agrement with those from the background measurements.
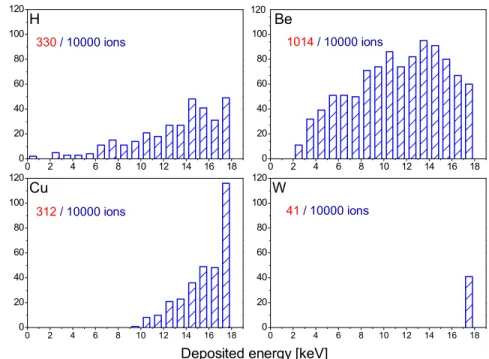
In the case of the hydrogen spectra (Fig. 10 left) there is a definite excess of measured events over the fitted line on the left hand side of the single ion peak 5. Such a background could be either produced by a relatively small number of ions that reached the crystal surface with a reduced energy or by backscattered ions which deposit only part of their energy in the crystal. In order to address this question, the process of the ions impinging onto the crys- tal surface was simulated using the SRIM2003 simulation package (Stopping and Range of Ions in Matter version 2003)[13]. This package calculates the stopping power and the range of ions in matter using a full quantum mechani- cal treatment of ion-atom collisions. Here, only the effect of backscattered ions will be discussed.
Figure 11 shows the simulated spectra of the energy deposition in the target (CaWO4) crystal from the backscattered ions for several projectiles.
The total number of simulated ions was the same for all elements (10000
5 This effect was only observed in the case of the hydrogen spectra where the signal peak position is far from the background,whereas for the heavier ones the Poissonians overlap such that the effect can not be noticed.
ions) and the numbers of backscattered ones are indicated in the figure. The energy spectra as well as the probabilities for the backscattering obtained from the simulation were implemented in the fit using the following procedure. An energy deposition with an energy lower than the nominal one will result in the production of a reduced number of photons obeying Poisson statistics within each energy bin. In order to consider energy losses due to the backscattering, the following fit function was used
Pt(k) =Pion(0)P(k, B) +
N
i=1
Pion(i)
k
l=0
P(l, B)
Eion
0
PS(k−l, n i Ed
Eion)PBS(Ed)dEd,(4)
wherePBS(Ed) is the probability density that due to the backscattering losses the energy Ed is deposited instead of the full energy of the ion Eion. PBS(Ed) has been calculated with SRIM2003. Fits including the effect of backscattering are shown in figure 10 as solid lines. Adding the backscattering effect gave a better agreement with the measured data in the case of the lighter elements.
Therefore, the backscattering of the ions can be only a partial explanation for the observed shape of the hydrogen spectrum. No change was observed for the heavier ones where the backscattering effect is only in the permil range.
For the light ions like hydrogen another possibility for energy losses is conceivable. Ions hitting the collimator inner surface could be scattered with a shallow angle and therefore reach the crystal surface with a reduced energy.
In order to address this issue, a test measurement was performed where a thin kapton tape was glued on top of the existing ion collimator hole (ø = 1 mm). A hole with a diameter of 0.7 mm was made in the center to prevent the ions from hitting the surface of the long collimator hole. This way, the number of the events that can scatter off the teflon surface should be considerably reduced.
The resulting spectra showed a lower relative intensity of the excess events,
but most probably due to a non perfect alignment of the used collimator, the effect was still partially observed. This indicates that the nature of the small excess background, observed in the case of H ions, in the region below the single ion peak can be at least partially explained, but further investigation is needed for a full understanding. Nevertheless, these excess events are only a very small fraction of the total counts and have a negligible influence on the number of photoelectrons per single ion hit resulting from the fit.
In the case of heavier ions the fit was more sensitive to the number of Poisson distributions included into the fit due to the strong overlap of the distributions (see Fig. 10). As previously discussed, using the defocusing of the beam the probability for multiple ion events was reduced to a very low level and therefore only single and double ion events had to be taken into account.
The introduction of a triple ion contribution into a fit may tend to shift the mean to smaller values which would result in slightly higher quenching factors for the heavy elements. A comparison of different fits obtained for H and W is shown in figure 10 while the results from these fits are given in table 3.
According to the previously discussed points, we decided to include the backscattering effect and to take into account only single and double ion con- tributions in the final fitting procedure.
The ratio of the normalized (to 1 keV) number of registered photons from the ion spectra,pe−(ion), and the reference measurement,pe−(55F e), will give the quenching factor for that specific element:
QF(ion) = pe−(55F e)
pe−(ion) · 18keV
5.9576keV . (5)
where 5.9576keV is the weighted energy of K-lines from 55Mn [14].
2.2.4 Quenching factor results
Figure 12 shows fitted spectra for oxygen, calcium and tungsten ions of 18 keV measured with a 40µs time window. Mean numbers of photons for single ion events obtained from the fits to spectra of all elements, as well as numerical values calculated for the quenching factors are given in table 4.
A graphical representation of the dependence of the quenching factors on the atomic mass of the element, for 40µs time window, is given in figure 13.
Within the 30µs time window not all emitted light is collected (see figure 7) whereas practically no light is emitted more than 40µs after the impact. This explains the slightly different mean values of pe− measured in the 30µs and 40µs time windows (see table 4). Practically identical values are obtained in the 40µs and 50µs time window measurements. Figure 13 also includes results from neutron scattering experiment at room temperature [15] and the values measured with a cryogenic detector at 7 mK [3]. The presented data for oxy- gen and the neutron scattering result are in reasonable agreement. The low temperature values follow the systematic mass dependence of the room tem- perature results. This demonstrates the absence of a significant temperature dependence of the quenching factors in CaWO4.
The presented new method for the quenching factor measurements has several advantages compared to traditional neutron scattering experiments.
The main advantage is that it is a simple “table-top” experiment. Measure- ments can be performed within a short period of time and a profuse choice of nuclei. A possible limitation may be due to surface effects causing a degra- dation of the light output for energy depositions close to the crystal surface.
Therefore, the technique can be used in principle for any (solid) scintillation material, which does not suffer from a surface degradation of the scintillation
efficiency. In the case of CaWO4 crystals we could not observe any surface dependence. Strong arguments for this could be found in the comparison of the light yields from the 210Po alpha decays at the crystal surface and 210Po decays in the bulk of the crystal measured with cryogenic detectors (see [3, Fig. 7 ]). The light yield is the same for both groups of events, showing, at least for alpha particles, that the quenching factor is the same for interior and surface events. This supplements the argument in [5] that the absence of any splitting of the electron-photon band, where one has electrons mostly near the surface and photons mostly in the interior, demonstrates that bulk and surface events have the same quenching factor.
3Conclusion
The quenching of the scintillation light from nuclear recoils is the key for an efficient background rejection in cold Dark Matter particle detectors that utilize scintillators. A new and powerful technique for the measurement of quenching factors was developed. It relies on the measurement of the number of photons produced when the scintillating crystal is bombarded by different ions. It uses a mass spectrometer to accelerate ions and measures, in single photon counting mode, the light which they produce when impinging onto a crystal.
With the new technique presented here it was possible for the first time to determine the quenching factor of tungsten in CaWO4. The measurement of quenching factors of different recoiling nuclei allows their identification and offers practically a multiple target choice within one absorber crystal. This provides additional sensitivity by discrimination of neutron background (O -
recoils) and possible WIMP events (W - recoils) [3]. In the case of a positive Dark Matter signal the change in the recoil energy spectra of different absorber nuclei gives a unique signature and a powerful tool for further identification and verification of WIMPs properties.
Acknowledgment
This work was partially supported by the DFG SFB 375 “Teilchen - As- trophysik” and the EU Network HPRN-CT-2002-00322 “Applied Cryodetec- tors”. The authors would like to thank Dr. Yorck Ramachers for bringing up the idea of using ions for quenching factor measurements.
References
[1] D. S. Akerib,et al.,First Results from the Cryogenic Dark Matter Search in the Soudan Underground Laboratory,Physical Review Letters 93 (21) (2004) 211301.
[2] V. Sanglard,et al.,Final Results of the EDELWEISS-I Dark Matter Search with Cryogenic Heat-and-Ionization Ge Detectors,Physical Review D (Particles, Fields,Gravitation,and Cosmology) 71 (12) 122002.
[3] G. Angloher,et al.,J. Ninkovi´c,Limits on WIMP Dark Matter using Scintillating CaWO4Cryogenic Detectors with Active Background Suppression, Astropart. Phys. (23) (2005) 325.
[4] G. Jungman,M. Kamionkowski,K. Griest,Supersymmetric Dark Matter,Phys.
Rep. 267 (1996) 195.
[5] P. Meunier,et al.,Discrimination Between Nuclear Recoils and Electron Recoils by Simultaneous Detection of Phonons and Scintillation Light,Appl. Phys. Lett.
75 (9) (1999) 1335.
[6] J. Lindhard,Influence of Crystal Lattice on Motion of Energetic Charged Particles.,Mat. Fys. Medd. Dan. Vid. Selsk. 34 (14).
[7] J. Lindhard,V. Nielsen,M. Scharff,Integral Equations Governing Radiation Effects,Mat. Fys. Medd. Dan. Vid. Selsk. 33 (10) (1963) 1–42.
[8] N. Spooner,et al.,The Scintillation Efficiency of Sodium and Iodine Recoils in a NaI(Tl) Detector for Dark Matter Searches,Phys. Lett. B 321 (1994) 156–160.
[9] D. Tovey,et al.,Measurements of Scintillation Efficiencies and Pulse-Shapes for Nuclear Recoils in NaI(Tl) and CaF2(Eu) at Low Energies for Dark Matter Experiments,Phys. Lett. B 433 (1998) 150–155.
[10] D. Tovey,et al.,A New Model Independent Method for Extracting Spin- Dependent (Cross Section) Limits from Dark Matter Searches,Physics Letters B 488 (2000) 17–26.
[11] D. Horn,et al.,The Mass Dependance of CsI(Tl) Scintillation Response to Heavy Ions,Nucl. Instr. and Meth. A 320 (1992) 273–276.
[12] P. Christ,R. S.,et al.,High Detection Sensitivity Achieved with Cryogenic Detectors in Combination with Matrix-Assisted Laser Desorption/Ionization Time-of-Flight Mass Spectrometry,Eu. J. Mass Spec. (10) (2004) 469–476.
[13] SRIMgroup,The Stopping and Range of Ions in Matter - SRIM2003, WEB:http://www.srim.org/SRIM/SRIM2003.htm.
[14] R. Firestone,V. Shirley,C. Baglin,S. Frank Chu,J. Zipkin,The Table of Isotopes,8th Edition,John Wiley and Sons,Inc.,1996.
[15] C. Coppi,et al.,Quenching Factor Measurement for CaWO4 by Neutron Scattering,in: Proceedings of the LTD-11,2005,to appear.
Table 1
List of selected elements with associated target material.
Ion Target material Ion Target material
H Stainless steel Y Y foil
Be Cu-Be foil Ag Ag foil
O CaO powder or CaWO4 crystal Sm Sm foil
Si Stainless steel W CuW foil and CaWO4 crystal
Ca CaO powder or CaWO4 crystal Au Au foil
Cu Cu-Be foil
Table 2
Fitted values of the numbers of photoelectrons for the 55Fe peak. Three different time windows have been analyzed. Only the statistical errors (1σ) of the fits are quoted.
Time window Mean value
30µs 23.67±0.13 pe−
40µs 24.08±0.13 pe−
50µs 24.22±0.14 pe−
Table 3
Fitted values of the mean number of photoelectrons observed for single ion hits n of signal Poissonians using different fitting procedures shown in figure 10. Only the statistical errors (1σ) of the fits are quoted.
Fit description Hydrogen Tungsten
Double ion events and
backscattering effect
32.96±0.10 1.72±0.05
Double ion events and
no backscattering effect
31.75±0.10 1.72±0.10
Triple ion events and
backscattering effect
32.99±0.07 1.63±0.10
Table 4
Mean number of detected photoelectrons and calculated quenching factor values.
Mean value [pe−] Quenching factor
30µs 40µs 50µs 30µs 40µs 50µs
H 32.95±0.10 33.77±0.10 33.78±0.10 2.17±0.02 2.15±0.02 2.17±0.02
Be 8.20±0.07 8.87±0.09
O 5.16±0.07 5.15±0.06 5.11±0.06 13.9±0.2 14.1±0.2 14.3±0.2
Si 3.36±0.20 3.38±0.18 3.31±0.16 21.3±1.3 21.5±1.2 22.1±1.1
Ca 2.70±0.06 2.78±0.07 2.77±0.07 26.5±0.7 26.2±0.7 26.4±0.7
Cu 2.38±0.07 2.44±0.08 2.46±0.08 30.1±1.0 29.8±1.0 29.8±1.0
Y 1.88±0.02 2.27±0.05 1.93±0.02 38.0±0.4 32.1±0.7 38.0±0.5
Ag 2.23±0.10 2.21±0.07 2.09±0.08 32.1±1.5 32.9±1.0 35.0±1.5
Sm 1.89±0.04 1.92±0.04 1.93±0.04 37.9±0.9 37.8±0.9 37.9±0.9
W 1.72±0.05 1.81±0.06 1.83±0.05 41.6±1.4 40.1±1.3 40.0±1.2
Au 1.75±0.06 1.87±0.06 1.84±0.05 40.8±1.4 39.0±1.3 39.7±1.2
Figure captions
Figure 1
Scheme of the experimental setup.
Figure 2
Target holder with six different materials.
Figure 3
Application of deflection plates for the selection of desired ions. Top: TOF spectrum of a CuBe target without deflection measured with the MCP.
Applying the proper selection parameters only ions of beryllium (middle) or copper (bottom) are reaching the detector (and also the PM setup at the end of the TOF path).
Figure 4
Schematical view of the PM setup for photon counting (not to scale). The components are discussed in the text.
Figure 5
Photomultiplier signal from one laser shot. The data acquisition is triggered by the laser. After the time-of-flight the ion hits the crystal. In the figure voltage pulses from single photons created by the ion are shown. Ions are counted within a fixed time window which opens shortly before the ion arrives after the known time of flight. The width of the counting window was kept constant for all measurements.
Figure 6
Dependence of time-of-flight on√
A (where A is a mass number) measured
with the MCP placed at half the distance to the PM tube (a) and with a CaWO4 crystal in the PM setup placed at the outlet of the mass
spectrometer taking the onset of the light curve as the arrival time of the ion (b). The solid lines represent linear fits to the measurements with
parameters as given in the boxes.
Figure 7
Light curves for beryllium and copper.
Figure 8
Photon multiplicity spectrum recorded with a time window of 40µs while irradiating the CaWO4 crystal with X-rays from55Fe source. The
corresponding fitted Poissonian mean value is 24.08±0.13 pe− (4.04±0.02 pe−/keV).
Figure 9
Illustration of the effect of the beam defocusing on the shape of photon multiplicity spectra measured for hydrogen ions of 18 keV. The total number of laser shots for the highest focusing is ≈8500 (top) while for the other two spectra this number is doubled. Defocusing leads to a reduced probability of multiple ion events but significantly prolongs the measurement time.
Figure 10
Comparison of different fits to photon multiplicity spectra. Two examples
are shown: hydrogen, 18 keV (left) and tungsten, 18 keV (right). The squares represent the measured data. The solid lines are likelihood fits including single and double ion events and backscattering of the ions. The dashed lines are fits without the backscattering effect while the dotted lines show the fits which include triple ion events and backscattering of the ions. The data point with zero photon counts is outside the range shown. The fit parameters are given in table 3.
Figure 11
Reduced energy deposition due to backscattered ions. A total of 10000 ions has been simulated with SRIM2003 package in each case. For each element the number of ion hits with a reduced energy deposition due to
backscattering is indicated in the upper left corners of the graphs.
Figure 12
Fit of measured spectra for oxygen (top), calcium (middle) and tungsten (bottom) ions. All spectra are measured with a 40µs time window.
Corresponding fit values of the mean number of pe− per single ion hit are O:
5.15±0.06 pe−,Ca: 2.78±0.07 pe− and W: 1.81±0.06 pe−.
Figure 13
Dependence of the quenching factor of CaWO4 on the atomic mass of selected elements. The squares are the data of the presented work. The neutron scattering result (shown as ×) also measured at room temperature is from [15]. The circles are from a measurement with a cryogenic detector at a temperature of 7 mK. The Pb value, (48.7±7.1), for an energy of
∼100 keV, is taken from [3], while the He value (5.70±0.01) is derivated from the 2.3 MeV α-peak in [3, Fig.7].
MCP (optional) crystal
PMT
second reflector
first reflector
LDI ion source
LASER
TOF - MS
1 m
~
collimator deflection
plates ion beam
deflectionX-Y plates
Einzel lens
Fig. 1 Ninkovic et al.
5mm Fig. 2 Ninkovic et al.
Fig. 3 Ninkovic et al.
PMT ions
crystal teflon reflector
grease collimator housing
Fig. 4 Ninkovic et al.
Fig. 5 Ninkovic et al.
Fig. 6 Ninkovic et al.
Fig. 7 Ninkovic et al.
Fig. 8 Ninkovic et al.
Fig. 9 Ninkovic et al.
Fig. 10 Ninkovic et al.
Fig. 11 Ninkovic et al.
Fig. 12 Ninkovic et al.
Fig. 13 Ninkovic et al.