Discussion Paper Series
Human Development Sector South Asia:
Attaining the Health and Education Millennium Development Goals in Nepal
February 2007
40992
Public Disclosure AuthorizedPublic Disclosure AuthorizedPublic Disclosure AuthorizedPublic Disclosure Authorized
Attaining the Health and Education Millennium Development Goals in Nepal
South Asia Human Development Sector South Asia Region
The World Bank
February 2007
Discussion Papers are published to communicate the results of The World Bank’s work to the development community with the least possible delay. The typescript manuscript of this paper therefore has not been prepared in accordance with the procedures appropriate to formally edited texts. Some sources cited in the paper may be informal documents that are not readily available.
The findings, interpretation, and conclusions expressed herein do not necessarily reflect the views of the International Bank for Reconstruction and Development / The World Bank and its affiliated organizations, or those of the Executive Directors of The World Bank or the governments they represent.
The World Bank does not guarantee the accuracy of the data included in this work.
The boundaries, colors, denominations, and other information shown on any map in this
work do not imply any judgment on the part of The World Bank concerning the legal status
of any territory or the endorsement or acceptance of such boundaries.
Contents
EXECUTIVE SUMMARY...I
1. Attaining the Millennium Development Goals in Education... 1
A. EDUCATION OUTCOMES:CURRENT STATUS AND TRENDS... 1
Quality of education...8
Learning outcomes...12
B. EDUCATION SECTOR POLICIES AND PROGRAMS:GOVERNMENT,PRIVATE SECTOR, AND HOUSEHOLDS... 13
Government...13
Private sector contribution ...20
Household spending on education ...20
C. POLICY DIRECTIONS... 22
REFERENCES... 24
2. Attaining the Millennium Development Goals in Health... 25
A. HEALTH OUTCOMES:PROGRESS AND PROSPECTS... 25
Infant and child mortality...26
Maternal mortality ...29
Infectious diseases: TB and HIV/AIDS ...32
B. FACTORS EXPLAINING PROGRESS IN HEALTH OUTCOMES... 32
Government...32
The private sector...43
Households...45
C. CHALLENGES FOR THE FUTURE... 48
REFERENCES... 50
Statistical Annex ... 52
BOXES Box 1.1: Secondary school enrollment and completion rates ... 7
Box 1.2: Conditional cash transfers ... 12
FIGURES Figure 1.1: Primary school net enrollment rates across countries ... 4
Figure 1.2: Primary school net enrollment rates across geographic regions and across per capita household expenditure quintiles ... 5
Figure 1.3: The main reasons for not attending school in 2003/04... 6
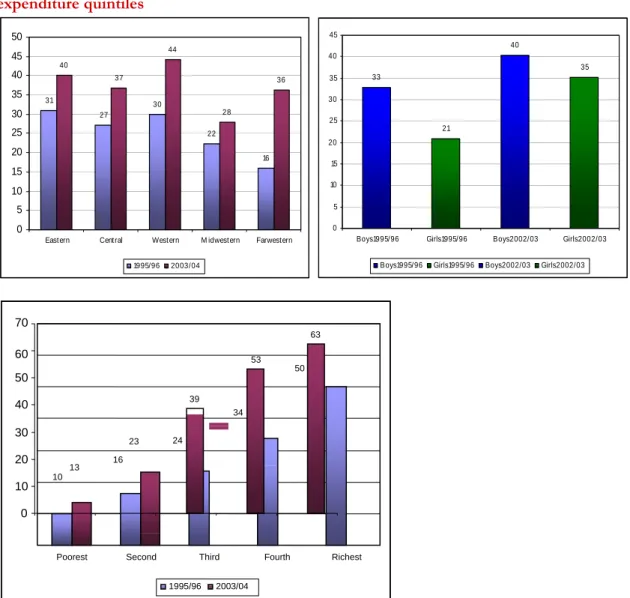
Figure 1.4: Primary school completion rates across regions and per capita household expenditure quintiles ... 9
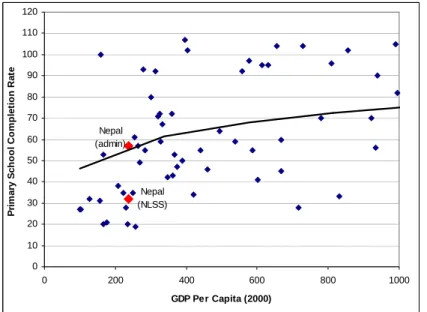
Figure 1.5: Primary school completion rates in low-income countries, by GDP per capita ... 10
Figure 1.6: Real public expenditure on education, in 1995 US dollars ... 14
Figure 1.7: Public expenditures on education as a percent of GDP against GNI per capita (US$) for countries with less than 10,000 GNI per capita ... 14
Figure 1.8: Benefit incidence of education expenditures by schooling level in Nepal (millions of current
NRS) ... 17
Figure 1.9: Distribution of educational expenditures in 1995/96 ... 21
Figure 2.1: Under-five mortality rate against GDP per capita (US$) ... 26
Figure 2.2: Under-five mortality across development regions in Nepal ... 26
Figure 2.3: Infant mortality rates against GDP per capita ... 28
Figure 2.4: Infant mortality rates across development regions in Nepal ... 28
Figure 2.5: Maternal mortality rates across GDP per capita ... 30
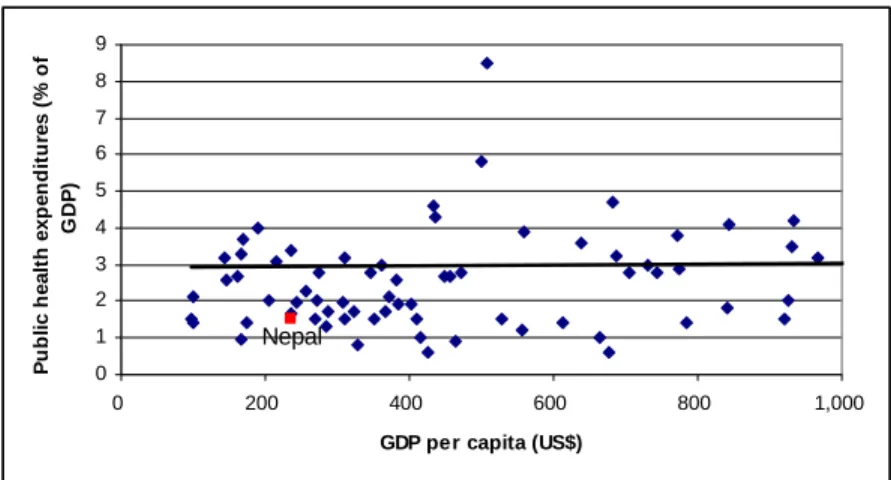
Figure 2.6: Public expenditure on health as a fraction of GDP per capita (US$) ... 33
Figure 2.7: Public expenditure on health, South Asian countries ... 33
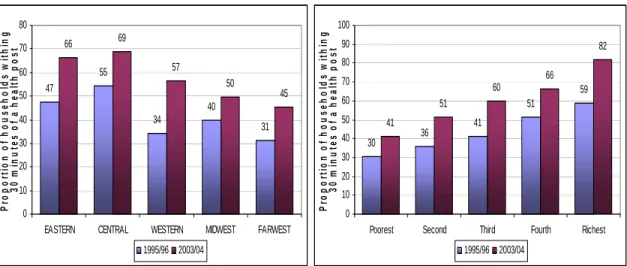
Figure 2.8: Percent of households within 30 minutes of the closest health post, across regions and household welfare quintiles ... 35
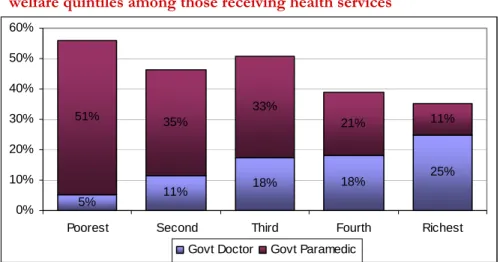
Figure 2.9: Use of government doctors and paramedics by household welfare quintiles among those receiving health services ... 36
Figure 2.10: Immunization rates for DPT3, polio3, and measles across regions in Nepal ... 37
Figure 2.11: Detection rate of all cases and treatment success rates of new smear-positive cases of TB, South Asian countries ... 38
Figure 2.12: Household facilities, 1995/96 & 2003/04... 39
Figure 2.13: Percent who sought healthcare for an illness or injury in the last month ... 40
Figure 2.14: Proportion of deliveries by doctors, other health professionals, ... 41
Figure 2.15: Density of physicians and nurses and midwives per 100,000 people, South Asian countries ... 42
Figure 2.16: Healthcare professional sought for care across regions and welfare quintiles ... 43
Figure 2.17: Use of healthcare facilities across regions and welfare quintiles ... 44
Figure 2.18: Proportion of total household expenditures allocated to healthcare expenditures across regions and welfare quintiles ... 45
Figure 2.19: Proportion of babies breastfed within the first hour of birth ... 46
Figure 2.20: Percentage of mothers who went for a prenatal checkup, by region ... 47
Figure 2.21: Percentage of mothers who went for a prenatal checkup, ... 47
Figure 2.22: Proportion of households reporting knowledge about means of preventing or spacing pregnancies, by region ... 48
TABLES Table S1: Progress towards the Millennium Development Goals (MDGs) Table 1.1: Basic information on schooling in Nepal... 2
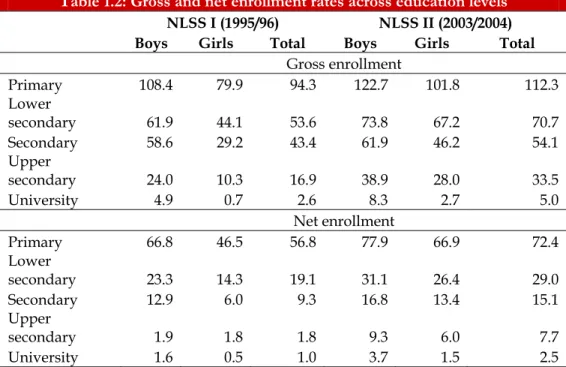
Table 1.2: Gross and net enrollment rates across education levels... 3
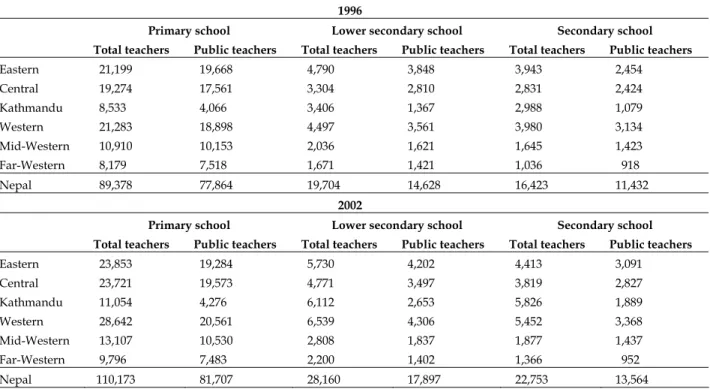
Table 1.3: The evolution of teaching strength across schooling levels and regions ... 15
Table 1.4: Regular and development expenditures ... 19
Table 2.1: HIV/AIDS in Nepal 2003 ... 32
Table 2.2: Budget performance by source and type of funding, 2003-04... 34
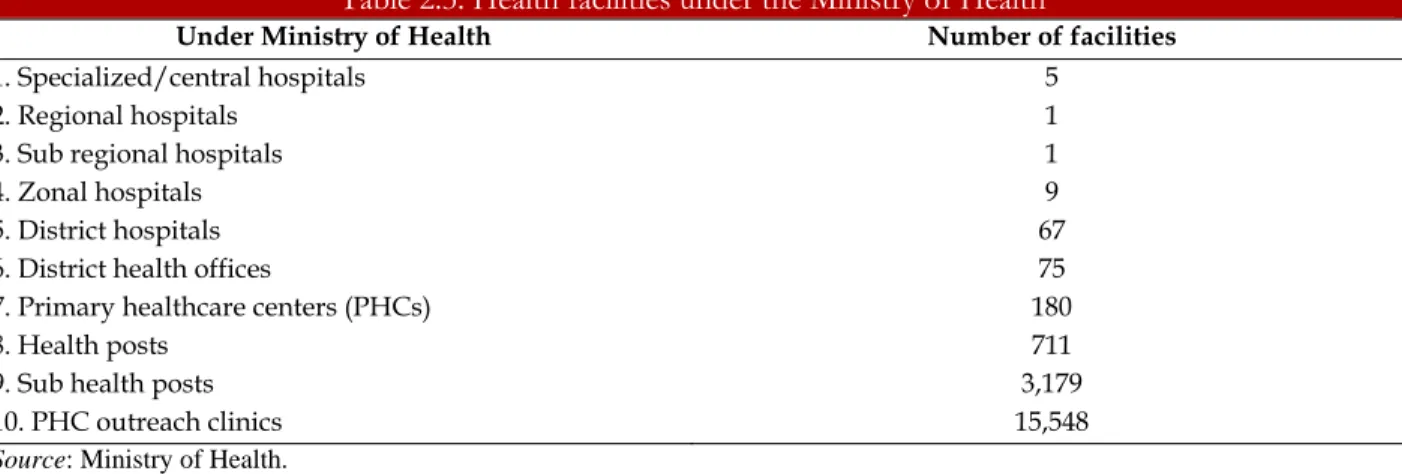
Table 2.3: Health facilities under the Ministry of Health ... 34
Table 2.4: Trends in deaths due to acute diarrheal diseases ... 39
Table 2.6: Distribution of healthcare professionals ... 42
Acknowledgements
This paper was prepared by Mohamed Ihsan Ajwad (Economist, SASHD) as a background paper
to the Nepal Poverty Assessment. The paper was written under the overall guidance of
Mansoora Rashid (Sector Manager, SASHD) and Julian F. Schweitzer (Sector Director,
SASHD). The paper benefited from contributions from Aparajita Goyal, Mikhail Bontch
Osmolovski, Elena Glinskaya, Maitreyi Das, Kiersten Johnson and Christine Allison. Comments
from Amit Dar, Nazmul Choudhury, Shantayanan Devarajan, Sundararajan Srinivasa Gopalan,
Rajendra Joshi, Jagmohan S. Kang, Tirtha Rana, Anabela Abreu, Michelle Riboud, Rosita Van
Meel, Shivanthi Gunasekera and Paul Gertler were helpful in preparing the paper. In addition,
we are thankful for useful feedback from workshop participants in Kathmandu and at the Clinic
organized by the Chief Economist of Human Development at the World Bank. Gertrude Cooper
provided excellent administrative and production support.
Abbreviations and Acronyms
ANM Auxiliary Nurse Midwife CMS Community Managed Schools DDC District Development Committees DEO District Education Officer
DfID Department for International Development, U.K.
DHS Demographic and Health Survey
DIMC Decentralization, Implementation and Monitoring Committee DPT Diphtheria, Pertussis and Tetanus Toxoids vaccine
GDP Gross Domestic Product GNI Gross National Income
IDA International Development Association IMR Infant Mortality Rate
MCHWs Mother and Child Health Workers
MDG Millennium Development Goal
MMR Maternal Mortality Rate MSM Men who have Sex with Men NER Net Enrollment Rate
NGOs Non-Governmental Organizations NLSS Nepal Living Standard Survey
NPC National Planning Commission NTC National Tuberculosis Center
NTP National Tuberculosis Control Program
ORS Oral Rehydration Salts
PHC Primary Healthcare Center PRSP Poverty Reduction Strategy Paper SLC School Leaving Certificate
SMC School Management Committees STI Sexually Transmitted Infection STD Sexually Transmitted Disease
U5M Under-Five Mortality
UNESCO United Nations Educational, Scientific and Cultural Organization TB DOT Tuberculosis Directly Observed Treatment
TBAs Traditional Birth Attendants VDCs Village Development Committees WHO World Health Organization
E
XECUTIVES
UMMARYLike almost all countries in the world, Nepal has committed itself to achieving the human development targets embodied in the Millennium Declaration by 2015. The eight time-bound goals specified in the declaration have received unprecedented acceptance by policymakers, academics, civil society, and the development community. The goals include halving income poverty and hunger; achieving universal primary education and gender equality in schooling; reducing infant and child mortality by two thirds and maternal mortality by three quarters; reversing the spread of HIV/AIDS; and halving the proportion of people without access to safe water. Most of the targets are to be achieved by 2015, from their levels in 1990.
The Millennium Development Goals 1: Eradicate extreme poverty and hunger
2: Achieve universal primary education
3: Promote gender equality and empower women 4: Reduce child mortality
5: Improve maternal health
6: Combat HIV/AIDS, malaria, and other diseases 7: Ensure environmental sustainability
8: Develop a global partnership for development
With less than a decade remaining to achieve the MDGs, there is an urgent need to assess achievements thus far and to understand the prospects and challenges for the future. This study seeks to contribute to that understanding by focusing on five of the major MDGs in Nepal related to education and health. In education, it focuses on universal completion of primary school and gender disparities in schooling. In health, it focuses on under-five mortality, maternal mortality, and the spread of diseases. The degree of quantitative analysis varies with data availability. The primary data sources used in the paper are: (i) unit record data from the 1996 and 2001 rounds of the Demographic and Health Survey (DHS); (ii) the two rounds of the Nepal Living Standards Survey (NLSS) (1995/96 and 2003/04); (iii) School Level Education Statistics of the Ministry of Education and Sports; and (iv) Ministry of Health administrative statistics.
Education
In the last decade, Nepal has made tremendous strides in broadening access to basic education. Since the mid-1990s, primary school enrollment has increased considerably, especially for girls, children in the poorest regions, and the lowest income groups. More Nepalese children are in school now than ever before. Today, primary school gross enrollment rates are 112 percent, up from 94 percent in the mid- 1990s. Similarly, net enrollment rates, which measure the extent to which children are enrolled at the age- appropriate level of schooling, increased from 57 to 72 percent between 1995/96 and 2003/04. If this pace of progress is maintained, Nepal is likely to achieve universal primary enrollment by 2015.
The increase in primary school net enrollments, driven by an increase in net enrollment rates for girls, has narrowed the disparities in enrollment rates across socioeconomic groups. Enrollment rates have increased sharply in the most backward regions of the country (the Mid-West and Far-West), reducing the enrollment gaps among regions. Enrollment rates across income groups and castes have narrowed as well. The poorer three income quintiles have realized larger gains in net enrollment rates than the richer two quintiles and there have been large increases in the net enrollment rates of Dalits, middle castes, and other Janajatis. However, significant socioeconomic and regional disparities persist in primary net enrollment rates and a concerted effort is needed to erase them.
Schooling remains poor. The challenge of educating children does not end with enrollment; it involves providing children with good schooling. Nepal’s school completion rates, a widely accepted yardstick of school quality and one of the goals of the MDGs, are low.1 Progress has been made over the last decade:
the proportion of children aged 11–13 completing primary school rose from 27 to 38 percent between 1995/96 and 2003/04. However, the gains are insufficient for Nepal to meet the MDG for school completion. Furthermore, despite a reduction in disparities across socioeconomic groups in the last decade, large regional, caste, and income disparities persist in primary school completion rates, and are far more pronounced than disparities in enrollment.
Considerable progress has been made in reducing gender disparities in school enrollment. The gender parity index for the net enrollment rate (that is, girls’ net enrollment rate as a percentage of boys’) improved from 70 to 86 percent over the study period. Good progress has also been made in gender parity in secondary and tertiary enrollment and also in the literacy rates of young adults. Assuming these trends continue, Nepal will achieve the MDG goal of gender parity for primary education well before 2015.
The gains to date reflect government commitment to reform, increased private provision of education, and increased household demand for education. The Government has shown its commitment by increasing the resources of the education system and the resulting expansion of schools and increased numbers of teachers have helped to raise enrollments. At the same time, the Government has implemented policies (stipends, etc.) to encourage the inclusion of poor children in the schooling system.
Expansion of private schooling in the urban areas and growth in household demand for education (a result of lower poverty rates and the cumulative effect of increases in female literacy) has also helped to raise enrollment.
To achieve the MDG of universal primary education within the next ten years, Nepal will need to reduce the number of out-of-school children, improve the education system, and continue to narrow the gaps across socioeconomic groups.
Getting almost a million children, who have either never enrolled in school or have dropped out of school, into school will require focused interventions. These interventions could include:
• Strengthening existing demand-side programs by targeting them more effectively. When cash- strapped families turn to child labor as a source of immediate disposable income, as happens in Nepal, conditional cash transfers can be used to lure these children back into school.
• Facilitating greater private sector involvement, possibly with incentives for poor students to attend private schools as currently piloted with textbook production and delivery.
1 Completion rates are ideally calculated using longitudinal data as the fraction of children who complete a level of schooling to the number of children who began that level of schooling. Since household surveys are essentially snapshots at a particular point in time, we define the completion rate as the proportion of children aged 11 through 13 who have completed primary school.
• Making schools more attractive to subgroups of out-of-school children, possibly by hiring female teachers and teachers familiar with special languages, ensuring that all schools have separate toilets for girls and boys, and ensuring a cordial and interactive relationship between school administrators/teachers and the community.
To improve the overall quality of primary schools, interventions could include:
• Continuing the shift towards community-managed schools—which has the potential to increase the accountability of schools to the communities they serve;
• Increasing the capacity for teacher certification and ensuring that effective teaching techniques are passed on to would-be teachers during their training;
• Upgrading school infrastructure and materials;
• Modernizing the curriculum to improve learning and increase the link from schooling to the labor market.
Efforts to increase enrollment and improve school quality can be streamlined with more rigorous and frequent evaluations to ensure that scarce public resources are being spent efficiently. Monitoring and evaluation with a feedback loop can lead to better program design and greater impact. Three areas in particular call for review: the targeted stipend program, the move from central management of schools to the community managed system, and the private production and delivery of textbooks. In addition, the prevailing disparities in education indicators across regions, castes, and gender highlight the need for more concentrated interventions to redress the inequities in human development.
Health
Nepal has achieved a sharp reduction in deaths among children between the ages of one and five, and has also made some progress in reducing infant mortality. However, there remains a lot of geographic variation both in under-five mortality and in rates of progress. If current rates of progress are maintained, Nepal is likely to attain the Millennium Development target for reducing under-five mortality by two thirds of its value in 1990, but it is unlikely to attain the target for reducing infant mortality (also by two- thirds). Further, not all regions are likely to achieve the child mortality MDGs, with the Eastern and Far- Western regions at particular risk of falling far short.
Unfortunately, data on Nepal’s maternal mortality ratios vary significantly depending on the source, making trend analyses difficult. But it appears that Nepal is not making sufficient progress in reducing the mortality of women at or around childbirth. Maternal mortality is among the highest in the world, with around 540 maternal deaths per 100,000 live births. Given that the health of a mother has a profound impact, not only for her but for her infants and children, her family, and society, there is an urgent need to address this health indicator.
Data limitations preclude a quantitative analysis of the prevalence of diseases in Nepal. Available information suggests that almost half the population of Nepal is infected with tuberculosis, but the incidence of TB and deaths due to TB are declining. Around 60,000 people are estimated to be living with HIV/AIDS. Thus far, HIV/AIDS is a concentrated epidemic, with especially high rates of prevalence among intravenous drug users, sex workers, and clients of sex workers.
Diverse factors have affected health outcomes in Nepal. Outside the health sector, increasing incomes, literacy, access to roads, and access to clean water and sanitation have played a vital role in the health of the Nepalese. Within the health sector, focused programs appear to have been particularly effective.
Coverage of immunization and vitamin A supplementation programs has sharply increased, including to some of the most remote parts of the country. Another focused intervention, namely the TB DOT (directly observed treatment—short course) program, has proved very successful in detecting and treating tuberculosis. The availability of health facilities has also risen considerably, from a low base a decade ago, but this availability has not increased the utilization of health services when household members are ill.
Current spending suggests a need for higher resource mobilization, but the money must be spent efficiently. Government spending on health is low in Nepal relative to that in other low-income countries (those with GDP per capita lower than US$1,000), and other countries in South Asia. These low expenditures are contributing to shortages of medicines and medical equipment and to the overall weak infrastructure, which in turn is leading to low utilization of health services. For example, skilled assistance during births is still relatively uncommon, and almost all births take place at home rather than in healthcare institutions. Needed improvements will require more resources for healthcare. These resources need to be allocated to regions whose health outcomes are lagging and to preventing and curing the diseases that account for a large share of the disease burden.
Disparities in healthcare access, measured by commute times, need to be reduced. Among the poorest 20 percent of households, fewer than half are within 30 minutes of a health post, while among the richest households more than 80 percent are within 30 minutes of a health post. To achieve greater equity in healthcare across Nepal, the Government will need to begin by addressing the deficiency of skilled human resources in remote parts of the country. Incentives, both financial and non-financial, will have to be provided to qualified medical personnel. Non-monetary incentives used in other countries include:
opportunities for training and career advancement, improved physical infrastructure of health facilities and residential facilities, and a staff transfer mechanism to ensure a fair deployment to unpopular areas.
The quality of healthcare must be upgraded. Nepal’s ongoing decentralization effort has the potential to improve healthcare by aligning the incentives of providers with the communities they serve. Increasing the accountability of healthcare professionals in this way can reduce absenteeism, increase effort, and improve provider-patient relationships. However, decentralization cannot take place without an efficient flow of funds, technical assistance, and knowledge sharing. These requirements are not always being met and a systematic and sustainable solution is clearly needed.
The private sector should contribute more to the provision of healthcare. Private providers already play an important role in healthcare in Nepal, but their contribution can be leveraged further by fostering better public-private partnerships. Specific measures could include: expanding accreditation and regulation, for instance, of traditional birth attendants (TBAs); creating an incentive system for TBAs and other delivery attendants to refer complicated deliveries to public medical facilities; and facilitating the private provision of primary healthcare.
Progress is needed, not only within the health sector itself but on multiple fronts. Policymakers must treat the health of the population as a top priority and should address the broad determinants of health.
Evidence from within Nepal and from international experience suggests that measures designed to increase incomes of households; literacy, especially of mothers; connectedness though road access; and access to water and sanitation make a significant impact on health outcomes.
Better monitoring and evaluation of healthcare provision is needed with respect to the MDGs. Reliable time-series data at the sub-national level are severely lacking for maternal mortality ratios, and for the incidence of HIV/AIDS and malaria. This constraint makes routine monitoring of health outcomes and impact evaluation of health interventions too imprecise. This issue must be addressed to ensure political commitment, government/donor resources, and to ensure that scarce public resources are being channeled into programs that deliver and are available in regions that most need them.
Table 1: Progress towards the Millennium Development Goals (MDGs)
MDG Nepal’s current position Prospects and issues
Achieve universal primary education by 2015.
Between FY95/96 and FY03/04, net enrollment rate (NER) of primary-aged children rose from 57% to 72%, as did youth literacy (56% to 73%). These significant gains bode well for meeting the primary enrollment MDG. Universal primary education also entails completion of primary school, for which rates have only risen marginally since 1995.
Quality of primary education remains a concern, as the system is characterized by high repetition rates, high dropout rates, and low completion rates. If current trends continue, universal education will not be attained. Although equity in education has improved, wide disparities remain across socioeconomic groups.
Make progress towards gender equity and empowering women by eliminating gender disparities in primary/secondary education by 2005.
Females account for most of the increase in literacy rates. Girl’s access to education has improved, and the gender parity index for net enrollment rate (ratio of NER of girls to boys) increased from 70 in FY95/96 to 86 in FY03/04.
Growth in school completion rates by girls has outpaced that for boys. If the trend continues, gender parity in primary education will be reached by 2010.
Reduce child mortality rates by two-thirds between 1990 and 2015.
Under-5 mortality fell sharply (at 5%
annually) from 118 to 91 between 95/96 and 03/04, mainly due to greater coverage in immunization, and disease prevention and treatment. The infant mortality rate has been declining at 3.7%
per year since the mid-1980s, with a drop from 79 per 1,000 live births in 95/96 to 64 in 03/04.
Given current trends, Nepal can attain the child mortality target. However, progress in reducing infant mortality has been slow and the rate will have to accelerate to meet the MDG. In addition, progress in reducing child mortality in the eastern and Far-Western regions has been slow, and these regions are unlikely to meet the MDGs.
Reduce maternal mortality rate by three- quarters between 1990 and 2015.
Maternal mortality remains high (539 per 100,000 live births in 1996). Fewer than 6 in 10 deliveries are assisted by skilled attendants.
Nepal’s maternal mortality is the highest in the region. Prospects of achieving the maternal mortality MDG are unclear due to lack of comparable time series data.
Have halted by 2015, and begin to reverse the spread of HIV/AIDs, and the incidence of malaria and other major diseases.
TB-related deaths have fallen from 15,000- 18,000 (1994) to 8,000-11,000 annually. TB cases have been declining (from 301 per 100,000 in 2000 to 258 in 2003). The prevalence of HIV/AIDS in the general population is unknown, although it has been estimated that 62,000 are living with HIV infection (2003). HIV/AIDS is a concentrated epidemic, with high incidence rates among intravenous drug users, sex workers, and STI (Sexually Transmitted Infection) patients.
Prospects for curbing TB are positive but face two challenges: (i) co-infection with HIV and TB cases could render detection and treatment more difficult; and (ii) increase in incidence of multi-drug resistant forms of TB. Data gathering and estimation of HIV/AIDS rates are still in their infancy, and the HIV/AIDS program lacks an appropriate institutional
mechanism with inter-sectoral involvement.
1. ATTAINING THE MILLENNIUM DEVELOPMENT GOALS IN EDUCATION
Like almost all countries in the world, Nepal has committed itself to achieving the human development targets embodied in the Millennium Declaration by 2015. For education, these goals include achieving universal primary education and school completion and ensuring gender equality at all levels, including in literacy. The impact of schooling on economic welfare and social well being is well known. Investment in schooling is an extraordinarily powerful instrument to enhance earnings, decrease poverty, and promote social mobility, to increase health, nutrition, and life expectancy, and to produce sustained, long- term human development. It is also self-reinforcing and self-perpetuating across generations, with educated parents exhibiting strong preferences for investing in schooling for their children.
This paper reviews what Nepal has achieved towards the MDG goals in education and describes the challenges remaining. The primary data sources used are (i) the two rounds of the Nepal Living Standards Survey (NLSS) (1995/96 and 2003/04); and ii) school-level education statistics of the Ministry of Education and Sports.
The paper finds that between 1995/96 and 2003/04 Nepal made tremendous gains in primary school enrollment for girls, the poorest regions, and the lowest income groups. These gains in participation were the result of government policies, private sector expansion, and increases in household demand for education. If these improving trends continue, and policies to enroll the nearly one million out-of-school children succeed, Nepal will achieve the MDG for universal primary enrollment by 2015. Similarly, if gains in secondary and tertiary enrollment and in literacy continue, Nepal should achieve gender parity at all levels of the education system, and in literacy, by 2015. The outlook for achieving universal school completion is less good: school completion rates have risen, but the level and trend rate of increase are not sufficient for Nepal to meet the MDG by 2015.
These results indicate that Nepal will need to improve the quality of its education system. Nepal is already moving in this direction through the introduction of community managed schools—which will increase the accountability of schools to the communities they serve. However, the success of this initiative, and of efforts to enroll the remaining out-of-school children will need to be stepped up.
The paper is organized as follows: Section A details the current state of Nepal’s MDG indicators and analyzes progress towards the goals; Section B describes the policies that have contributed to Nepal’s success, and policies that constrain its future achievements; and the final section outlines the challenges facing Nepal in achieving the education MDGs.
A. E
DUCATIONO
UTCOMES: C
URRENTS
TATUS ANDT
RENDSNepal’s education system comprises primary, lower secondary, secondary, and higher secondary school.
Most schools are public, though the number of private schools has grown in recent years, particularly in
urban areas. Students in primary school are supposed to begin grade 1 at age 6 and to complete grade 5 by age 10. Thereafter, the duration of lower secondary school is three years and secondary and upper secondary schools take two years each. After completing 10th grade, students take the national school leaving certificate (SLC) examination. The further levels of schooling include higher secondary, university, and professional degrees.
More than 26,000 schools serve the more than 3 million pupils studying in the primary level in Nepal (Table 1.1).2 Lower secondary schooling is available in fewer than 8,000 schools and secondary schooling is available in only 4,500 schools around the country. For every teacher, there are about 28, 42, and 22 pupils in primary, lower secondary, and secondary school, respectively.
Table 1.1: Basic information on schooling in Nepal
Primary Lower Secondary Secondary
Official age 6 – 10 11 – 13 14 - 15
Number of schools 26,638 7,917 4,541
Number of teachers 111,027 28,571 23,028
Number of students (x1,000) 3,074 1,188 496
Students per school 115.4 150.1 109.2
Students per teacher 27.7 41.6 21.5
Teachers per school 4.2 3.6 5.1
Source: Ministry of Education, Government of Nepal (2004).
Primary school enrollment
This section reviews Nepal’s progress towards achieving the MDG of universal primary enrollment. The results show that Nepal has made impressive gains in enrollment, narrowing disparities across regions, household welfare groups, and gender. Provided this trend continues, Nepal should be able to meet the MDG of universal primary enrollment, as well as the goals for gender equality at all levels of the education system, with the exception of preschools, by 2015.
Aggregate level and trends
More children are in school in Nepal now than ever before. Nepal has made impressive progress in gross enrollments in the last few decades.3 By 2003/04, gross enrollment rates were 112 percent in primary school, and 71, 54, and 33 percent respectively in lower secondary, secondary, and upper secondary school.
Nepal has also made impressive gains in the net primary enrollment rate. While gross enrollments are a measure of total number of children enrolled at a given level of schooling, the net enrollment rate measures the extent to which children are enrolled at the age-appropriate level of schooling. As such, net enrollment rates are a better indicator of the performance of the education system. Table 1.2 shows that over the last decade, net primary enrollment rates have increased significantly in Nepal at all levels of the system. Net enrollment rates in primary school increased from 57 to 72 percent between 1995/96 and
2 Other levels of schooling may also be available at schools serving the primary level. As a result, the total number of schools in Nepal is smaller than the sum of the schools that provide primary, lower secondary, and secondary level schooling.
3 Gross enrollment is the ratio of total enrollment in a given level of schooling to the total number of children of the official age. Gross enrollments can be greater than 100 percent. Net enrollment is the ratio of enrollment by children of the official age in a given level of schooling to the total number of children of the official age. We focus here on the net enrollment rate, because this is one of the indicators of progress identified in the MDGs.
2003/04. Assuming continued progress along these lines, Nepal should achieve universal primary enrollment by 2015.
Table 1.2: Gross and net enrollment rates across education levels NLSS I (1995/96) NLSS II (2003/2004)
Boys Girls Total Boys Girls Total
Gross enrollment
Primary 108.4 79.9 94.3 122.7 101.8 112.3
Lower
secondary 61.9 44.1 53.6 73.8 67.2 70.7
Secondary 58.6 29.2 43.4 61.9 46.2 54.1
Upper
secondary 24.0 10.3 16.9 38.9 28.0 33.5
University 4.9 0.7 2.6 8.3 2.7 5.0
Net enrollment
Primary 66.8 46.5 56.8 77.9 66.9 72.4
Lower
secondary 23.3 14.3 19.1 31.1 26.4 29.0
Secondary 12.9 6.0 9.3 16.8 13.4 15.1
Upper
secondary 1.9 1.8 1.8 9.3 6.0 7.7
University 1.6 0.5 1.0 3.7 1.5 2.5
Source: World Bank staff estimates using NLSS 1995/96 and 2003/04.
Primary school net enrollment rates in Nepal are comparable with those in other South Asian and low- income countries). The rate in Nepal is higher than in Pakistan (49), India (53), and Bangladesh (65), but lower than in Sri Lanka (96 percent). 4
Nepal’s net enrollment rates remain low in all other levels of education. Net enrollment rates are only 29, 15, and 8 percent in lower secondary, secondary, and upper secondary schools, respectively, (Tables A7, A8, and A9). Tertiary enrollment rates are even lower, with only 2.5 percent of the university age population enrolled (Table A10).
4 World Bank (2005). These enrollment rates are calculated using household data.
Nepal
0 10 20 30 40 50 60 70 80 90 100
0 200 400 600 800 1000
GDP per capita (US $)
Primary school net enrollment rates
Figure 1.1: Primary school net enrollment rates across countries
Sources: World Bank for NERs in all countries except Nepal. NER for Nepal is computed from NLSS II
Primary school net enrollments
The increase in primary school net enrollments has narrowed gender, wealth, and geographic disparities in enrollments. The primary driving force of this improvement has been the increase in NERs for girls. The gender parity index for the NER (that is, the ratio of the NER of girls to that of boys) increased from 70 to 86 percent between 1995/96 and 2003/04. Assuming this trend continues, Nepal will achieve the MDG goal of gender parity in primary education by 2010. Enrollment rates have increased sharply in the most backward regions of the country5 (the Mid-West and Far-West), reducing the enrollment gap between regions (Figure 1.2).6 Enrollment gaps across income groups and castes have narrowed as well: the poorer 60 percent of the population have achieved larger gains in NERs than the richer 40 percent, and large increases have taken place in the NERs of Dalits, middle castes, and other Janajatis.
Even so, significant socioeconomic and regional disparities in primary NERs persist in Nepal. The gap between the NER of the poorest (56 percent) and top quintile (84 percent) is still very large (Figure 1.2).
Regional disparities are still evident. Interestingly, the NER ranges from 85 percent in the relatively poor Western region to 62 percent in the relatively rich Central region. And though the gender gap has narrowed, the net enrollment rate for girls (67 percent) is still much lower than for boys (78 percent).
Multivariate analyses are needed to understand why children do or do not attend school. Since multiple factors affect enrollment decisions simultaneously, multivariate regression can isolate the factors that affect the probability of enrollment, holding other factors constant. These factors include those that affect the supply of education (e.g., distance to school) and the demand for education (e.g., permanent income, education of parents). International evidence suggests that supply side factors, measured by the distance to school or the presence of a school in the village, significantly determine school enrollments.7 On the
5 The regions of Nepal arrayed from the highest to the lowest poverty rates are the Mid-Western (45%), Far-Western (41%), Eastern (29%), Western (27%), and Central (27%).
6 The coefficient of variation has decreased from 0.16 to 0.12. Here, the coefficient of variation is calculated by dividing the standard deviation of the NERs across regions by the average NER across regions.
7 See Filmer (2000) for a multi-country analysis of school enrollments using DHS data, including the 1996 Nepal DHS.
demand side, factors such as geography, gender8, and the education of adults in the family all generally play an important role in determining school enrollment.
Figure 1.2: Primary school net enrollment rates across geographic regions and across per capita household expenditure quintiles
59
51
70
52
47 74
62
85 80
74
0 10 20 30 40 50 60 70 80 90
EASTERN CENTRAL WESTERN MIDWEST FARWEST 1995/96 2003/04
38
48
62
70
77
56
68
81 82 84
0 10 20 30 40 50 60 70 80 90
Poorest Second Third Fourth Richest 1995/96 2003/04
67
46
78
67
0 10 20 30 40 50 60 70 80 90
Boys Girls Boys Girls
1995/96 2003/04
1995/96 Boys 1995/96 Girls 2003/04 Boys 2003/04 Girls
Source: World Bank staff estimates using NLSS 1995/96 and 2003/04.
Individual level data from the NLSS 2003/04 indicate that both demand and supply factors affect household decisions to enroll their children in school.9 Results from the analysis are summarized below (also see Table A12 in the statistical annex):
From a supply perspective, households with easy access to schools are more likely to enroll their children in primary school. Distance to school is not an important determinant of enrollment in lower secondary and secondary school, however. The implication is that parents are uncomfortable sending young children long distances to school, but are more willing to do so as the child grows older.
8 Filmer (2000) finds that gender gaps in South Asia are particularly pronounced, putting women at a great disadvantage.
9 A probit model of enrollment in primary school is estimated for all 6 to 10 year olds in Nepal. See Maddala (1983) for a description of probit models. See also New Era (2004) for the determinants of net primary school enrollment in Nepal.
From a demand perspective, several factors increase the probability that a child will be enrolled in school:
• Higher-income children are more likely to attend school than poorer children. This is not surprising, as the direct and indirect costs associated with school attendance can be prohibitive for poorer households relative to the benefits, which are generally observable only in the longer term.
• Children of educated parents/literate household heads are more likely to attend school than children of uneducated parents/or illiterate household heads.10 This finding of a strong influence of parental education emphasizes the reality that intergenerational socioeconomic mobility is more the exception than the rule.
• Caste matters. Hindu upper caste children are more likely to be enrolled in school than are children of the Hindu middle castes, Hindu Dalits, and religious minorities.
• Intra-household dynamics play an important role in decisions to enroll children in school. The presence of female siblings (vs. no sibling) appears to raise the probability of primary school attendance for boys. The likely explanation is that female children assist with the household chores, increasing the probability that their male siblings attend school. The probability of girls attending school is not affected by the presence/absence of a male sibling
•
Geography matters. Compared to the Eastern region, children in the Central region (low poverty) are less likely to be enrolled in primary school, while children in the Western region (or high poverty) are more likely to be enrolled in primary school.
Why do many children never attend school? The results above show that children, particularly girls, from low income, low caste, and less educated families, living in areas where schools are distant, are less likely to attend school. The main reasons why children do not attend are: (i) low income (many households cannot afford to send their children to school), (ii) unwillingness of children to attend school, and (iii) unwillingness of parents to send children to school. However, these households do not cite the absence of a school, or the belief that education is not useful, as reasons for not sending their children to school (Figure 1.3). The main reason for never sending their children to school is the parents’ inability to afford the direct costs (fees, etc.) and the indirect costs (of releasing children from work at home). These reasons for never attending school broadly remained the same between 1995/96 and 2003/04.
Figure 1.3: The main reasons for not attending school in 2003/04
Too expensive, 22%
Too f ar aw ay, 7%
Had to help at home, 13%
Parents did not w ant, 15%
Not w illing to attend, 20%
Other, 21%
Source: World Bank staff estimates using NLSS 2003/04.
10 This finding is also documented in Filmer (2000) using the NLSS 1995/96 data.
Summary
Nepal has made significant gains in net enrollment rates, narrowing disparities across regions, castes, income groups, and particularly gender. If current rates of progress are maintained, Nepal is on track to meet the primary school enrollment MDG. Nepal is also likely to attain gender parity before 2015. It is striking that these enrollment gains took place during a time of political insurgency in the country.
However, further increases in primary enrollment will require reducing the distances to school and also reducing the direct and indirect costs of schooling for poor, low caste girls with less educated/illiterate parents. Particular attention will need to be paid to rural areas and the Central region.
Box 1.1: Secondary school enrollment and completion rates
Improvements in secondary school enrollments are not an MDG goal. However, increasing enrollment and quality of secondary school, particularly its relevance to the labor market, is the next challenge for Nepal.
Enrollment rates: Lower secondary and secondary NERs have also increased over the last decade (Tables A7 and A8 in the statistical annex). Girls’ enrollment has grown almost twice as fast as boys’.
Geographically, the big winner has been in one of the poorest regions (Far-Western). These improvements in NERs have dramatically narrowed the geographic disparities in secondary school NERs.a From a welfare perspective, however, the gains have not been pro-poor; they have been concentrated in the middle and upper quintiles of the population.
Despite these improvements, secondary school NERs are low relative to primary school NERs and significant inequalities exist across geographic regions, castes, and household welfare levels. Fewer than three in ten children of the lower secondary school official age are attending school, and about one in seven children of the secondary school official age attend school. Geographic disparities are large: lower secondary NERs in the Mid-Western region are about 12 percentage points lower than those in the Western region. Across household welfare quintiles, the disparity in NERs is very pronounced. For instance, lower secondary school NERs among the richest households are more than seven times the NERs in the poorest households. Muslims and Dalits have below average lower secondary and secondary school NERs. Gender disparities for secondary school also remain, but are small in comparison (17% boys and 13% girls). However, if current rates of progress are maintained, then Nepal can expect to achieve gender parity in lower secondary and secondary school.
The determinants of enrollment in lower secondary and secondary school confirm many of the bivariate relationships discussed earlier (Table A12). Geography, caste, gender of child, parents’
education, and household per capita expenditures all matter. Interestingly, commute time to school does not significantly determine enrollment in lower secondary or secondary school enrollment, which differs from the findings of primary school. The implication is that parents are uncomfortable sending their children long distances to primary schools, but are more willing to do so as the child grows older. Compared to children in the Eastern region, children in the Central and Mid-Western regions are less likely to be enrolled.
Completion rates: There has been a sizable increase in lower secondary and secondary school completion, with completion rates for girls doubling in the last decade (Tables A14 and A15). By far, the Far-Western, or poorest, region has increased its completion rates the most. Interestingly, the improvements have not been pro-poor, though, with standout improvements for children from quintiles 3 and 4, respectively.
Lower secondary and secondary school completion rates remain extremely low. Only one in four children who start lower secondary school complete it and only one in seven who start secondary school complete it. Secondary school completion is also highly sensitive to: geography, with the Central region showing completion rates 3 times higher than the Far-Western region; household welfare level and castes, with fewer than 2 percent of children from the poorest quintile and Muslim background completing secondary school relative to the 38 percent from the richest quintile and 41 percent of Newar children.
The determinants of lower secondary and secondary school completion are not substantively different from the determinants of primary school completion (Table A18). Again holding all else constant, richer children, with more educated parents, of higher castes, from urban areas are more likely to complete these levels of schooling, while children from the Far-West are less likely to complete secondary school.
____________________
a With the coefficient of variation of lower secondary NER decreasing from 0.31 to 0.17 between 1995/96 and 2003/04 across the regions.
Quality of education
The challenge of educating children does not end with enrollment; the harder task for the education system is to ensure that children progress through school and acquire age-appropriate knowledge at each level of the educational system. This section reviews the available quality indicators for the education system.
The gains in enrollments noted in the previous section have been accompanied by improvements in school quality, as measured by school completion rates. Despite the gains, however, completion rates remain quite low in Nepal, and if current trends continue, Nepal is unlikely to meet the MDG of school completion. It should be noted that Nepal has made gains in improving the basic literacy rates of young adults, and, under current trends, is likely to meet the MDG for gender equality in literacy by 2015.
Primary completion rates
Primary school completion rates have risen from 27 to 38 percent (Table A13). Thus, only just over a third of students complete primary school within three years of the official age (i.e., between 11 and 13).
There are two main reasons why. First, children drop out before completing grade 5. Second, children finish primary school very late, after age 13, possibly due to high repetition rates, frequent breaks from schooling, or simply because they start school at a late age.
Primary school completion rates have improved in all regions and castes, for girls, and for all household welfare groups (Figure 1.4). The highest growth rates in completion rates are observed in the Far-Western region and for households in the middle and upper quintiles. In each case, the growth in girls’ completion rates far outpaces the growth in boys’. However, the growth in completion rates has benefited quintiles 3, 4, and 5 more than poorer households.
Figure 1.4: Primary school completion rates across regions and per capita household expenditure quintiles
31
27
30
22
16 40
37
44
28
36
0 5 10 15 20 25 30 35 40 45 50
Eastern Central Western M idwestern Farwestern
1995/96 2003/04
33
21
40
35
0 5 10 15 20 25 30 35 40 45
Boys1995/96 Girls1995/96 Boys2002/ 03 Girls2002/03
Boys1995/96 Girls1995/96 Boys2002/03 Girls2002/03
Note: Completion rates are ideally calculated using longitudinal data as the fraction of children who complete a level of schooling to the number of children who began that level of schooling. Since household surveys are essentially
snapshots at a particular point in time, we define the completion rate as the proportion of children aged 11 through 13 who have completed primary school.
Source: World Bank staff estimates using NLSS 1995/96 and 2003/04.
There exist large regional, caste, and income disparities in completion rates. The primary school completion rates are far lower in the Mid-West than in other regions, and rural completion rates are much lower than urban completion rates (Table A13). Children from higher-income households also have higher completion rates than children from poorer households. The rate of completion for non-poor children is nearly five times greater than for children from poor households. Similarly, children from the Chhetri and Newar castes have on average higher completion rates.
Comparisons of primary school completion rates across countries are very difficult because consistent data are not available. Administrative data on primary school completion rates suggest that Nepal’s
10
16
24
34
50
13
23
39
53
63
0 10 20 30 40 50 60 70
Poorest Second Third Fourth Richest
1995/96 2003/04
completion rate of 57 percent is in line with those of other South Asian countries (Figure 1.5).11 However, the completion rate of 32 percent shown by the household data is low relative to those of neighboring South Asian countries. Completion rates calculated using household data range from 95 percent in Sri Lanka to 66 percent in Bangladesh, 61 percent in India, and 51 percent in Pakistan.12
Figure 1.5: Primary school completion rates in low-income countries, by GDP per capita
Nepal (admin)
Nepal (NLSS)
0 10 20 30 40 50 60 70 80 90 100 110 120
0 200 400 600 800 1000
GDP Per Capita (2000)
Primary School Completion Rate
Source: World Bank for NERs in all countries except Nepal. NER for Nepal is computed from NLSS II.
Determinants of primary school completion (Table A18). To better understand the factors that determine primary school completion, a multivariate probit model for school completion is estimated.13 The results show that:
• Access to schooling, as measured by the time taken to go to school, is a significant factor affecting enrollment. But conditional on being in school, it doesn’t appear to have an additional impact on completion rates.
• Children from higher income (and better educated) households are more likely to complete all levels of schooling than poorer children.
• Caste plays a vital role in school completion rates. The probability of primary school completion is significantly lower for Hindu middle, Hindu Dalits, Janajati-hill, Janajati-terai, and religious minorities than for Hindu upper class children.
11 An important caveat here is that administrative data on completion rates are calculated using the ratio of all students who complete primary school regardless of the age at which they complete that schooling level to the population of students who started that level of schooling. Household survey data, on the other hand, computes completion rates as the proportion of a particular age bracket that has completed primary school.
12 World Bank (2005).
13 A number of the bivariate relationships to school completion discussed above hold in a multivariate setting as well.
We estimate a probit of the probability of school completion for children aged 11 to 13 for primary, 14 to 17 for lower secondary, and 16 to 19 for secondary. The determinants are chosen from an extensive array of student, family, and regional characteristics.
•
Girls are less likely to complete primary school than boys, regardless of whether or not they have siblings.Dropouts and repetitions
As noted above, only a third of 11 to 13 year olds have completed primary school in Nepal.
Completion rates are low because children drop out before finishing the five years of schooling required or because of delays, for example caused by high repetition rates.
More than one in six children who begin grade 1 drop out of school in that year (Table A20).14 The highest dropout rates in Nepal occur between entering school and grade 1 and in grade 5, respectively.
The costs of schooling to households are an important reason why children drop out of school.
Qualitative results from the NLSS 2003/04 survey indicate that the main reasons why children drop out of primary school are the high direct costs (fees, uniforms, text books, etc.) and indirect costs (in terms of work forgone within or outside the household) of schooling, or that parents do not want to send their children to school. Interestingly, girls and boys drop out for different reasons. For boys, the main reason is poor academic progress, followed by the high direct costs of schooling. For two thirds of girls, the need to help at home or cultural factors (their parents no longer want them to attend school) are the main reasons.
Repetition rates in Nepal’s primary schools are high relative to those in other countries in the region.15 In grade 1, which has the highest repetition rate, almost 40 percent of students repeat the school year.
Average repetition rates in Nepal are around 22 percent, much higher than in India, Bangladesh, and Bhutan (whose repetition rates are 4, 6, and 13 percent respectively).16,17 High repetition rates are caused, in part, by low readiness for school (particularly in grade 1)18, but also by poor instruction. High repetition rates strain the capacity of schools to absorb out-of-school children and also increase dropout rates because repeaters are more likely to drop out of school.
Summary
While completion rates have improved in Nepal, they remain low relative to those of other countries in the region. Reducing the number of dropouts and repeaters19 will require looking closely at teacher quality, student performance, and readiness, particularly for grade 1. In addition, since dropouts are partly the result of the high costs of education, particular attention will be need to be paid to allaying the direct and indirect costs of going to school -- through, for example, conditional cash grants (Box 1.2).
Boys with weak academic performance will need particular focus, as will girls, particularly from poor and low caste households.
14 There was no change in this dropout rate between 1995/06 and 1998/99.
15 Nepal’s repetition rate is defined as the proportion of pupils enrolled in a given grade in a given school year who study in the same grade in the following school year, as reported in Ministry of Education, Government of Nepal (2004). Other data on repetition rates are reported in UNESCO (2003).
16 UNESCO (2003).
17 However, caution must be exerted in comparing repetition rates across countries or even across regions in a country. These measures of internal efficiency depend crucially on the standards applied in the school for advancing grades. Some schools may be satisfied with minimum levels of attendance, while others might be more interested in examination scores.
18 Two factors contributing to low readiness are: (i) almost a quarter of the students starting primary school do so at age five, which may be too young for some children; and (ii) too few students have gone though an early childhood development program, which greatly increases a child’s ability to cope with the primary school program.
19 The promotion rate is the proportion of pupils promoted to the next grade in the next year. It is generally a grade- to-grade transition, rather than a transition from one level of schooling to another level.
Box 1.2: Conditional cash transfers
Several countries provide cash transfers conditional on attendance in school. Two prominent examples are the Progresa program in Mexico and the Food-for-Education program in Bangladesh.
A key goal of Progresa is to increase secondary school enrollment (primary school enrollment in Mexico is already high at 93 percent for the poor), especially for girls (Wodon and others 2003). Educational grants are provided to promote enrollment, and subsequent grant payments are made conditional on minimum attendance levels, as reported by school teachers. Targeting is achieved by first identifying marginal communities the census and health/education ministry data. Once eligible communities are identified, a survey is fielded to all households to separate the poor from the non-poor households using a principle components analysis. Thereafter, the community then has the opportunity to adjust the list of beneficiaries for inclusion or exclusion errors. Households then have the option to participate in the program.
A unique feature of the Progresa program is that data for program evaluation are readily available and hence, multiple evaluations of the impact of the program have been conducted by independent researchers. This openness to evaluations reflects a deliberate attempt by the designers to ensure that lessons learned could be fed back into the system and also to ensure that good evaluations will force governments to persist with the program, rather than be tempted to “revamp and redesign” programs with the political cycles. Most impact evaluations show that the number of years of schooling for both boys and girls has increased significantly.
Bangladesh’s food-for-education program was implemented to keep children from poor rural families in school by reducing the incentives for child labor (Ravallion and Wodon 1999). The program offers a stipend to households that participated as long as the condition of 85 percent of primary school attendance each month is met. Targeting is achieved by first identifying economically backward areas and then gathering information from community groups regarding eligible households based on idiosyncratic information. Studies on the effectiveness of the program show that stipends considerably less than the mean child wage are sufficient to ensure close to full attendance by households that participate in the program.
Learning outcomes Literacy
Literacy rates among Nepal’s young adults improved tremendously between the mid-1990s and the early 2000s (Table A19). Basic literacy is an important goal of the primary school system. The proportion of people aged 15 to 24 who can read and write a letter rose from 56 percent to 73 percent between 1995/96 and 2003/04. Although literacy is a measure of actual knowledge, unlike enrollments or even completion, literacy is difficult to assess, and hence is susceptible to large measurement errors. In the case of the NLSS, for example, the interviewer asks the respondent whether they can read a letter and whether they can write a letter. If the answer to both questions is yes, then the respondent is assumed to be literate. Two obvious problems with this approach are that respondents may feel embarrassed to admit to being illiterate in front of family members or the enumerator, and that a large variance in reading and writing ability simply gets recorded as a yes or no.
Literacy rates have improved across geographic regions, per capita household expenditure quintiles, gender, and castes (Table A19). The 15 to 24 year olds in the poorer Far-Western and Mid-western
regions have experienced a considerable increase in literacy rates since the mid-1990s. Literacy rates for the poorest household quintile improved significantly, rising from 34 to 48 percent between 1995/96 and 2003/04. Finally, women were among the biggest beneficiaries of the overall increase in literacy rates, raising their literacy rate by 5.3 percent a year to almost 63 percent. If the trend continues at this rate, gender parity in literacy will likely be achieved before 2015.
Standardized exams
While the school system is able to teach basic literacy, results from standardized exams for grade 10 -- another proxy for what knowledge is gained from school -- indicate that the learning outcomes in the public school system are quite weak. The school leaving certificate (SLC) pass rates of public school students are quite low, at 25 to 35 percent. Students from private schools perform much better, with average pass rates of 75 percent.20
B. E
DUCATIONS
ECTORP
OLICIES ANDP
ROGRAMS: G
OVERNMENT, P
RIVATES
ECTOR,
ANDH
OUSEHOLDSThis section reviews the factors that have contributed to the significant gain in school enrollment in Nepal, as well as those that constrain improvements in quality.
Government
Education is a priority in Nepal and the Government is committed to improving both coverage and quality. Evidence of this commitment to education is presented in the Government’s main poverty reduction strategic plans, namely the Poverty Reduction Strategy Paper (PRSP) and the 10th Five Year Plan documents.
Public finance
Not only have priorities been articulated, but funding for education has consistently increased in the last two decades (Figure 1.6 ). Specifically, education spending has increased from 9 percent in the early 1980s to recent estimates of 15 percent of the national budget, and approximately 3.5 percent of GDP is allocated to the education sector (Ministry of Education, Government of Nepal, 2002). This makes education the largest sub-sector in the government. In addition, education expenditures feature as a top priority in the government’s medium-term expenditure framework, indicating continuing commitment to this sector.
20 World Bank (2004a).