Repor-t No. 37839
SouthAsia Human Development Sector
Attaining the Millennium Development Goals in Pakistan
How Likely and What Will it Take to Reduce Infant Mortality, Child Malnutrition, Gender Disparities and to Increase School Enrollment and Completion?
May, 2005
U
Discussion Paper Series
Public Disclosure AuthorizedPublic Disclosure AuthorizedPublic Disclosure AuthorizedPublic Disclosure Authorized
ATTAINING THE MILLENNIUM DEVELOPMENT GOALS IN PAKISTAN
How Likely and What Will it Take to Reduce Infant Mortality, Child Malnutrition, Gender Disparities
and to
Increase School Enrollment and Completion?
South Asia Human Development Sector South Asia Region
The World Bank
May 2005
ABBREVIATIONS AND ACRONYMS
CCT Conditional Cash Transfers
CPRID Center for Poverty Reduction and Income Distribution CWIQ Core Welfare Indicators Questionnaire
DHS Demographic and Health Survey
ESR Education Sector Reforms
FATA Federally Administered Tribal Areas
FBS Federal Bureau of Statistics
GER Gross Enrollment Rate
GDP Gross Domestic Product
GOP Government of Pakistan
HD Human Development
IMR Infant Mortality Rate
LHW Lady Health Workers
MCH-FP Maternal & Child Health - Family Planning
MD Millennium Development
MDG Millennium Development Goal
NER Net Enrollment Rate
NNS National Nutrition Survey
NRB National Reconstruction Bureau
NWFP North West Frontier Province
PIDE Pakistan Institute of Development Economics PIHS Pakistan Integrated Household Survey
PRHFS Pakistan Reproductive Health and Fertility Survey
PRHS Pakistan Rural Household Survey
PSES Pakistan Socio-Economic Survey
SAP Social Action Program
U5MR Under-Five Mortality Rate
UPE Universal Primary Education
The World Bank 1818 H Street N.W. (202) 473-1000
INTERNATIONAL BANK FOR RECONSTRUCTION AND DEVELOPMENT Washington, D.C. 20433 Cable Address: INTBAFRAD
INTERNATIONAL DEVELOPMENT ASSOCIATION U.S.A. Cable Address: INDEVAS
June 28, 2005
Pakistan: Attaining the Millennium Development Goals in Pakistan Corrigendum
The text below was inadvertently left out of Report No. 8, Discussion Paper Series, South Asia Human Development Sector, entitled "Pakistan: Attaining the Millennium Development Goals in Pakistan - How Likely and What Will it Take to Reduce Infant Mortality, Child Malnutrition, Gender Disparities and to Increase School Enrollment and Completion?"
Discussion Papers are published to communicate the results of The World Bank's work to the development community with the least possible delay. The typescript manuscript of this paper therefore has not been prepared in accordance with the procedures appropriate to formally edited texts. Some sources cited in the paper may be informal documents that are not readily available.
The findings, interpretations, and conclusions expressed herein do not necessarily reflect the views of the International Bank for Reconstruction and Development / The World Bank and its affiliated organizations, or those of the Executive Directors of The World Bank or the governments they represent.
The World Bank does not guarantee the accuracy of the data included in this work. The boundaries, colors, denominations, and other information shown on any map in this work do not imply any judgement on the part of The World Bank concerning the legal status of any territory or the endorsement or acceptance of such boundaries.
ACKNOWLEDGEMENTS
This Discussion Paper was prepared by Anil B. Deolalikar (Consultant, SASHD), with analytical inputs from G. M. Arif and Faiz Bilquees of the Pakistan Institute of Development Economics (consultants), Shahnaz Kazi (SASHD); assistance from Amna Mir (SASHD); and under the overall guidance of Julian F. Schweitzer (Sector Director, SASHD), Mansoora Rashid (Sector Manager, SASHD), John Wall (Country Director for Pakistan), and Rasmus Heltberg (TTL, SASHD). Comments from Manuela Ferro, Inaam Haq, Rasmus Heltberg, Kseniya Lvovsky, Zareen Naqvi, Ambar Narayan, Miria Pigato, Tahseen Sayed, Tara Vishwanath, and Salman Zaidi were helpful in revising the document.
CONTENTS
EXECUTIVE SUMMARY 1. INTRODUCTION
THE MILLENIUM DEVELOPMENT GOALS METHODOLOGY, DATA, AND CAVEATS
2. INFANT AND CHILD MORTALITY IN PAKISTAN 4
OVERALL LEVELS AND TRENDS INTERNATIONAL COMPARISONS
SPATIAL VARIATIONS
INTRA-PROVINCIAL VARIATIONS DEMOGRAPHIC VARIATIONS SOCIOECONOMIC VARIATIONS DELIVERY OF HEALTH SERVICES MULTIVARIATE ANALYSIS SIMULATIONS TO 2015
3. CHILD MALNUTRITION 18
OVERALL LEVELS AND TRENDS SPATIAL VARIATIONS
INTERNATIONAL COMPARISONS DEMOGRAPHIC VARIATIONS SOCIOECONOMIC VARIATIONS
MULTIVARIATE ANALYSIS SIMULATIONS TO 2015
4. PRIMARY SCHOOL ENROLLMENT 26
OVERALL LEVELS SPATIAL VARIATIONS
SOCIOECONOMIC DIFFERENTIALS ROLE OF SERVICE DELIVERY ROLE OF PRIVATE SCHOOLS MULTIVARIATE ANALYSIS SIMULATIONS TO 2015
5. PRIMARY SCHOOL COMPLETION 37
LEVELS AND TRENDS SPATIAL VARIATIONS
SOCIOECONOMIC VARIATIONS SERVICE DELIVERY ISSUES MULTIVARIATE ANALYSIS SIMULATIONS TO 2015
6. GENDER DISPARITY IN CHILD SCHOOLING 44
LEVELS AND TRENDS SPATIAL VARIATIONS
SOCIOECONOMIC VARIATIONS ROLE OF PRIVATE SCHOOLS MULTIVARIATE ANALYSIS
7. CONCLUSIONS 53
ANNEX 1: ESTIMATION RESULTS 57
ANNEX 2: DATA SOURCES 62
PAKISTAN SOCIOECONOMIC SURVEY
PAKISTAN INTEGRATED HOUSEHOLD SURVEY NATIONAL NUTRITION SURVEY
REFERENCES 64
EXECUTIVE SUMMARY
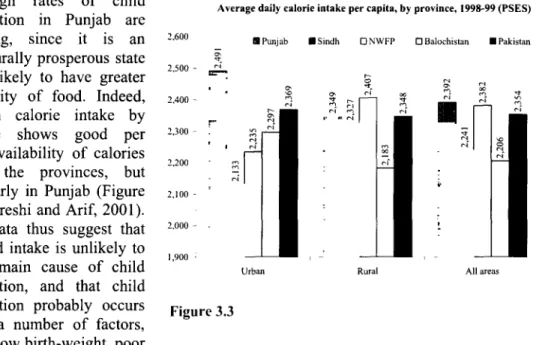
Pakistan's progress in improving its MD indicators during the 1990s has been uneven. The indicator which has seen some progress is infant/under-five mortality, which, by all indications, has fallen by about 3.5% annually during the 1990s - nowhere near the performance of Bangladesh, which has seen a decline of 4.8% annually in its infant mortality, but considerably better than India's sluggish 2.2% annual decline. However, at 82 deaths per 1,000 live births, Pakistan still has the highest level of infant mortality among the large countries of South Asia.
Pakistan's record in reducing child malnutrition has been dismal. There are indications that child malnutrition has been stagnant, and may actually have increased, during the 1990s. Nearly half of all children under the age of 5 are underweight. While this prevalence rate is not significantly different than that observed in India or Bangladesh, those countries have seen a decline in child malnutrition during the 1990s. For instance, child underweight rates in Bangladesh declined sharply from 68% in 1992 to 51% in 2000. In India, the decline has been slower - from 53% in 1992-93 to 47% in 1998-99.
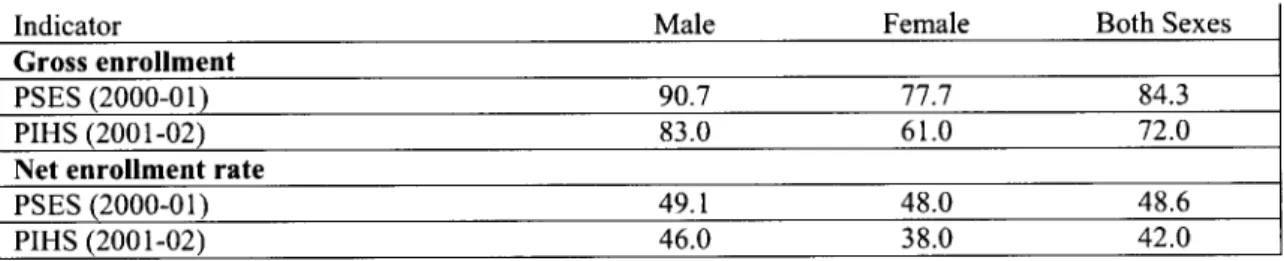
Likewise, despite their low levels, education indicators in Pakistan have seen little progress during the 1990s. Both the gross and the net primary enrollment rate have stagnated between 1995-96 and 2001-02, and only 42% of primary school-aged children attended primary school in 2001-02. In comparison, net primary enrollment rates were 53% in India (in 1999-2000) and 65%
in Bangladesh (in 2000). Primary completion rates are no better in Pakistan, with only about half of the children entering primary school actually completing five years of the primary course.
With the exception of Sindh, most provinces have seen the primary completion rate stagnant or decline in the 1990s.
However, Pakistan has seen some progress in narrowing the gap between male and female school enrollments. The share of female to male students in primary school increased substantially during the 1990s - from about 50% in 1990-91 to 75% in 1999-2000. Of course, these levels pale in comparison to the performance of Bangladesh, which has virtually eliminated the gender gap in enrollments not only at the primary level but also, remarkably, at the secondary level.
Pakistan's generally slow progress in reducing child malnutrition and increasing primary school enrollment and completion is worrisome in light of the fact that it already ranks very low on these indicators - both relative to its neighbors in South Asia as well as relative to its per capita income.
This report concludes that even though it will be very challenging for Pakistan to attain the MDGs, it should nevertheless be possible for it to make substantial progress on the four MD indicators with a package of interventions that include economic growth, improved infrastructure coverage, expansion of schooling (particularly female schooling), and sector-specific policies (such as increased immunization coverage). For instance, the simulation results suggest that
increasing the child immunization coverage from its current level to a level of 100% (i.e., universal coverage) could be associated with a very large reduction in infant mortality of 28 infant deaths per 1,000 live births. A full 'package' of three interventions (expanded female schooling, child immunization coverage, and sanitation coverage) would bring the infant mortality rate in the country down from its current level of 77 deaths per 1,000 live births to a level of 42 deaths per 1,000 live births by 2015. While this would still be considerably above the MDG level (33 deaths per 1,000 live births), it would represent tremendous progress. Likewise, a package of economic growth, expansion of adult female schooling, and expanded electricity,
sanitation and immunization coverage could together result in a large decline in the child underweight rate - from a level of 47% currently to 31 % by 2015. Again, this level would still be well above the MD goal of no more than 20% of Pakistani children aged 0-59 months being underweight, but it would represent dramatic progress in comparison to what Pakistan has been able to achieve in the past.
The same conclusions apply to the other indicators. The projections in this report suggest that, with a package of 3-4 interventions, the net primary enrollment rate in the country would likely increase from a level of 49% in 2000-01 to 66% in 2015 and that the primary completion rate would likely increase from a level of 51% to 65% - both rates being well below the 100% rate called for by the MDGs. Finally, the projections show a slight narrowing of the gender gap in the net primary enrollment rate from 6.5 percentage points to 6.1 percentage points by 2015.
It should be noted that these simulations are based on the assumption that mean real consumption expenditure per capita in Pakistan will grow annually at about 5.4% between now and 2015, which is consistent with the GDP growth targets espoused by the Medium-Term Development Framework of the Planning Commission. Such an improvement in real consumption per capita would represent a marked shift from the situation prevailing in the 1990s, when real per capita consumption was largely stagnant. However, the Pakistani economy has gained significant momentum during the last couple of years, with real GDP growth averaging 5.0-6.5% per annum or 2.5-4% on a per capita basis. For the simulation exercises, this report thus assumes that Pakistan's growth prospects over the next decade will resemble its growth experience during the last two years - not its performance during the decade of the 1990s.
It is rather discouraging then to find out that, despite this stepped-up growth in the economy and despite the increase in adult female schooling that this report assumes will occur over the next decade, Pakistan will still find it difficult to attain any of the four MDGs considered here. There are three possible implications of these findings. First, the empirical simulations indicate the need for additional large targeted interventions in child survival, malnutrition and schooling (over and above the more general interventions considered in this report). What could these interventions be? There is considerable evidence from many developing countries that demand-side interventions - such as conditional cash transfer (CCT) programs that provide financial assistance to poor households conditional on their making investments in their children's human capital (school attendance or regular use of preventive health care services) - are effective in improving child schooling, health and nutritional outcomes. Pakistan has introduced a few demand-side incentives, such as involving communities in social service delivery (e.g. school committees in the Punjab) and introducing stipends for girls aged 6-8 years (only in Sindh and Punjab). Free textbooks are also available to all children. Other safety net programs, such as Zakat and Bait-ul Maal, also target school meals, stipends, health care, and food subsidies. However, these programs are small relative to the size of the problem, focus on particular provinces, are not
integrated (and sometimes overlapping) and their targeting and administration is weak.
Second, this report has not considered the potential effects on the MD indicators of qualitative changes in governance and in the institutional modes of delivery of public services. Clearly, poor governance is at the heart of many social-sector problems in Pakistan. Corruption and nepotism in the recruitment, promotion and transfer of public health and education officials; widespread absenteeism of teachers and health workers; lack of accountability of front-line public officials to clients and communities; scandals in textbook or drug procurement; and capture of local institutions of service delivery by the elite are all examples of poor governance that impact adversely on social outcomes. Broad-ranging institutional reform, incorporating, among other things, empowerment of citizens and communities who can hold the state accountable for performance, devolution of administrative and financial powers to communities, greater autonomy to schools, involvement of parents in school management, and ensuring the motivation of front-line workers, could potentially further improve the MD indicators beyond the levels projected in this report. In this regard, it would be important to assess the impact of the recent and ongoing 'devolution of power' legislation in Pakistan on various MD outcomes.
Third, the findings of this report also indicate the limitations of public-sector interventions in improving the MD indicators in Pakistan. The private and non-government sector can play an important role in raising household demand for child schooling and health services, in extending the coverage of health and educational services, and in improving the quality of social services.
The experience of Bangladesh highlights the very important role that NGOs can play in expanding micro-credit and other income-generating opportunities to the poor, improving educational opportunities for girls, and disseminating child survival interventions in remote rural areas. There is some evidence from within Pakistan itself that the private sector has played a key role in increasing female school enrollments and in bridging the gender gap in schooling opportunities. While it is beyond the scope of this report to identify the mechanisms by which the non-governmental sector in Pakistan could play a greater role in the delivery of social services, it is clear that there is an urgent need for policies that encourage public-private partnerships and non-governmental participation in social initiatives.
This report has also highlighted the tremendous regional disparities in the MD indicators in Pakistan. For instance, the infant mortality rate in some districts is 3-4 times as high as in other districts. The youth literacy rate in some districts is six times as high as the level found in other districts. While the provinces of Punjab and NWFP saw their measles immunization coverage levels expand impressively during the 1990s, Sindh saw a virtual stagnation while Balochistan experienced a sharp decline. Not surprisingly, Sindh and Balochistan saw their under-five mortality rate increase over this period. In general, these two provinces have the worst social indicators, and have seen the least progress in these indicators, in the country. It will thus be important to focus on lagging provinces, and districts within these provinces, in developing an overall MDG strategy for the country.
Finally, the importance of systematically and regularly monitoring MD outcomes at disaggregated levels and of evaluating the impact of public interventions cannot be overemphasized. There is a paucity of reliable, time-series data on most MD indicators at the district and lower levels. The lack of such data makes it virtually impossible to monitor progress toward attainment of the MDGs at lower levels of administration. However, current survey plans by the Federal Bureau of Statistics will help address this problem. A new Pakistan Social and Living Standards Measurement Survey (which will replace the old PIHS) is to be undertaken each year beginning in 2004-05. In every alternate year, the PSLM survey will be fielded with a greatly-expanded sample of 77,000 households, so as to provide MD indicator estimates that are representative at the district level. (The questionnaire to be used to obtain district-level estimates of MD indicators will be the Core Welfare Indicators Questionnaire or CWIQ.) During other
years, the PSLM will be conducted with a sample of 17,000 households and thus be able to provide provincial-level estimates.
Another persistent problem in Pakistan, as in many other countries, is that very few public programs and interventions are subjected to rigorous, independent evaluation. In order to choose the right set of interventions with which to attain the MDGs, it is critical to know which programs have been successful in improving MD indicators and which have not. It is therefore imperative that every public program and intervention in the country be assessed in terms of its contribution to MDG targets. For this to happen, however, a culture of evaluation research needs to be inculcated and nurtured.
1. INTRODUCTION
THE MILLENNIUM DEVELOPMENT GOALS
Since the launch of the Millennium Development Goals (MDGs) at the Millennium Summit held in New York in September 2000, the MDGs have become the most widely-accepted yardstick of development efforts by governments, donors and NGOs. The MDGs are a set of numerical and time-bound targets related to key achievements in human development. They include halving income-poverty and hunger; achieving universal primary education and gender equality; reducing infant and child mortality by two-thirds and maternal mortality by three-quarters; reversing the spread of HIV/AIDS; and halving the proportion of people without access to safe water. These targets are to be achieved by 2015, from their level in 1990 (United Nations 2000).
Almost all the countries in the world, including Pakistan, have committed themselves to attaining the targets embodied in the Millennium Declaration by 2015. Unfortunately, there is little understanding of whether Pakistan will be able to attain all of the MDGs, and whether there are some MDGs that Pakistan will be able to attain. There is even less understanding of what it will take - by way of economic growth, infrastructural investments, and social-sector interventions - to attain the different MDGs. Further, this report argues the importance of disaggregating the MDGs for Pakistan, given the large geographical and socioeconomic variations in millennium development (MD) indicators across the country.
This report focuses on the attainment of four major human development-related MDGs by Pakistan and its main sub-national units - infant mortality, child malnutrition, schooling enrollment and completion, and gender disparities in schooling. The selection of these MDGs for detailed analysis was based in large part on the availability of reliable sub-national data. For example, reliable data on disease prevalence at the district or divisional level are simply not available, and this hampers useful sub-national analysis of the communicable disease-related MDG. The same is true of another important MD indicator - maternal mortality.
METHODOLOGY, DATA, AND CAVEATS
Methodology and Assumptions. The methodological approach adopted in this report is as follows. We first describe the status of the selected MD indicators in 2000, paying consideration to regional and other variations in these indicators. We also consider the changes in the MD indicators over time (typically during the 1990s). We then apply econometric estimation techniques to unit record data (typically at the individual or household levels) in order to analyze the socioeconomic and policy correlates of the selected MD indicators. These estimates are then used to simulate the likely trajectory of the MD indicators under alternative scenarios of change between now and 2015.
For projecting the time-path of the different MD outcomes to 2015, we consider a few common scenarios. One of these is that mean real consumption expenditure per capita in Pakistan will grow annually at about 3% between now and 2015. This would be a stark change from the situation during the 1990s, when real per capita consumption growth was largely stagnant.
However, the Pakistani economy has gained significant momentum during the last couple of years, with real GDP growth averaging 5.0 - 6.5% per annum or 2.5 - 4% on a per capita basis.
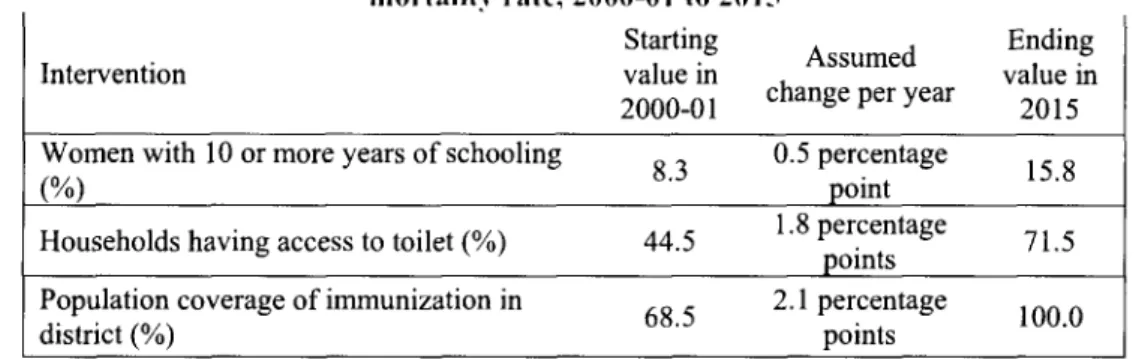
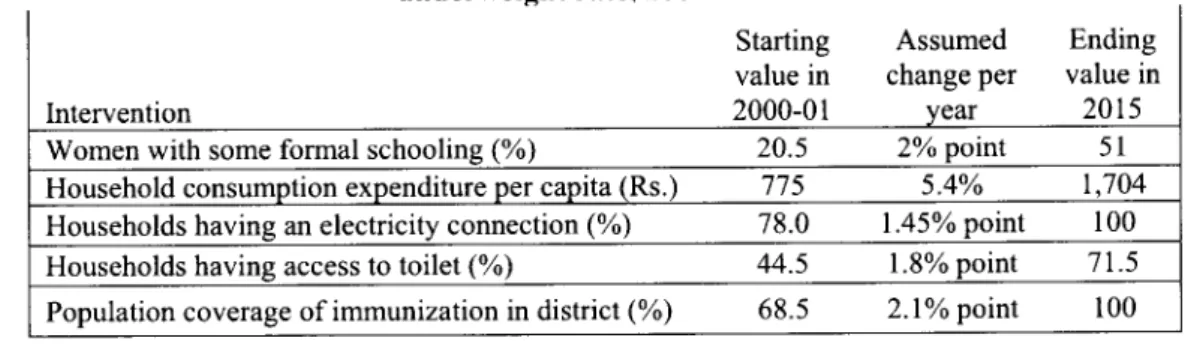
Thus, we assume for the purposes of the simulation exercises that Pakistan's growth prospects over the next decade will resemble its growth experience during the last two years - not its performance during the decade of the 1990s. The other assumption that is common to virtually all the simulations is an increase in adult female schooling. Here our assumption is that the percentage of women with primary schooling will rise by an average of 2 percentage points annually and that the percentage of women with post-primary schooling will increase by 0.5 percentage points annually. Such growth would result in approximately 40% of adult women having primary schooling and 16% having 10 or more years of schooling by 2015. Admittedly, these assumptions are arbitrary, but, given the recent trends in female enrollment, they appear feasible over the coming decade. More importantly, as is noted throughout the report, none of the assumptions made is sacrosanct; the assumptions are only meant to illustrate the range of MD outcomes under a set of possible scenarios. The projections could be undertaken for any combination of changes in the policy or environmental variables.
Additional sector-specific assumptions are made for projecting the individual MD out-comes.
For instance, in the infant mortality and child underweight simulations, we assume that child immunization coverage will expand by 2.1 percentage points annually to reach universal coverage by 2015. For the schooling-related simulations, we assume that electricity coverage will expand by 1.5 percentage points annually to reach 100% coverage by 2015. Prior to each simulation, the full set of assumptions made for the simulation is detailed in the text.
Data. To accomplish the objectives of the study, we have relied on a number of different data sources, especially when describing the status of and time trends in MD indicators. The main2
data sources used are the 2000-01 round of the Pakistan Socioeconomic Survey (PSES) undertaken by the Pakistan Institute of Development Economics (PIDE) and the 2001-02 round of the Pakistan Integrated Household Survey (PIHS) conducted by the Federal Bureau of Statistics (FBS). However, an attempt is made to use data from other sources as well for comparison purposes. For instance, we use data from the 2001-02 National Nutrition Survey (NNS) on child malnutrition. Annex 2 contains a detailed discussion of the sampling design of the PSES and the PIHS, as well as of other data sets from Pakistan, such as the NSS.
For the multivariate analysis of selected MD correlates, this report has made exclusive use of the 2000-01 round of the PSES. There are two reasons for the use of the PSES. First, it is the only nationally-representative data set that provides information on all of the four MDGs addressed in this report: infant and child mortality, child malnutrition, schooling enrollment and completion, and gender disparity in schooling opportunities.3 It is true that data on these indicators are also available from the PRHS, but that survey is limited to the rural areas of the country. Second, the other two nationally-representative data sets - the NSS and the PRHFS - did not obtain data on economic variables, such as income and consumption expenditure, and this severely limits their usefulness.
' The choice of 'policy' variables to use in the simulations is largely dictated by the econometric model used. In other words, only policy or environmental variables that have statistically significant associations with the MD outcome variable in the econometric analysis are used in the projections.
2 The Government of Pakistan's own MDG report - Pakistan Millennium Development Goals Report 2004
- follows this approach as well, using data from several different sources for comparing different MD indicators over time.
3 The PIHS, which has a larger sample, did not obtain anthropometric information on children, so one cannot use those data to analyze child malnutrition.
Caveats. By its very nature, any empirical analysis is predicated on assumptions about data quality and measurement, inferences of causality between variables, and potential biases of statistical and econometric estimates. The analysis presented in this report is not immune to these same concerns. It is therefore important to note at the outset that while the results and simulations presented in this report may give an impression of precision, they are not that.4 They should be treated as indicative of possible broad trends, and could usefully be complemented with other analyses using different methodological approaches. As long as the results are used with this understanding, they can be helpful in 'rough-order' planning for MDG attainment.
Finally, it is important to note an important limitation of the simulations performed in this report.
The simulations are based on statistical analysis of household survey data. By its very nature, such analysis tends to over-emphasize readily-measurable variables, such as household income or consumption, adult schooling levels, and access to infrastructure, and under-emphasize qualitative variables, such as the quality of institutions, governance, and empowerment.
Obviously, this does not imply that the latter variables are irrelevant to the MD indicators; indeed, institutional reform and good governance are critical to the attainment of the MDGs. It is therefore important to view the messages of this report as complementing those from the numerous qualitative (and detailed) studies of health, nutrition, schooling and poverty that have been conducted in the past.
4In addition to lack of precision, the estimates presented in this report, like other econometric estimates, may be subject to systematic biases arising from measurement errors in the independent variables and from the omission of important variables and unobserved heterogeneity from the analysis.
2. INFANT AND CHILD MORTALITY IN PAKISTAN
Infant and child mortality rates are widely considered as good indicators of the overall health and socio-economic status of a country's population. Child mortality accounts for about three-fourths of overall mortality in Pakistan, and the reduction in infant and child mortality has been generally slow. The millennium development goal is to reduce the infant mortality rate by two-thirds from 1990 to 2015. For Pakistan, this would mean an infant mortality rate of 33 deaths per 1,000 live births and an under-five mortality rate of 47 deaths per 1,000 live births.
OVERALL LEVELS AND TRENDS
Infant and child mortality estimates are usually derived from the birth history of women in reproduction ages, obtained from household surveys. These estimates are often affected by the under-reporting of either births or deaths of children. Another common reporting error is heaping of children's ages at death, commonly at 6, 12 and 18 months. In an effort to avoid this problem, many household surveys record a child's age at death in months, especially when a child has died below the age of two years. Even then, errors in age reporting cannot be ruled out.
Estimates of infant mortality in Pakistan are available since the 1960s. These data show that the infant mortality rate declined from 140 deaths per 1,000 live births in the 1960s to 105 in the mid- 1980s, and further to 85 deaths per 1,000 live births in the mid-1990s. However, the pace of infant mortality decline appears to have slowed down since then.
Data from administrative records - those at health and family planning facilities - indicate that, between 1993 and 2002, the infant mortality rate declined from 95 to 85 deaths per 1,000 live births - an annual rate of decline of 1.2% (Table 2.1). However, the same data show the under- five mortality rate declining by more than two times as much - from 128 to 100 deaths per 1,000 live births over the same period. For this to occur, child mortality (i.e., mortality between ages 1 and 5) would have had to decline at even faster rates.
1993 1998 1999 2000 2002
Infant mortality rate 95 90 90 85 85
Under-five mortality rate 128 120 111 103 100 Source: Health & Population Welfare Facilities Atlas, December 2002, CRPRID, Islamabad.
Data on infant and under-five mortality from four different household surveys conducted during the past decade are shown in Table 2.2. According to the PSES, the infant mortality rate was 77 deaths per 1,000 live births. The 2000 Pakistan Demographic Survey also indicates the same figure. However, it is worth nothing that the Pakistan Demographic Survey provides estimates for the year preceding the survey while the PSES estimates are based on a much longer reference period (of the past 8 years). Infant mortality was 85 and 82, respectively, according to the PRHFS and the 2001-02 PIHS. It is beyond the scope of this study to determine the reliability of all these estimates that are based on different data sources. However, the differences can largely be attributed to differences in the reference period. More importantly, the estimated rate of infant mortality in Pakistan appears to be in a narrow range of 77-85 deaths per 1,000 live births. The
under-five mortality rate is in the range of 96-105 deaths per 1,000 live births, depending upon the source.
However, survey data from three rounds of the PIHS (over the period 1995-96 to 2001-02) show a sharper decline in infant mortality than suggested by administrative data. According to the PIHS 1995-96, the infant mortality rate for the country was 101 deaths per 1,000 live births during that year. It had fallen to 89 deaths by the time of the 1998-99 PIHS and further to 82 deaths per 1,000 live births by 2001-02.5 Thus, over the period 1995-2001, infant mortality had declined at an annual rate of 3.5% - considerably faster than the 1.2% rate suggested by the administrative data.6
Gender Differences. Until recently, infant mortality in Pakistan was higher for females than for males, reflecting a trend common in South Asia (especially India and Bangladesh). However, according to both the PSES and the PRHFS, this trend has reversed; the PRHFS shows female infant mortality to be considerably lower than male infant mortality (Table 2.2). Child mortality - i.e., mortality in the age group 1-4 years - is, however, significantly higher among females than among males, likely reflecting intra-household discrimination against girls in the allocation of nutrition and health-care opportunities.
Source Survey year Reference period Infant mortality rate Under-five mortality rate Total Male Female Total Male Female
PSES 2000-01 1991-99 77 79 75 96 95 99
PDS 2000 1999-2000 77 - - - - -
PRHFS 2000-01 1997-99 85 99 71 105 114 95
PIHS 2001-02 1997-99 82 84 81 - - -
Note: PDS refers to Pakistan Demographic Survey carried out regularly by the FBS.
Data from the PIHS over the period 1995-96 to 2001-02 suggest that the phenomenon of excess female infant mortality is largely an urban phenomenon (Table 2.3). In the rural areas of the country, females have consistently enjoyed a lower rate of infant mortality than males. The reverse has been true in the urban areas throughout the 1995-2002 period. Again, this pattern is consistent with the pattern of gender differentials in infant mortality observed in neighboring India.
1995-96 1998-99 2001-02
Sector Male Female Both Male Female Both Male Female Both
Urban 77 85 81 67 80 73 60 70 65
Rural 115 101 108 98 91 95 92 84 88
Overall 105 97 101 90 89 89 84 81 82
Note: Infant mortality rates are calculated for births occurring in the three years preceding the survey.
Source: PIHS, various rounds.
5Indirect estimates of infant mortality based on the PIHS show a similar declining trend during the 1990s.
The indirectly-estimated infant mortality fell from 105 per 1,000 live births during 1990-95 (based on the PIHS 1998-99 round) to 96 during 1993-98 (based on the PIHS 2001-02 round) (World Bank 2004).
6The Pakistan Millennium Development Goals Report 2004 indicates an infant mortality rate of 102 deaths per 1,000 live births in 1990-91 (using data from the Planning Commission) and of 77 in 2000-01 (from the Pakistan Demographic Survey). These two figures would amount to a decline of 2.9% annually.
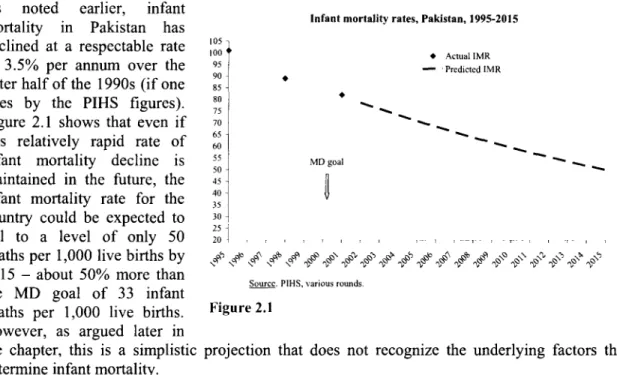
As noted nortalit i earlier akistanh infant Infant mortality rates, Pakistan, 1995-2015
mortality in Pakistan has
declined at a respectable rate :0o Actual IMR
of 3.5% per annum over the 95 Predictcd IMR
latter half of the 1990s (if one 85-
goes by the PIHS figures). t-
Figure 2.1 shows that even if 7570
this relatively rapid rate of 60
infant mortality decline is 55 MD goal
maintained in the future, the 5045
infant mortality rate for the 403551 country could be expected to 30 fall to a level of only 50 20
deaths per 1,000 live births by ,-S ,q f,, 11§1 ab le ? 2015 - about 50% more than
2015 MD aboutl more 3 tant Source. PIHS. various rounds.
the MD goal of 33 infant
deaths per 1,000 live births. Figure 2.1 However, as argued later in
the chapter, this is a simplistic projection that does not recognize the underlying factors that determine infant mortality.
INTERNATIONAL COMPARISONS
How does Pakistan's level of infant mortality and its rate of infant mortality reduction during the
1990s compare to that of the
other large countries in South a in Bangladesh, India and Pakistan, 1990s
Asia? According to the 105 Bangladcsh -Pakistan India
National Family Health 100 I - o
Surveys in India, infant \
mortality in that country fell
from 79 deaths per 1,000 live go 90
births in 1992-93 to 68 in 87
1998-99 - an annual rate of 85 85
decline of 2.5% (Figure 2.2). 80 80
In Bangladesh, the infant \
mortality rate fell even faster
- from 87.4 deaths per 1,000 70 70
live births in 1989-93 to 66 in 68
1995-99, representing an 1991 1992 1993 1994 1995 1996 1997 1998 1999 2000 2001
annual rate of decline of 4.8%
(various Demographic and Figure 2.2 Health Surveys). Using data
from the 1995-96 and 2001-02 rounds of the PIHS, the infant mortality rate in Pakistan declined from 101 deaths per 1,000 live births in 1995-96 to 82 deaths in 2001-02 - an annual rate of decline of 3.5%. Thus, during the 1990s, Pakistan's performance on infant mortality reduction has been better than India's performance but worse than Bangladesh's achievement. However, at about 82 deaths per 1,000 live births, Pakistan still has the highest level of infant mortality among the large countries of South Asia.
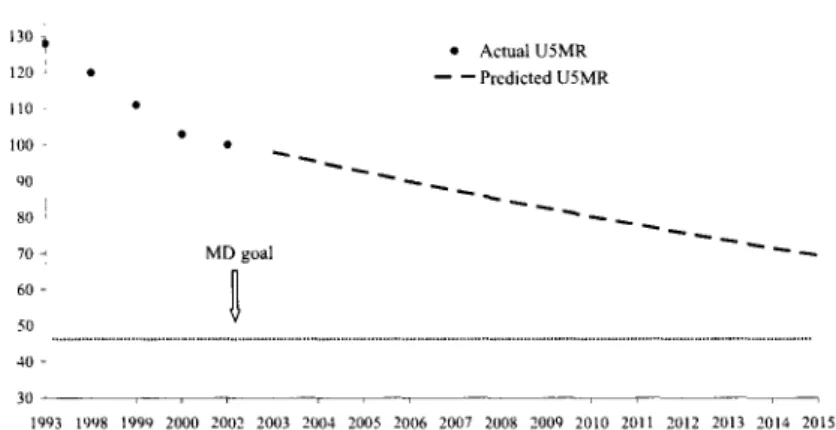
Under-Five Child Mortal- Under-five mortality rates, Pakistan, 1993-2015
ity. As noted earlier, between
1993 and 2002, under-five 130Actual U5MR
mortality fell by 2.9% 120 Prcdicted U5MR
annually. If this rate of ,,
decline were to be continued *oo into the future, the under-five 90
mortality rate is likely to 80 -
reach a level of 69 child 70 - MD goal deaths per 1,000 live births by 60-
2015 - nearly 50% higher 50... .. .
than the MD goal of 47 40-
(Figure 2.3). Thus, simple 11993 1998 1999 2000 2002 2003 2004 2005 2006 2007 2008 2009 2010 2011 2012 2013 2014 2015
projections of the infant and
under-five mortality rates Sourcc: Various issues of the CRPRID Health & Population Welfare Facilitics.
yield very similar results
about the likelihood of Figure 2.3 Pakistan reaching the child
mortality-related MDG.
SPATIAL, VARIATIONS
Table 2.4 presents infant and child mortality rates by urban-rural residence from a number of different sources. While the estimates of mortality differ across the various data sets, the gap in mortality between rural and urban areas is consistent, with infant mortality in the rural areas typically 33-39% greater than in the urban areas. The rural-urban disparity in under-five mortality is even greater, with the under-five mortality rate in the rural areas being nearly 50% larger than in the urban areas.
-pit", I *
PSES PRHFS PIHS
Place of residence/province Infant mortality Under-five Infant mortality Under-five rate mortality rate rate mortality rate
Urban 61 73 48 65
Rural 85 109 64 88
Table 2.5, which shows the infant mortality rate in the urban and rural areas of the country during the 1 990s, indicates that the rural/urban disparity in infant mortality has not changed significantly between 1995-96 and 2001-02. The infant mortality rate in the rural areas has been consistently
30-35% higher than the corresponding rate in the urban areas.
Year Rural Urban Rural/Urban Ratio
1995-96 108 81 133.3
1998-99 95 73 130.1
2001-02 88 65 135.4
Source: Three rounds of the PIHS
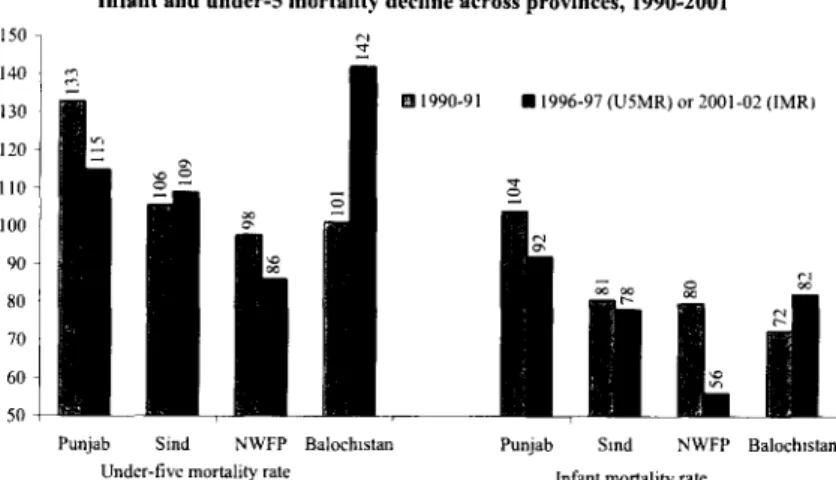
As would be expected, there Infant and under-5 mortality decline across provinces, 1990-2001
are wide variations in infant 150
and under-five mortality 140
across provinces. In 2001-02, 130 a 1990-91 *1996-97(U5MR)or2001-02(IMR
the infant mortality rate 120 l
ranged from a low of 56 in the ° Northwest Frontier Province 00o
(NWFP) to a high of 92 in 90 Punjab (Figure 2.4). The 80
inter-provincial variations in 70
under-five mortality are even 60
greater - from a low of 86 in 50 -
the NWVFP to a high of 142 in Punjab Sind NWFP Balochistan Punjab Sind NWFP Balochistan
Balochistan in 1996-97. Under-five mortality rate Infant mortality rate
Soairce. PDH1S 1990-91. Pakistan Fcrtilty & Family Planning Survey 1996-97, and PIIIS 1998-99 & 2001-02
How have the different
provinces performed in terms Figure 2.4 of reducing their infant and
under-five mortality rates? Provincial MDGs for infant and under-five mortality, 2015
The data shown in Figure 2.4 Punjab 35
are surprising, since they Pakistan 33
show that both infant and Sind 27 Infant mortality
under-five mortality actually NWFP 27
increased sharply in Balochistan 24
Balochistan during the
I 990S. 7 In Sindh, both rates Pakistan 47
were more-or-less stagnant. Punjab 44
The largest decline in infant Sind 35
mortality was seen in the Balochistan 34 Under-S mortality
NWFP (30%), followed by
Punjab (12%). Indeed, the Figure 2.5 large decline in Thus, the
inter-provincial disparity in
infant and child mortality increased very sharply during the 1990s.8
While the discussion on MDGs to date has focused on individual countries reaching the MD goals by 2015, there is no reason why the MDGs should not be applied to individual provinces within countries. Indeed, a national MD goal of reducing infant mortality by two-thirds (between 1990 and 2015) could be achieved by each province reducing its infant mortality by two-thirds.
Figure 2.5, which shows the implied 2015 MD goals for each of the provinces, indicates that the range of infant mortality rates that will need to be attained by each state by 2015 for the country as a whole to meet its MD goals is wide - from a low of 24 for NWFP to a high of 35 for Punjab.
7 The increase of 41% in the under-five mortality rate in Balochistan is likely an over-estimate, reflecting the less-than-precise estimation of under-five mortality by the Pakistan Fertility and Family Planning Survey of 1996-97. Because of widely-dispersed populations residing in difficult-to-reach areas, many household surveys are unable to obtain precise estimates for Balochistan.
8 The variance of the infant mortality rate across provinces increased from 190 in 1990-91 to 231 in 2001- 02 and that of the under-five mortality rate increased from 256 to 530 between 1990-91 and 1996-97.
INTRA-PROVINCIAL VARIATIONS
The provincial averages of infant mortality mask substantial intra-provincial variation. District estimates of infant mortality are available from the Census for 1998. These estimates show considerable variation even within provinces. For instance, within the province of Punjab, which
Map 2. 1: Infant Mortality Rate (infant deaths per 1,000 live births), by district, 1998
Infant Morality Rate 1998
... ...
60 -. . T6.
75 + Jarnmu
had an average infant mortality rate of 72 infant deaths per 1,000 live births in 1998, the district- level infant mortality rate varied from a low of 39 infant deaths per 1,000 live births in Islamabad to a high of 95 in Pakpattan. While some of these differences reflect rural/urban differences, there are large variations in infant mortality even among largely rural districts.9 Map 2.1, which shows district-level estimates of infant mortality for the country, suggests that the high-mortality districts are concentrated in the interior of the country. For the country as a whole, the infant mortality rate ranges from a low of 32 infant deaths per 1,000 live births (in Shikarpur, Jacobabad, Peshawar, Punjgoor, Killa Abdullah, Pishin, Sibi) to a high of 95 in Pakpattan. Map 2.1 suggests that the interior of the country generally has the highest rates of infant mortality.
9 Several non-urban districts, such as Mianwali, Faisalabad, Chakwal and Attock, had infant mortality rates of 60 or fewer infant deaths per 1,000 live births.
Percentage of children aged 12-23 months immunized against measles
The increase in infant and (based on record and recall), by province, 1995-96 to 2001-02 (PIHS)
child mortality rates in 65 62 63 0 1995-96 U 1998-99 *2001-02
Balochistan, and the 60 60
stagnancy of these rates in 57 55 57
Sindh, can in large part be 55 55
explained by the declining or
stagnant levels Of 5 47
immunization of children in 46
45 -
those provinces. According to
the PIHS, for instance, only 40 - 40
38% of the children in Balochistan were immunized 35
against measles in 2001-02 - 30
down from 60% in 1995-96 Punjab Sindh NWFP Balochistan Pakistan
(Figure 2.6).10 In Sindh,
measles vaccination coverage Figure 2.6 remained stagnant between
1995-96 and 2001-02.
DENIOGRAPHIC VARIATIONS
A large number of studies based on data from the World Fertility Surveys provide evidence of the strong association between short birth intervals and child mortality. The PSES data likewise show a very clear negative association between infant and under-five mortality and the preceding birth interval (Table 2.6). Children born at an interval of one year were at significantly higher risk than children born about 3-4 years apart. It is evident from Table 2.4 that birth spacing is associated with significantly reduced infant and under-five mortality.
The survival status of the previous child also has a strong association with mortality. Infant and under-five mortality rates are approximately three times higher among children whose older (previous) sibling was dead as compared to those whose previous sibling was still alive. No consistent pattern between birth order and infant and under-five mortality is observed, although Table 2.4 shows the lowest rate of infant mortality for children of the second birth order. The association between infant and under-five mortality and the mother's age is also unclear from the bivariate analysis. Infant mortality is highest for children of mothers aged 35-39 years, followed by children of mothers aged 45-49. This mixed pattern has also been observed in other recent studies (Bennett, 1999; Ahmad and Mir, 2003).
'° While such a sharp decline in immunization coverage almost seems implausible, it is consistent with the increase in under-five mortality in Balochistan from 101 to 142 child deaths per 1,000 live births over the same period.
PSES 2000-01
Demographic factors Infant mortality rate Under-five mortality rate Birth Interval (previous child)
First child 86 105
1 year 132 172
2 years 100 124
3 years 56 68
4 or more years 31 44
Survival status of the previous child
Alive 61 77
Dead 173 225
Birth order of child
1 77 96
2 67 84
3 74 90
4 76 93
5+ 82 106
Mother's age at child's birth (years)
15-19 60
20-24 83 100
25-29 70 88
30-34 66 85
35-39 94 118
40-44 79 93
45-49 92 130
Source: 2000-01 PSES
SOCIOECoONOMIC VARIATIONS
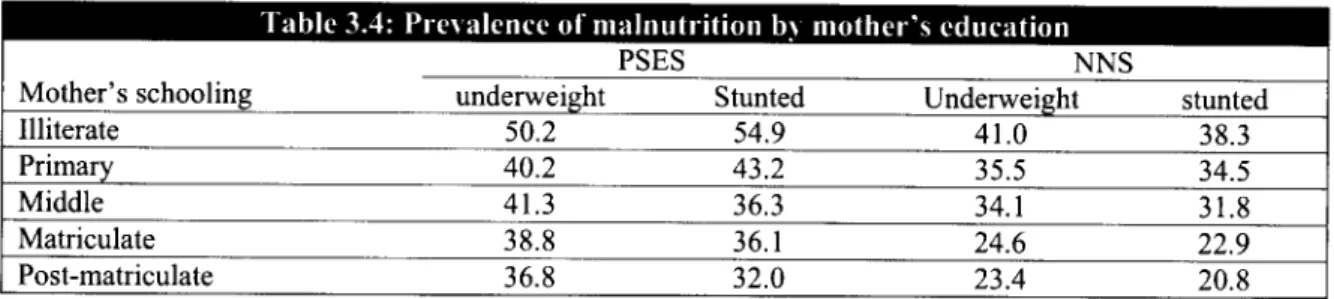
Throughout the world, better-schooled mothers tend to have lower rates of infant and under-five mortality than less-schooled mothers. This pattern is also observed in the PSES data from Pakistan. The infant mortality rate is 27 deaths per 1,000 live births for children of women with secondary or higher schooling, as compared to 83 deaths per 1,000 live births for illiterate women (Table 2.7). A similar pattern is observed in the PIHS and PRHFS, suggesting that each incremental year of schooling is associated with significant gains in infant survival. The data indicate that even a few years of mother's schooling can help improve child survival and significantly lower the death rate of children in their early years of life. These findings are consistent with those found in other studies carried out in Pakistan and in other developing countries (Azam and Karin, 2001), and reflect the fact that a better-schooled mother is quicker to notice a child's health problem and obtain treatment for him or her relative to a less-schooled mother (Bennett, 1999).
Mother's schooling PSES 2000-01 PIHS 2001-02 PRHFS 2000-01
level IMR U5MR IMR U5MR
Illiterate 83 105 89 153
Primary school 79 96 80 137
Middle school 57 80 61 128
High school 27 30 49 56