1 WHAT IS BEHIND THE DIAGNOSIS OF LEARNING DISABILITY IN AUSTRIAN SCHOOLS? AN EMPIRICAL EVALUATION OF THE RESULTS OF THE DIAGNOSTIC
PROCESS Markus Gebhardt
TU München Mathias Krammer
Susanne Schwab Peter Rossmann Barbara Gasteiger Klicpera
University of Graz
Every school system has to deal with children with Learning Disabilities (LD).
However, the concepts of LD, the assessment procedures, the diagnostic criteria as well as their interpretation vary widely from country to country. What they usually seem to have in common is that general cognitive abilities, as measured by standardized IQ tests, are seen as an important aspect of the label.. In Austrian schools the diagnosis of LD is largely based on expert opinions provided by special education teachers. The diagnostic procedure is quite unregulated and open to individual interpretation. As a rule, standardized tests are not used in this connection. In the present study the characteristics of children with a diagnosis of LD are evaluated in terms of standardized testing. Thiry-seven pupils diagnosed as having LD and 136 regular school children were assessed at the end of the 5
thgrade in Austrian schools using standardized tests of intelligence, reading, writing and arithmetic skills and questionnaires regarding social integration in class, emotional integration in school and cultural capital of their families. Compared with a group of pupils without LD, matched for IQ and age, the LD children showed significantly worse basic arithmetic and reading skills, inferior social integration in class and lower familial cultural capital. A stepwise logistic regression analysis indicated that poor basic arithmetic and reading skills were the strongest predictors of having a diagnosis of LD. Other variables, including IQ, had significantly less weight. The results are seen as indication of the fact that precise guidelines for diagnosing LD in the school system and a transition to a system of evidence-based allocation of resources are urgently needed.
The construct of Learning Disabilities (LD) refers to children who have significant academic difficulties in school, for which neither other disabilities (e.g. sensory impairment, mental retardation or emotional and behavioral disorders) nor lack of schooling can be found as a cause (Lloyd, Keller & Hung, 2007). In almost all school systems, these children are labeled with Special Educational Needs (SEN) to give them a legal right for additional assistance and support in school. Within the population of pupils with SEN children with LD form the largest group. However, due to the fact that the diagnosis of LD is at first glance not caused by somatic-medical reasons, but rather by the specific criteria of a given school system, the diagnosis of LD is under a constant legitimacy pressure.
The specific concepts of LD vary widely from country to country. Thus the size of the population of
children with LD is also different in any given country (Sideridis, 2007). In the US, for example, 5% of
the entire student population belongs to the group of students with LD, whereas in Germany only 2.6 %
of the entire populations of schoolchildren are diagnosed as having LD (Hallahan, Lloyd, Kauffman,
Weiss & Martinez, 2005; KMK, 2010). In addition, the OECD categorizes pupils for its country
comparisons in three groups. Pupils with disabilities are categorized in group (A), pupils with learning
2 difficulties are assigned to group (B) and pupils with disadvantages to group (C). This differentiation implies that children with disabilities can be found in group A, children with specific learning difficulties or severe to moderate learning problems belong to group B and finally group C consists of children who are disadvantaged due to social or economical circumstances. 5.7% of all schoolchildren in the US and 2.2% of all pupils in Germany were recognized under the heading of specific learning difficulties.
Furthermore, pupils with severe to moderate learning problems count for 1.4% of the entire population of schoolchildren in the US and for only 0.6 % in Germany (OECD, 2007).
But not only the definitions of LD are different from country to country, there is also considerable variability concerning the assessment procedures and the diagnostic criteria which lead to the diagnosis of SEN in general and of LD in particular. In some countries the diagnostic decisions are based on relatively explicit and well defined guidelines (e.g. discrepancy model in US), in others the assessment procedures in the school system are only very vaguely defined (e.g. Germany and Austria). Traditionally in German speaking countries a below average IQ was considered as most effective diagnostic criterion of LD, since this allowed a general objective assessment of the cognitive performance of a child without a school reference (Grünke, 2004). However, since the 1970’s, IQ testing is seen increasingly critically (Bundschuh, 2010) especially by teachers and educational practitioners. As a result, IQ is no longer used as sole indicator of LD in present governmental recommendations in Germany nor in Austria.
Nevertheless, many researchers still regard low intellectual abilities as the most important aspect of a diagnosis of LD (Kretschmann, 2006) and recommend the administration of a language-free IQ test in addition to standardized academic achievement tests as part of the diagnostic process (Kany & Schöler, 2009; Kottmann, 2006). The discrepancy model is only applied to the diagnosis of Dyslexia or Dyscalculia in German speaking countries. Children with LD were excluded from the discrepancy model because their abilities are generally below average. An allocation of SEN-Lernen (i.e. the official recognition of LD by the school system and thereof the allocation of special educational resources to the school) is only given to children with severe learning difficulties (Schröder, 2008; Klauer & Lauth, 1997). Other disabilities (e.g. sensory impairment, mental retardation or neurological problems) or a lack of schooling have to be ruled out as causes of the problems (Lloyd et al., 2007).
Information about the school career of children diagnosed with LD in German speaking countries is rather sparse. A handful of empirical studies were carried out in order to explore further the school performance of children who were diagnosed with SEN-Lernen. In secondary school the children usually show a delay in school achievements of at least two years compared to children of the same age without SEN (Haeberlin, Bless, Moser & Klaghofer, 1991). This is confirmed by present cross-sectional studies (Tent, Witt, Bürger & Zschoche-Lieberum, 1991; Wocken, 2000, 2005). In Germany, seventh grade pupils in special schools for children with SEN-Lernen did not even accomplish the requirements of fifth grade in a general-education secondary school (Hauptschule) (Wocken, 2000).
A further characteristic of pupils with LD is their problematic social position. In fact, specific characteristics like social marginalization or migration background, respectively, are important confounding factors (Schröder, 2005, Huber, 2006). It is therefore not astonishing that in Germany in addition to IQ and school performance of the children, a lower social and educational status of the parents was found to be a strong predictor of LD as well (Wocken, 2000).
The situation in Austria
Historically the Austrian special education school system developed quite similar to the German one.
However, during the last two centuries the school system in Austria was explicitly shaped into the direction of inclusive education of pupils with SEN. Today, about 51,2 % of all children with SEN are educated in integrative settings in regular schools. Austria has thus an integration rate which is comparable to the rates of England (50.3%), Finland (53%) and Poland (53,2%) (European Agency, 2010). However, it is important to note that the integration rate differs considerably between the nine federal states of Austria. In Styria, for example, the integration rate is about 80%, whereas in lower Austria it is only around 20% (Statistik Austria, 2010).
The Austrian system differentiates primarily between pupils with and without SEN. In contrast to
Germany, the distinction between different types of SEN is only made on the basis of different curricula,
which the SEN children are assigned to. So, children with LD have to be assigned to a general special
education curriculum (Allgemeine Sonderschule) (Feyerer, 2009). Therefore, statistical data concerning
the prevalence of LD in Austrian schools is hardly available and the prevalence can only be estimated at
1.5 – 2% (Buchner & Gebhardt, 2011). Conventionally, SEN are diagnosed by a special education
3 teacher usually in the first or second year of elementary school (Volksschule). Only in some special cases and only with consent of the parents this is complemented by an expert opinion of a school psychologist.
As a result IQ tests are hardly ever used in the process of diagnosing LD in Austria. Usually the diagnosis is based on performance deficits in math and German language which are observed and described by the special education teacher. If the parents of the child are in agreement with the diagnosis, the school gets extra funding and resources for the child with LD.
In the 5
thgrade a further assessment is done and, moreover, a reclassification of the curriculum, which the child is assigned to, is possible. Over the next years in secondary school the classification of the child usually remains stable until the end of schooling. Due to the diagnosis of SEN resources for additional support are again allocated to the school. These resources determine the class placement, curriculum mapping and instructional methods as well. One of the key aspects, however, is the fact that the number of pupils with SEN has a significant impact on the available resources for a given class and school.
In regular classes with three to five pupils with SEN an additional special education teacher is employed full time. If there are less than three pupils with SEN in a regular class an additional support teacher is employed only on an hourly basis. The average time this support teacher is paid per pupil with SEN depends on the type of disability. In case of LD and behavioural difficulties the support teacher can spend in class four hours weekly per pupil with SEN. In case of physical disabilities six hours (but only as long as the physical disability goes along with an impairment of educability), for children with sensory disabilities 8 hours and for children with cognitive disabilities 10 hours per week are paid.
Finally, the size of integrative classes (i.e. the regular classes which are also attended by pupils with SEN), differs in the federal states of Austria. In Carinthia, for example, the maximum class size is 19 in primary and 21 in secondary school. In contrast, in Styria the recommended number of pupils per class is 24 in primary and 25 in secondary school. So, in average, an integrative class in a secondary school in Styria (where our empirical study was carried out) consists of five pupils with SEN and 20 pupils without SEN.
Research objective
At the moment little is known about the achievements and school performance of Austrian pupils with LD. In order to obtain a more accurate empirical impression of the performance profile of pupils with LD the present study examined pupils in the fifth grade. As mentioned above, this is the relevant age after which the diagnosis of SEN usually remains stable until the end of schooling. The present study tries to examine in what respect pupils with LD differ from pupils without LD. The first research objective of the present study was to answer the question how pupils with a diagnosis of LD differ from pupils without LD apart from IQ. In the second step it was planned to develop a model of retrospectively explaining the diagnosis of LD on the basis of the results of psychometric tests or questionnaires. It was assumed that primarily IQ together with school achievement in math, reading and spelling should play an important role in this context. Furthermore, the children´s social integration in class and the cultural capital of their families of origin were expected to make further important contributions.
Method
In 2010, 96 pupils with SEN visited the fifth grade of public schools in Graz/Austria (Landesschulrat für Steiermark, 2011). Of these, 43 pupils (45%) were examined in the present study. 37 out of these 43 pupils had been diagnosed with LD and were now taught according to the general special education curriculum (Allgemeine Sonderschule). Eight pupils with LD attended the only remaining special school in Graz, the other 29 pupils attended eight integrative classes in regular secondary schools together with 144 pupils without SEN. The average number of pupils per class was 23, in which four to six pupils with SEN were included. The pupils with LD in integrative classes spent an average of M = 22.55 hours per week in inclusive settings and M = 4.41 hours per week in segregated settings.
The school testing took place over two days and only those pupils were included in the data analysis who had completed all components of the examination. Consequently, only 125 pupils without disabilities and 32 pupils with LD could be included in the analysis. 60% of the pupils’ disabilities had already been diagnosed in the first grade. Migration background of the pupils (at least one parent born abroad) was very prevalent in the whole sample, regardless of SEN, with approximately 41%.
Instruments
4 The psychometric tests CFT20-R, ELFE 1-6, SLRT II, HSP, ERT 4+ & FDI 4-6 were used in the study.
The Culture Fair Intelligence Test CFT20-R (Weiß, 2008) is a language-free intelligence test that measures the basic intelligence of children from the age of 8.5 to 19 years. Individuals with low proficiency in German are not disadvantaged by the testing tasks. It is applicable as a group test (r
tt= .80).
The Reading Comprehension Test for First to Sixth Graders ELFE 1-6 (Lenhard & Schneider, 2006) measures reading comprehension. In doing so, basic reading strategies as well as the ability to understand sentences (α = .92) and texts (α = .97) can be determined. From the Salzburg Reading- und Writing-Test SLRT II (Moll & Landerl, 2010) only the one minute reading subtest was used. This test constitutes an individual reading test that specifically examines decoding speed of words (α = .90) and pseudo-words (α
=.98).
The Hamburg-Writing-Test HSP 1-9 (May & Malitzky, 1999) examines strategies of writing of pupils from the first to ninth grade. The number of correct graphemes is used as raw score (α = .92).
The Eggenberg Calculation Test ERT 4+ (Schaupp, Holzer & Lenart, 2010) measures the arithmetic skills of children from fourth to fifth grade. From this test the Basic Arithmetic Scale (α = .82) was used.
The Basic Arithmetic Scale assesses the calculation abilities regarding addition, subtraction, multiplication and division.
The questionnaire FDI 4-6 (Häberlin et al., 1991) measures the degree of social integration in class (e.g.
I’m very happy with my classmates) and emotional integration in school (e.g. I like going to school). The questionnaire was evaluated in a Swiss survey of pupils from fifth to sixth grade (α = .89; α = .93).
Additionally, in order to get an estimation of the cultural capital of their families of origin, the children were asked to rate the number of books in the households of their families and teachers were asked to estimate the hours of inclusive schooling and to name the type of SEN of a specific pupil.
Results
In order to control for IQ and age, the first analysis was performed on the basis of matched pairs. 26 pupils with a diagnosis of LD and 26 pupils without LD but with comparable IQ and age were assigned pairwise. Six pupils with LD had to be excluded from the analysis due to the lack of control pupils with comparably low IQ.
The age correlation of the twins in the two resulting groups was r=.85 and the IQ correlation was r=.98.
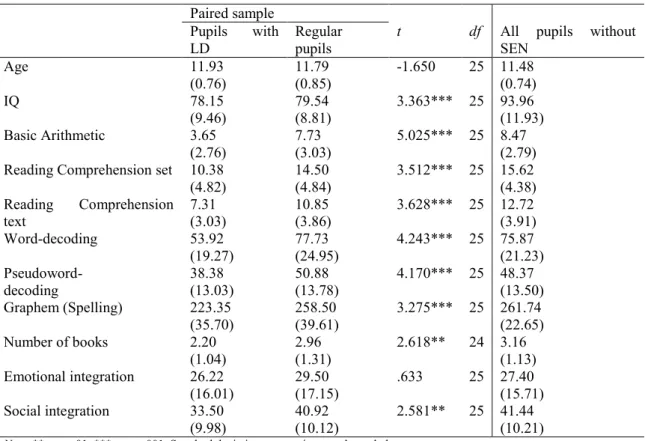
Although they had quite comparable IQs, pupils with LD performed significantly worse in mathematics, reading fluency, reading comprehension and spelling than their twins without LD. Moreover, the number of books was lower in the homes of pupils with LD than in homes of the control children. In terms of social integration, pupils with LD reported feeling less socially integrated in class. With regard to emotional integration in school the two groups did not differ significantly. In order to provide a general overview, the mean scores of the twin pairs as well as the means of all pupils without LD are presented in Table 1. In all measures of academic performance the means of the children with LD were significantly lower than the means of their test twins without LD.
In order to estimate the relative weight of these variables as (retrospective) predictors of a diagnosis of LD, a stepwise logistic regression analysis was performed according to the procedure proposed by DeMaris (1995). Initially this method was mainly used in epidemiological research, but it is now increasingly often applied in research on children with special needs (e.g Shifrer, Muller und Callahan, 2010; Ihle & Esser, 2008). A logistic regression analysis was chosen due to the fact that the dependent variable was dichotomous (pupils with diagnosed LD versus pupils without a diagnosis of LD). The potential predictors were: Gender (females: 1, males: 2), age, number of books in household, cognitive abilities (IQ), reading comprehension, decoding speed of words, correctly written graphemes, basic arithmetic skills and degree of reported social integration in class and emotional integration in school.
In the stepwise procedure four significant models emerged. The first model already yielded an overall percentage of 90.5% correct assignments, which increased in the fourth model up to 92.4 %. Overall, the models explained a large proportion of variance (model 1: Nagelkerkes R
2= .537 and model 4:
Nagelkerkes R
2= .692). The Hosmer-Lemeshow test was not significant at any stage, hence, the
regression model appears to be well calibrated (Backhaus, Erichson, Plinke & Weiber, 2008). The
predictors basic arithmetic, reading comprehension, cognitive abilities and social integration in class
5 were included in the regression model, whereas the rest of the predictors showed no (further) detectable effect. As can be seen in table 2 poor basic arithmetic and reading skills were the strongest predictors of having a diagnosis of LD. Other variables, including low IQ, had significantly less weight.
Table 1: Comparison of Pupils With and Without LD by Means of One-Sample T-Tests Paired sample
Pupils with LD
Regular pupils
t df All pupils without SEN
Age 11.93
(0.76) 11.79
(0.85) -1.650 25 11.48 (0.74)
IQ 78.15
(9.46) 79.54
(8.81) 3.363*** 25 93.96 (11.93)
Basic Arithmetic 3.65
(2.76) 7.73
(3.03) 5.025*** 25 8.47 (2.79) Reading Comprehension set 10.38
(4.82)
14.50 (4.84)
3.512*** 25 15.62 (4.38) Reading Comprehension
text 7.31
(3.03) 10.85
(3.86) 3.628*** 25 12.72 (3.91)
Word-decoding 53.92
(19.27) 77.73
(24.95) 4.243*** 25 75.87 (21.23) Pseudoword-
decoding 38.38
(13.03) 50.88
(13.78) 4.170*** 25 48.37 (13.50) Graphem (Spelling) 223.35
(35.70) 258.50
(39.61) 3.275*** 25 261.74 (22.65)
Number of books 2.20
(1.04) 2.96
(1.31) 2.618** 24 3.16 (1.13) Emotional integration 26.22
(16.01)
29.50 (17.15)
.633 25 27.40 (15.71) Social integration 33.50
(9.98) 40.92
(10.12) 2.581** 25 41.44 (10.21)
Note. **= p < .01, *** = p < .001. Standard deviations appear in parentheses below means.Table 2: Stepwise Logistic Regression Models for the Prediction of Having a Diagnosis of LD Model
1 2 3 4
Variable b b b b SE(b) Exb (b)
Basic Arithmetic -.667** -.547** -.434** -.430** .138 .651
Reading Comprehension text -.265** -.218** -.206** .088 .814
IQ -.071* -.072* .031 .930
Social integration -.071* .030 .931
Model χ
266.67** 80.50** 86.70** 92.73**
df 1 2 3 4
All model chi–squares are significant
*p < .05, **p < .01