Abstract
A multiyear mooring record (2007–2014) and satellite imagery highlight the strong temperature variability and unique hydrographic nature of the Laptev Sea. This Arctic shelf is a key region for river discharge and sea ice formation and export and includes submarine permafrost and methane deposits, which emphasizes the need to understand the thermal variability near the seafloor. Recent years were characterized by early ice retreat and a warming near-shore environment. However, warming was not observed on the deeper shelf until year-round under-ice measurements recorded unprecedented warm near-bottom waters of +0.6°C in winter 2012/2013, just after the Arctic sea ice extent featured a record minimum. In the Laptev Sea, early ice retreat in 2012 combined with Lena River heat and solar radiation produced anomalously warm summer surface waters, which were vertically mixed, trapped in the pycnocline, and subsequently transferred toward the bottom until the water column cooled when brine rejection eroded stratification.1. Introduction
The vast Siberian shelves are seasonally ice covered and characterized by large freshwater discharge rates from some of the largest rivers on Earth [Dai and Trenberth, 2002], such as the Ob and Yenisey in the Kara Sea and the Lena in the Laptev Sea. These and other large Arctic rivers provide freshwater to the Arctic Ocean [Aagaard and Carmack, 1989], regionally dominate stratification and the biogeochemistry [Holmes et al., 2012], and supply heat to the shelves [Whitefield et al., 2015]. The Siberian shelves are ice covered from October until the following summer and are net export regions of sea ice into the Transpolar Drift System [Krumpen et al., 2013], with trends toward earlier breakups and delayed freezeups [Stroeve et al., 2014].
Low summer sea ice extents are preconditioned by enhanced offshore ice transport during spring [Krumpen et al., 2013], leading to large areas of thin ice (<20 cm thickness) north of the landfast ice edge that rapidly melt once temperatures rise above freezing. The energy balance changes significantly with a sea ice reduction, as open water, and in particular, the sediment-rich and colored dissolved organic matter (CDOM)- rich river water [Heim et al., 2013] better absorbs solar radiation. This leads to warmer surface waters and impacts the seasonal sea ice retreat [Steele and Ermold, 2015]. In 2014, positive SST (sea surface temperature) anomalies of 4°C were observed north of the Laptev Sea [Timmermans and Proshutinsky, 2014].
During the last glacial cycle, the Laptev Sea shelf was above sea level and thus exposed to thermal condi- tions favorable for the formation of permafrost and gas hydrates [Delisle, 2000;Romanovskii et al., 2004].
Since the Holoceneflooding, which reached the present 50 m isobath around 11,000 years before present [Bauch et al., 2001], below-zero degree bottom waters have prevented the upper boundary of the submerged permafrost from degrading. Therefore, the thermal variability on this shelf has received considerable attention due to its potential impact on permafrost. Previous historical data-based studies discussed temperature variability in different Laptev Sea shelf regions [Dmitrenko et al., 2011], and found a warming near-shore (<10 m) zone due to a warming atmosphere, while the 30–50 m deep central shelf remained constant at near-freezing bottom temperatures [Dmitrenko et al., 2011], although most of these shipboard data were collected during summer and lacked sufficient temporal resolution to quantify the seasonal variability.
Russian-German research programs operated a series of year-round oceanographic moorings in the Laptev Sea, which provide a nearly continuous (2007–2014) hydrographic record from the central shelf (Figure 1).
Based on parts of this record, earlier studies highlighted a strong hydrographic variability and the presence
•Combination of mixing and advection controls near-bottom warming
Supporting Information:
•Text S1 and Figures S1–S3
•Figure S1
•Figure S2
•Figure S3
Correspondence to:
M. Janout,
markus.janout@awi.de
Citation:
Janout, M., J. Hölemann, B. Juhls, T. Krumpen, B. Rabe, D. Bauch, C. Wegner, H. Kassens, and L. Timokhov (2016), Episodic warming of
near-bottom waters under the Arctic sea ice on the central Laptev Sea shelf,Geophys. Res. Lett.,43, doi:10.1002/
2015GL066565.
Received 12 OCT 2015 Accepted 15 DEC 2015
Accepted article online 20 DEC 2015
©2015. American Geophysical Union.
All Rights Reserved.
of warm near-bottom waters during winter [Hölemann et al., 2011;Janout et al., 2013]. In 2012/2013, maxi- mum near-bottom temperatures reached +0.6°C, which counters the common perception of a year-round cold (near-freezing) Laptev Sea shelf, and opens the discussion of the relevant physical processes and poten- tial implications of warming near-bottom waters on the benthic environment.
2. Data and Methods
The“Laptev Sea System”program is a continuing Russian-German partnership operating since the early 1990s designed to study the Laptev Sea region. The central shelf mooring (Figure 1) wasfirst deployed in September 2007 and serviced annually thereafter, except for a two year deployment from 2011 to 2013. The mooring was equipped with Acoustic Doppler Current Profilers (ADCP), which recorded currents throughout the water column and sea ice drift through an ice-tracking function. Conductivity-temperature-depth (CTD) devices (SBE-37) were mounted ~5 m above the bottom throughout the time series. Beginning in 2010, an additional CTD sampled the midwater column at depths between 20 and 26 m. For more information on instrumentation and data processing please refer toHölemann et al. [2011] andJanout et al. [2013]. The mooring was located at 74.7°N, 125.3°E from 2007 to 2013 (depth 43 m) and was shifted northward (76.0°N, 126.0°E, depth 45 m) from 2013 to 2014 (Figure 1). Mooring operations were embedded in summer hydrographic surveys and hence complemented by CTD casts using anSBE-19plus-profiler. The 2012 CTD data [Rabe et al., 2012] were collected during the “ICEARC”-expedition on R/V Polarsternto the central Arctic Ocean, using an SBE-911pluswater sampling carousel.
Sea ice and SST images were remotely sensed with the Moderate Resolution Imaging Spectroradiometer- Aqua. We combined true-color images with level 2 SST products in the open water area. SST data were processed with the long-wave algorithm within the Ocean Biology Processing Group Multi-Sensor level 1 to level 2 software.
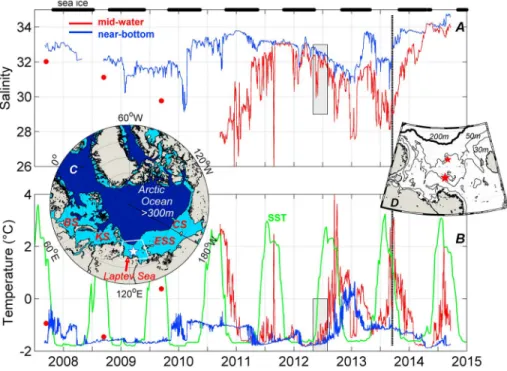
Figure 1.The 2007–2014 mooring record: (a) near-bottom water (blue) and midwater (red) salinity and (b) temperature.
The data were smoothed using a 2 day running mean in order to remove high-frequency variability. Areal-mean SSTs [Reynolds et al., 2002] are included for comparison (green). Red dots in thefirst half of the record indicate midwater values from CTD profiles. Note that the September 2013 to September 2014 deployment is ~146 km north of the previous location; the black dashed line marks the transition time. Gray shades in Figures 1a and 1b mark the time period expanded in Figure 3e. Black bars at the top of Figure 1a indicate ice cover [Cavalieri et al., 1996]. (c) The white star marks the mooring location. Letters mark adjacent shelf seas: Barents (BS), Kara (KS), East Siberian (ESS), and Chukchi (CS) Seas. Light blue shading indicates regions<300 m [Jakobsson et al., 2008]. (d) The white box outlines an expanded view, showing previous (big star) and shifted mooring location (little star), and 10, 30, 50, and 200 m isobaths.
supporting information) replaced the warm and fresh waters with a slightly less warm ( 1.1°C) and saline (>33) water mass, similar to a 2010 inflow event at this location [Janout et al., 2013]. Both middle- and near- bottom waters maintained above-freezing temperatures until spring 2014. The surface layer temperature on the outer shelf was>4°C based on late August 2012 CTD profiles (Figure 4), and likely higher at the midshelf mooring location. The warming was triggered by large open water areas and warm river water that was advected northward on the shelf as will be shown later in more detail. Overall, the time series emphasizes the large variability and further shows that warm waters occur episodically and can persist near the bottom under a closed ice cover for several months.
3.2. An Idealized Year on the Central Laptev Sea Shelf
The strong hydrographic variability on this shelf results from a complex interplay among different processes related to river water, sea ice formation, tides, wind mixing, and episodic advection. Characteristic for this region and not observed on other Arctic shelves is the occurrence of the warmest and freshest near-bottom waters during midwinter under a closed ice cover. The primary heat source is solar radiation followed by warm river discharge in summer, and potentially Atlantic-derived waters upwelled on the outer shelf, [Dmitrenko et al., 2010a], although these are too saline to explain the midwinter anomalies at the mooring. Hence, the source of the positive near-bottom temperature anomalies is in the upper ocean, which agrees with previous studies that emphasized the role of vertical mixing to transfer warm waters toward the bottom [Hölemann et al., 2011;
Janout and Lenn, 2014]. Nevertheless, mixing alone does not explain the large hydrographic variability (Figures S1–S3). Advection in both the upper and lower layers is important, as for instance demonstrated by near-bottom inflow events of warmer and saline water from the outer shelf in 2010 and 2013. Despite these complexities, multiple years of moored temperature and salinity records coupled with currents and mixed layer depth derived from the layer of maximum shear provide the basis for a schematic summary of the processes that shape the ocean and sea ice environment in an idealized year of the Laptev Sea (Figure 2).
Late winter presents a cold and nearly homogenous water column, covered with sea ice that is steadily moved by winds and tides. During winter, southerly winds create polynyas, which lead to strong sea ice formation and salinification of the ocean. Toward spring and summer, heatfluxes are not large enough to produce ice, and polynyas then evolve into extended open water areas. This timing coincides with breakup and maximum river discharge (Figure 3), which sets up stratification, quickly increases SST, and decreases SSS (sea surface salinity). Midsummer winds are generally weaker but tidal mixing acts on the pycnocline year-round [Janout and Lenn, 2014], and SST and SSS are now at their maximum and minimum, respectively.
With a reduction in river discharge and the onset of fall storms, the warmed surface waters both cool and mix downward along with lower salinity water. Once the deepening pycnocline approaches the seafloor, near-bottom characteristics show high-frequency variability and an episodic increase in temperature.
Warm near-bottom waters are preserved into winter despite surface cooling and rapid ice formation because episodic advection of fresher waters from shallower regions counters the brine-induced buoyancy loss. This is underlined by a number of episodic midwater salinity reductions (Figure 1a), which generally coincide with enhanced currents from anywhere but the north (Figure S1). Shallow areas adjust more rapidly to seasonal heating and cooling, and hence, advection of fresher waters to the mooring site may be warmer in summer (e.g., August/September 2012 in Figure 1) and colder in winter (January 2013, Figure S2). Figure 2 does not apply for anomalously strong stratification as observed in 2008/2009, when summer surface salinities at this location were as low as ~10 [Dmitrenko et al., 2010b;Bauch et al., 2012] and bottom temperatures remained
near freezing throughout the winter. While our data and previous studies emphasized the importance of vertical processes in shaping the near-bottom hydrography on this shelf, we note that understanding the Laptev Sea’s variability is a three-dimensional problem, considering the region’s strong salinity gradients [Janout et al., 2015]. However, detailed quantifications are beyond the scope of this paper and would require high-resolution model studies and a dense array of year-round measurements.
3.3. The Lena River Heat Source
The Lena river discharge peaks in late May when landfast ice is still present, which leads toflooding and accelerated fast ice decay while a large part of the river water discharges under the ice [Bareiss and Görgen, 2005]. Therefore, the fate of the freshwater is largely decoupled from the atmosphere and remains invisible to satellites, which is why exact pathways of Lena River freshwater around breakup remain so poorly understood. In late May 2012, a low-pressure system over the eastern Kara Sea forced persistent southerly winds over the central Laptev Sea, which opened a large polynya along the landfast ice edge (Figure 3).
Fortunately, cloud-free skies allowed a series of SST and true-color satellite images, which provide clear evidence of the Lena River as a heat source to the central shelf. The river water further contains high values of CDOM, which absorbs solar radiation and leads to enhanced surface warming and lateral ice melt [Bauch et al., 2013].
A satellite image from 25 May 2012 shows open water (59,000 km2) with uniformly low SST extending to
~200 km north of the Lena Delta (Figure 3a). During this time, near-bottom temperatures at the mooring site were low, while strong winds caused a temporary salinity decrease in the midwater column, either due to advection of fresher coastal waters or due to downward mixing of surface waters. The next clear image from 14 June 2012 then highlights the increased open water area (87,000 km2) with maximum SST of ~6–8°C (Figure 3b). SSTs near the major river channels in the eastern Delta show warm (>8°C) near-shore waters, and a narrow continuous band of warm water connecting the northern (third-largest) channel with the ice-free central shelf. Focusing on the near shore shows the opening of a narrow passage in the coastal ice barrier over 4–5 days by 14 June 2012 (Figure 3c), which is similar to observations from the Mackenzie River [Nghiem et al., 2014]. In 2012, Lena discharge increased from winter base values to the maximum on 26 May 2012 within one week, and subsequently decreased to ~60% only 2–3 weeks after the peak (Figure 3g). The river water temperature measured ~200 km upstream of the Delta was ~8°C on 6 June 2012 (ArcticGRO) [Holmes et al., 2012], which agrees well with satellite SST around the mooring location.
From here on, the moored temperature showed episodic but steady temperature increases in the interior water column. This was likely related to the warm river water (Figure 3b), as further supported by backscatter recordings of the ADCP (Figure 3), which detected the high levels of particles typical for the Lena outflow [Wegner et al., 2003].
Figure 2.An idealized year on the Laptev Sea shelf, summarizing dominant processes and vertical water column structure.
Colors indicate density (dominated by salinity), where lighter colors are less dense. The seasonal progression of the pycnocline is based on the layer of maximum shear from ADCP records. The red shading indicates the spatiotemporal distribution of surface-warmed water. Water temperatures are indicated as“near freezing (T≈Tfr)”,“above freezing (T>Tfr)”, and“significantly above freezing (T≫Tfr)”. The color bar indicates air-sea heatfluxes.“Episodic advection”events were observed in 2010 and 2013 (Figure 1 andJanout et al. [2013]). Advection of fresher surface waters from shallower regions counters brine rejection during early winter, and enables the preservation of warmer near-bottom waters.
Lena River heat content amounts to ~6 × 10¹⁵kJ based on average 8°C warm river discharge of 81,300 m3s 1 from 25 May to 14 June (Figure 3g), which translates into ~24 km3of sea ice melt. Indirectly, the river water’s optical properties increase the light absorption and hence surface warming and lateral ice melt, which additionally weakens the ice cover and causes a potentially greater dynamical ice loss. In comparison, solar heat input amounts to ~18–27 × 1015kJ, based on a mean National Centers for Environmental Prediction (NCEP)-shortwave radiation of 170 W m 2during the same 21 day period over the observed open water areas (59–87 × 103km2, Figure 3). This estimate ignores albedo effects and solar radiation over ice-covered regions and hence suggests upper bounds for a Lena River heat contribution of ~18–25% to the combined solar and riverine heat input to the area. This estimate holds for 2012 sea ice conditions around the peak discharge period. However, in late summer once open water dominates the shelf, riverine heat is insignificant compared with solar radiation. Nevertheless, river discharge is relevant in spring to kick-start melt and further change the optical water properties, which concentrates solar absorption in the very near surface.
Actual river-induced melt strongly depends on the wind-driven Lena plume distribution. Therefore, these observations further trigger speculations on how the thermal environment on this shelf will develop under Figure 3.Satellite sea ice and SST from (a) 25 May 2012 (open water area: 59,000 km2) and (b) 14 June 2012 (87,000 km2); (c) opening of the coastal sea ice barrier;
(d) mean NCEP-SLP from 20 to 30 May 2012; unfiltered mooring (e) temperature (°C) and (f) salinity (expanded from Figure 1); and (g) Lena River discharge (103m3s 1) and ADCP-backscatter (counts) from May to August 2012.
changing sea ice conditions, since the pathways of peak discharge under landfast ice [Itkin et al., 2015]
fundamentally differ from those that occur wind driven in open water, as was the case in 2012.
3.4. Implications
3.4.1. Impact of Warm Shelf Waters on the Eurasian Basin Hydrography and Arctic Sea Ice
The anomalously warm spring conditions in the Laptev Sea require a more detailed look into the shelf water’s impact on the Arctic Ocean. In 2012, the Arctic sea ice extent was at a minimum [Perovich et al., 2012] with Figure 4.(a) Sea ice concentration [Cavalieri et al., 1996] from 30 August 2012 including mooring location (red star), R/VPolarstern-CTD stations (red dots) sampled 26–31 August 2012, and the 100 m isobath. (b) Temperature (°C) and (c) salinity transects using the CTD stations from Figure 4a.
The Laptev Sea is currently transitioning from a cold Arctic shelf to a warming, seasonally ice-covered shelf.
This transition already shows an impact on the thermal environment as indicated by our observations, with yet unknown consequences for submarine permafrost and gas hydrates [Shakhova et al., 2010;Nicolsky et al., 2012; Overduin et al., 2015] and for the benthic ecosystem. Considerable attention has been paid to a warming Arctic with respect to permafrost degradation and release of underlying greenhouse gases for instance on the East Siberian shelf [Shakhova et al., 2013] as well as terrestrial methane over northern wetlands [Parmentier et al., 2015].Nicolsky et al. [2012] andFrederick and Buffett[2014] highlight the role of taliks (irregularities in submarine permafrost), caused by faults or localized degradation, in facilitating venting of methane. The permafrost layer in the Laptev Sea ends on the central and outer shelf and is likely considerably thinner than the expected 200–700 m thick lens on the inner shelf [Frederick and Buffett, 2014]. However, the exact locations and volumes of methane reservoirs and the thickness of the overlaying permafrost are highly uncertain due to limited observations.Dmitrenko et al. [2011] modeled the impact of the observed near-shore warming on subsea permafrost and found slow response times (~1000 years) and hence no immediate effects on methane release. However, the consequences of a warming ocean above the seaward end of the permafrost lens and above taliks remain unclear.
The benthic ecosystem is directly affected by increasing temperatures through enhanced bacterial activity and the microbial loop [Kirchman et al., 2009, and references therein]. However, this Arctic ecosystem is not sufficiently understood and potential temperature effects on organisms may be masked by conse- quences from changing physical parameters such as sea ice, stratification, vertical mixing and nutrient cycling, and their impact on food availability [Piepenburg, 2005].
4. Summary and Conclusion
A multiyear (2007–2014) mooring record underlines the strong variability in the near-bottom hydrography on the central Laptev Sea shelf and highlights a recent warm period with maximum temperatures of +0.6°C under the ice in January 2013. The dominant heat sources in the region are solar radiation and the Lena River, as evidenced by satellite images during May/June 2012. The surface-warmed waters are then mixed toward the bottom by winds and tides, where they are preserved until brine rejection delayed by episodic lateral advection of fresher waters erodes stratification and cools the entire water column (Figures 1 and 2). This large variability in near-bottom temperature and salinity underlines the need for continuous year-round measurements in addition to shipboard sampling. While a warming trend was previously only observed in shallow coastal regions [Dmitrenko et al., 2011], our year-round measurements now show considerable temperature variability and provide indications that the deeper (30–50 m) central Laptev Sea shelf is indeed impacted by episodic warming events, which may occur more frequently in a warming Arctic. The warm Lena River contributes to ice melt in spring but more importantly introduces bio-optical properties (CDOM, sediments) that concentrate solar radiation at the surface and accelerate warming and lateral ice melt.
Based on comprehensive information previously gained from these mooring records, an idealized schematic (Figure 2) helps to explain the seasonal variability of the shelf’s physical environment and to highlight the unique nature of this Arctic shelf sea. Throughout the year, the Laptev Sea is controlled by a variety of factors, such as the Lena River plume, large horizontal and vertical salinity gradients, tides, advection, vigorous fall
storms, mobile pack ice, landfast ice, polynyas, and sea ice formation. All these combined produce warm and fresh near-bottom waters, which can be maintained under a solid ice cover until winter.
Timmermans[2015] calculated a significant ice growth delay due to upward mixing of internally stored heat in the Canada Basin. The same may occur on the Laptev Sea shelf, as suggested by our temperature time series (Figure 1), although we lack direct evidence due to missing year-round surface measurements.
However, our data indicate that warmer waters are mixed and stored in the lower water column, which might have implications for the benthic environment and permafrost as was discussed earlier, although the relevant time scales remain unclear. If the warm waters contained in a ~17 m thick layer below the midwater CTD from September to December were to reach the surface, the available heat could melt 0.49 ± 0.15 m thick sea ice, although the fate of the trapped heat is not yet entirely understood.
The region’s open water season lengthens by ~8 days decade 1[Stroeve et al., 2014], and trends are positive for ocean and air temperatures [Boisvert and Stroeve, 2015], ice export [Krumpen et al., 2013], and river discharge [Peterson et al., 2002]. Finally, the landfast ice season shortens by 2.8 days yr 1 [Selyuzhenok et al., 2015], and further reductions and earlier breakups may significantly change the distribution of heat and freshwater from the Lena River plume. All of these above trends favor a warming of shelf waters.
References
Aagaard, K., and E. C. Carmack (1989), The role of sea ice and other fresh water in the Arctic circulation,J. Geophys. Res.,94(C10), 14,485–14,498, doi:10.1029/JC094iC10p14485.
Bareiss, J., and K. Görgen (2005), Spatial and temporal variability of sea ice in the Laptev Sea: Analyses and review of satellite passive- microwave data and model results, 1979 to 2002,Global Planet. Change,48, 28–54, doi:10.1016/j.gloplacha.2004.1012.1004.
Bauch, D., J. A. Hölemann, I. A. Dmitrenko, M. A. Janout, A. Nikulina, S. A. Kirillov, T. Krumpen, H. Kassens, and L. Timokhov (2012), Impact of Siberian coastal polynyas on shelf-derived Arctic Ocean halocline waters,J. Geophys. Res.,117, C00G12, doi:10.1029/2011JC007282.
Bauch, D., J. A. Hölemann, A. Nikulina, C. Wegner, M. A. Janout, L. A. Timokhov, and H. Kassens (2013), Correlation of river water and local sea-ice melting on the Laptev Sea shelf (Siberian Arctic),J. Geophys. Res. Oceans,118, 550–561, doi:10.1002/jgrc.20076.
Bauch, H. A., T. Mueller-Lupp, E. Taldenkova, R. F. Spielhagen, H. Kassens, P. M. Grootes, J. Thiede, J. Heinemeier, and V. V. Petryashov (2001), Chronology of the Holocene transgression at the North Siberian margin,Global Planet. Change,31, 125–139.
Boisvert, L. N., and J. C. Stroeve (2015), The Arctic is becoming warmer and wetter as revealed by the Atmospheric Infrared Sounder,Geophys.
Res. Lett.,42, 4439–4446, doi:10.1002/2015GL063775.
Cavalieri, D. J., C. L. Parkinson, P. Gloersen, and H. J. Zwally (1996), Updated yearly, inSea Ice Concentrations from Nimbus-7 SMMR and DMSP SSM/I-SSMIS Passive Microwave Data[2007-2013], NASA National Snow and Ice Data Center Distributed Active Archive Center, Boulder, Colo., [Digital Media], doi:10.5067/8GQ8LZQVL0VL.
Dai, A., and K. E. Trenberth (2002), Estimates of freshwater discharge from continents: Latitudinal and seasonal variations,J. Hydrometeorol.,3, 660–687.
Delisle, G. (2000), Temporal variability of subsea permafrost and gas hydrate occurrences as a function of climate change in the Laptev Sea, Siberia,Polarforschung,68, 221–225.
Dmitrenko, I. A., S. A. Kirillov, L. B. Tremblay, D. Bauch, J. A. Hölemann, T. Krumpen, H. Kassens, C. Wegner, G. Heinemann, and D. Schröder (2010a), Impact of the Arctic Ocean Atlantic water layer on Siberian shelf hydrography,J. Geophys. Res.,115, C08010, doi:10.1029/
2009JC006020.
Dmitrenko, I. A., S. A. Kirillov, T. Krumpen, M. Makhotin, E. P. Abrahamsen, S. Willmes, E. Bloshkina, J. A. Hölemann, H. Kassens, and C. Wegner (2010b), Wind-driven diversion of summer river runoff preconditions the Laptev Sea coastal polynya hydrography: Evidence from summer-to-winter hydrographic records of 2007–2009,Cont. Shelf Res.,30, 1656–1664, doi:10.1016/j.csr.2010.06.012.
Dmitrenko, I. A., S. A. Kirillov, L. B. Tremblay, H. Kassens, O. A. Anisimov, S. A. Lavrov, S. O. Razumov, and M. N. Grigoriev (2011), Recent changes in shelf hydrography in the Siberian Arctic: Potential for subsea permafrost instability,J. Geophys. Res.,116, C10027, doi:10.1029/
2011JC007218.
Frederick, J. M., and B. A. Buffett (2014), Taliks in relict submarine permafrost and methane hydrate deposits: Pathways for gas escape under present and future conditions,J. Geophys. Res. Earth Surf.,119, 106–122, doi:10.1002/2013JF002987.
Heim, B., et al. (2013), Ocean colour remote sensing in the southern Laptev Sea: Evaluation and applications,Biogeosci. Discuss.,10, 3849–3889, doi:10.5194/bgd-10-3849-2013.
Hölemann, J. A., S. Kirillov, T. Klagge, A. Novikhin, H. Kassens, and L. Timokhov (2011), Near-bottom water warming in the Laptev Sea in response to atmospheric and sea ice conditions in 2007,Polar Res.,30, 6425, doi:10.3402/polar.v30i0.6425.
Holmes, R. M., et al. (2012), Seasonal and annualfluxes of nutrients and organic matter from large rivers to the Arctic Ocean and surrounding seas,Estuaries Coasts,35(2), 369–382, doi:10.1007/s12237-011-9386-6.
Itkin, P., M. Losch, and R. Gerdes (2015), Landfast ice affects the stability of the Arctic halocline: Evidence from a numerical model,J. Geophys.
Res. Oceans,120, 2622–2635, doi:10.1002/2014JC010353.
Jakobsson, M., R. Macnab, L. Mayer, R. Anderson, M. Edwards, J. Hatzky, H. W. Schenke, and P. Johnson (2008), An improved bathymetric portrayal of the Arctic Ocean: Implications for ocean modeling and geological, geophysical and oceanographic analyses,Geophys. Res.
Lett.,35, L07602, doi:10.1029/2008GL033520.
Janout, M. A., and Y. D. Lenn (2014), Semidiurnal tides on the Laptev Sea Shelf based on oceanographic moorings with implications for shear and vertical mixing,J. Phys. Oceanogr.,44(1), 202–219, doi:10.1175/JPO-D-12-0240.1.
Janout, M. A., J. Hölemann, and T. Krumpen (2013), Cross-shelf transport of warm and saline water in response to sea ice drift on the Laptev Sea shelf,J. Geophys. Res. Oceans,118, 563–576, doi:10.1029/2011JC007731.
Janout, M. A., et al. (2015), Kara Sea freshwater transport through Vilkitsky Strait: Variability, forcing, and further pathways toward the western Arctic Ocean from a model and observations,J. Geophys. Res. Oceans,120, 4925–4944, doi:10.1002/2014JC010635.
Acknowledgments
The“Laptev Sea System”project was supported by the German Federal Ministry of Education and Research (BMBF grant 03G0833) and the Ministry of Education and Science of the Russian Federation. The 2012 CTD data collected by R/VPolarstern-cruiseARK-XXVII/3are available at http://www.pangaea.de.
NCEP-Reanalysis data were provided by the NOAA-CIRES Climate Diagnostics Center, Boulder, CO, USA at http://www.
cdc.noaa.gov/. NOAA_OI_SST_V2 data were provided by the NOAA/OAR/ESRL/
PSD, Boulder, Colorado, USA at http://
www.esrl.noaa.gov/psd/. Lena River discharge and temperature were provided by the Arctic Great Rivers Observatory (NSF-1107774). Mooring data will be made available upon request (markus.janout@awi.de). We thank W.-J.
von Appen and M.-L. Timmermans for fruitful discussions and greatly appreciate the comments and suggestions from the Editor (J. Stroeve) and two anonymous reviewers.
Peterson, B. J., R. M. Holmes, J. W. McClelland, C. J. Vörösmarty, R. B. Lammers, A. I. Shiklomanov, I. A. Shiklomanov, and S. Rahmstorf (2002), Increasing river discharge to the Arctic Ocean,Science,298, 2171–2173.
Piepenburg, D. (2005), Recent research on Arctic benthos: Common notions need to be revised,Polar Biol.,28(10), 733–755.
Rabe, B., A. Wisotzki, S. Rettig, R. Somavilla Cabrillo, and H. Sander (2012), Physical oceanography during POLARSTERN cruise ARK-XXVII/3 (IceArc), Alfred Wegener Institute, Helmholtz Center for Polar and Marine Research, Bremerhaven, doi:10.1594/PANGAEA.802904.
Reynolds, R. W., N. A. Rayner, T. M. Smith, D. C. Stokes, and W. Wang (2002), An improved in situ and satellite SST analysis for climate,J. Clim., 15, 1609–1625.
Romanovskii, N. N., H. W. Hubberten, A. V. Gavrilov, V. E. Tumskoy, and A. L. Kholodov (2004), Permafrost of the east Siberian Arctic shelf and coastal lowlands,Quat. Sci. Rev.,23, 1359–1369.
Selyuzhenok, V., T. Krumpen, A. Mahoney, M. Janout, and R. Gerdes (2015), Seasonal and interannual variability of fast ice extent in the southeastern Laptev Sea between 1999 and 2013,J. Geophys. Res. Oceans, doi:10.1002/2015JC011135.
Shakhova, N., I. Semiletov, A. Salyuk, V. Yusupov, D. Kosmach, and Ö Gustafsson (2010), Extensive methane venting to the atmosphere from the sediments of the East Siberian Arctic shelf,Science,327(5970), 1246–1250, doi:10.1126/science.1182221.
Shakhova, I., I. Semiletov, V. Leifer, A. Sergienko, D. Salyuk, D. Kosmach, C. Chernykh, D. Stubbs, V. T. Nicolsky, and Ö. Gustafsson (2013), Ebullition and storm-induced methane release from the East Siberian Arctic Shelf,Nat. Geosci.,7(1), 64–70, doi:10.1038/NGEO2007.
Steele, M., and W. Ermold (2015), Loitering of the retreating sea ice edge in the Arctic Seas,J. Geophys. Res. Oceans, doi:10.1002/
2015JC011182.
Stroeve, J. C., T. Markus, L. Boisvert, J. Miller, and A. Barrett (2014), Changes in Arctic melt season and implications for sea ice loss,Geophys.
Res. Lett.,41, 1216–1225, doi:10.1002/2013GL058951.
Timmermans, M.-L. (2015), The impact of stored solar heat on Arctic sea ice growth,Geophys. Res. Lett.,42, 6399–6406, doi:10.1002/
2015GL064541.
Timmermans, M.-L., and A. Proshutinsky (2014), Arctic Ocean sea surface temperature, NOAA Arctic Report Card: Ocean Update for 2014.
[Available at http://www.arctic.noaa.gov/reportcard/sea_surface_temperature.html.]
Wegner, C., J. A. Hölemann, I. Dmitrenko, S. Kirillov, K. Tuschling, E. Abramova, and H. Kassens (2003), Suspended particulate matter on the Laptev Sea shelf (Siberian Arctic) during ice—Free conditions,Estuarine Coastal Shelf Sci.,57, 55–64, doi:10.1016/S0272-7714(02)003.
Whitefield, J., P. Winsor, J. McClelland, and D. Menemenlis (2015), A new river discharge and river temperature climatology data set for the pan-Arctic region,Ocean Modell.,88, 1–15.