Epibiota comparison between two biogenic
substrates: the non-native tunicate Styela clava and the native blue mussel Mytilus edulis
by
Maria-Milena Filip
Matriculation number: 3164179
A Thesis submitted in Partial Fulfilment of the Requirements for graduating the Master’s Program “Marine Biology”
with the Degree of Master of Science (M. Sc.)
University of Bremen Faculty 2 Biology/Chemistry
1st Supervisor: Prof. Dr. Kai Bischof
(University of Bremen, Dept. Marine Botany) 2nd Supervisor: Dr. Christian Buschbaum
(Alfred Wegener Institute, Dept. Coastal Ecology)
Bremen November 2020
1
TABLE OF CONTENT
Abstract ……….………2
Introduction ………...2
Materials and Methods ……….4
Results ………8
Discussion ……….12
Conclusion ………16
References ………17
Appendix ………22
2
Epibiota comparison between two biogenic substrates: the non-native tunicate Styela clava and the native blue mussel Mytilus edulis
Abstract
With the increase in globalisation, the amount of non-native or alien species have also increased considerably. It is therefore important to know the impact these species have on native communities. The island of Sylt, located in the north-eastern part of the German Wadden Sea, is a popular tourist destination, as well as an important location for oyster and mussel aquaculture.
The aim of my study is to better understand the impact of alien species in fouling communities and their associated epibiota in the region of the Wadden Sea. To fulfil this aim, I studied the epibiota associated with the two biogenic substrates, the native blue mussel Mytilus edulis and the alien tunicate Styela clava. I collected the samples from the marina of List on the island of Sylt, facing the Wadden Sea and, hence, being a critical site where non-native species might settle first. My results show similarities between the substrates with regards to species richness, diversity and evenness. The communities of the two substrates are similar with regards to the dominating species (the amphipod Crassicorophium sextonae) and distinguishing by the presence and abundance of certain organisms, such as juvenile blue mussels appearing in high abundances on M. edulis. Non-native species appeared on both biogenic substrates, without displaying a clear preference. Styela clava might not be a habitat builder like M. edulis, but on an individual scale, the introduced tunicate represents a highly complex microhabitat on par with the native blue mussel, sharing and providing resources in an anthropogenic habitat. Based on my results and existing literature, I believe that the tunicate does not pose a threat to the native assemblages of the Wadden Sea.
Keywords: epibiota, biogenic substrates, NIS, Wadden Sea, Styela clava, Mytilus edulis
Introduction
Since the increase in globalisation, the spread of non-native species outside their native range has created significant concern about the potential implications to the receiving ecosystems (Sakai et al. 2001; Macleod et al. 2016). In the coastal environment, these species often arrive and settle first on anthropogenic structures like marinas before they establish in the natural environment (Glasby et al. 2007; Simkanin et al. 2012). Their spread is often facilitated by anthropogenic activities, such as ballast water of big cargo boats, attached to hulls of leisure boats or with aquaculture organisms. If niches are free or freed, i.e. by disturbing the wild habitat through dredging, these non-indigenous species (NIS) have a higher chance at establishing and, depending on their ecological traits/situations, even proliferate (Grosholz and Ruiz 1996; Epstein and Smale 2018). Conclusively, it has been observed that NIS may compete with the native communities for resources and can suppress the native population, thus negatively impacting the host habitat (Grosholz et al. 2000; James 2016; South et al. 2017). There are studies showing that NIS can also exert facilitative effects on other alien species and, in some cases, the native species (Epstein and Smale 2018). Rodriguez (2006) predicted that these facilitative effects would occur when certain conditions were met (e.g. invasive species provide limiting resources, replace functionally similar native species, increase habitat complexity etc.).
3
To assess the potential facilitative or restrictive impacts of NIS, such as the ones previously mentioned, it is essential to establish an inventory of the species present and gain a sound understanding of their ecological interactions. Buschbaum et al. (2012) took record of all the NIS in the Dutch-German-Danish Wadden Sea. At the time of the study, the authors identified 66 alien taxa, amongst them the Pacific oyster Crassostrea gigas, the Asian seaweed Sargassum muticum, the balanoids Austrominius modestus and Balanus improvises, the Asian tunicate Styela clava. The study was focused on identifying and proposing management solutions against NIS. Significant areas of the Wadden Sea are considered “Conservation Areas”; thus, alien taxa are generally viewed as a threat or nuisance. Nevertheless, the authors concluded that the elimination of the already established non-natives might not be entirely beneficial to the ecosystem’s diversity. They elaborate that in the Wadden Sea alien species have been the cause of an increase in regional species richness, ecological complexity and evolutionary change in mixed autochthone-alien communities.
One example of local richness increase via facilitative interaction with the native species was observed on the Asian seaweed Sargassum muticum by Buschbaum et al. (2006). The seaweed was accidentally introduced to the European Atlantic in the 1970s, and has currently almost a worldwide distribution (Engelen et al. 2015). The authors analysed the epibiotic communities in two shore habitats of the North-eastern Atlantic: the community associated with the non-native seaweed Sargassum muticum and of the native seaweeds Halidrys siliquosa (rocky shore) and Fucus vesiculosus (sandy shore). The alien S. muticum was observed to have more associated epibionts than the native fucoids, and also facilitated the epibiotic abundance. Sargassum muticum’s structural complexity increases the available substrate and habitat heterogeneity, thus exerting a positive effect on the native assemblage (Buschbaum et al. 2006).
Similar to S. muticum, the Asian kelp Undaria pinnatifida was initially introduced by accident in the Mediterranean. It started spreading rapidly after introduction, with the intent of cultivation in the French Atlantic. In a matter of decades, U. pinnatifida “hopped” from marina to marina and further to the wild coastal environment (Fletcher and Farrell 1998; Minchin and Nunn 2014; Kraan 2017;
Schiller et al. 2018), expanding its distribution to the bigger part of the North-eastern Atlantic coastline. Simultaneously, also by anthropogenic means, the seaweed spread to the southern hemisphere (southern Australia, New Zealand, Patagonia) (Epstein and Smale 2017; South et al.
2017). Studies have shown that U. pinnatifida’s expansion was also facilitated by the disturbance of natural habitat, which allowed the alien seaweed to settle and compete with the native kelps, often with alarming consequences (Schaffelke and Hewitt 2007; Epstein et al. 2019). In Patagonia, studies (Pereyra et al. 2015; Pereyra et al. 2017) have linked the establishing of U. pinnatifida with another non-native species, the Asian tunicate Styela clava. The authors concluded that the tunicate was facilitating the establishing of the introduced seaweed, by providing favourable settlement conditions for the newly arrived U. pinnatifida. The consequences of facilitative interactions, such as this one, are highly intricate and variable, depending on the health, structure and complexity of the “invaded” habitat.
The Asian tunicate Styela clava has also established as an alien species in the Wadden Sea. It is native to the northwest Pacific and presumed to have arrived in the European Atlantic on the hulls of Korean warships in 1952. The first registered collection of S. clava was in Plymouth Sound on the British coast (Minchin and Duggan 1988). As abiotic conditions were similar to its native range, the tunicate managed to establish the first population (Davis et al. 2007). After establishing populations throughout the southern British coast, S. clava continued its spread across the English Channel, along the northern European coast and in the Mediterranean Sea (Davis 2009; Davis et al. 2007). Davis et al. (2007) conducted a survey on the distribution expansion of this solitary ascidian in the northern Atlantic and concluded that on a local scale, natural dispersion might
4
account for the species’ spread. They presumed for the isolated populations that transport by humans was most likely the cause for expansion. The latter is a likely scenario for S. clava’s appearance in the Wadden Sea, with the first record on the island of Sylt in 1997 (Lützen 1998). 23 years after the first mention of S. clava in the Wadden Sea, in one of the marinas of Sylt, S. clava has been observed to have established a stable population, along with other alien species, such as the Pacific oyster Crassostrea gigas, competing for hard substrate with both native and non-native species (own observations). While there are mentions and studies of S. clava’s presence and spreading patterns (Davis et al. 2007), there is still a vast knowledge gap with regards to its impact on the native assemblages. Additionally, as seen from the previously given examples of S. muticum and U. pinnatifida, the impact exotic species have on the receiving communities and environment vary and need to be assessed individually and independently. To my best knowledge, there are only a couple of studies that investigated S. clava’s interaction with other species outside its native range (Pereyra et al. 2015; Pereyra et al. 2017). I believe that especially in case of a protected area, such as the UNESCO World Heritage of the Wadden Sea, it is of great importance to understand the impact this ascidian might have on the native assemblages.
Hence, the aim of my study was to ascertain the impact of alien species in fouling communities and their associated epibiota in the “transitional habitats”, the marinas, in the region of the Wadden Sea. To fulfil this aim, I investigated the epibiota associated with two of the most abundant biogenic substrates on the pontoons, the native blue mussel Mytilus edulis and the alien tunicate Styela clava. My decision to use these two species was firstly motivated by their presence and abundance on the pontoons, where they seemed to act as secondary settlement surface and to provide a natural additional substrate an extension of the artificial hard pontoons. The second reason for choosing these species was that they are also present in wild habitats, to where alien species usually spill-over after establishing populations in the anthropogenic habitats.
Bearing my study’s aim in mind, as well as my own observations at the specific study site, the marina of List (Sylt), I formulated the following couple of research questions:
1. What species make up the epibiota associated with the introduced species?
2. Is the epibiotic community associated with the introduced S. clava different compared to the community associated with the native M. edulis?
I hypothesized that Mytilus’ ability to build complex biogenic structures, which increase heterogeneity and substrate availability in sedimentary habitats, would also attract more epibionts in the marina, compared to the solitary Styela. However, because of facilitative effects caused by S. clava in other regions (Rodriguez 2006; Pereyra et al. 2017), I expected that the associated epibiotic community on the introduced Styela would differ from that on Mytilus by hosting more NIS and opportunistic species.
Materials and Methods Study site
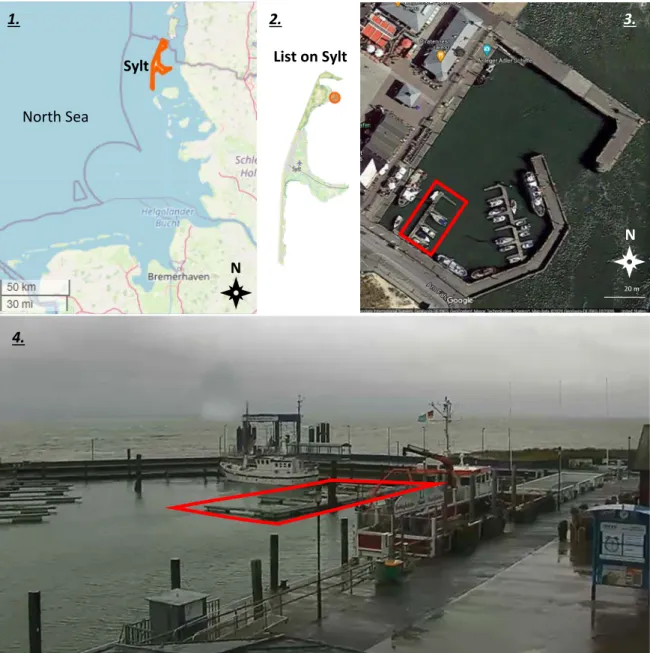
I conducted the study in the marina of List on the island of Sylt in the northern Wadden Sea (55°00'58.7"N, 8°26'22.3"E). The island of Sylt is characterised by a cold-temperate climate regime.
Temperature averages range between 4°C (winter) and 15°C (summer), with a mean annual sea surface temperature of around 9°C and maximum temperatures of 17° C (Buschbaum et al. 2006).
Salinity usually ranges between 30 and 32 psu (Buschbaum et al. 2006). The semi-diurnal tides have an average range of about 2 m (Buschbaum et al. 2006). A detailed description of the area is given by Reise (1985), Austen G (1994; Austen I 1994), Bayerl and Higelke (1994). For the study I decided
5
to use the organisms growing on the pontoons inside the marina (Fig. 2) rather than on the harbour walls, as the pontoons are always be submerged. This attribute would allow for a more stable and homogenous community.
Sampling of the organisms and their associated epibionts
My study material consisted of a total of 20 samplings of the two substrate providers, Styela clava individuals (10) and patches of Mytilus edulis (10), and the water in their immediate proximity (example samples in Fig. 1). I collected the samples from below the water line of the pontoons of the harbour from 7th April to 7th May 2020. By covering random patches of submerged pontoon with either Styela or Mytilus (collection area highlighted in Fig. 2) with 3 L sealable bags (27 cm x 23 cm, approx. 16 cm diameter), I was able to collect as much of the associated organisms as possible, including mobile and attached ones. In the case of Styela, I detached the tunicates by hand, so as to not break the foot, which is an important part in epibiotic settlement (own obs.).
The blue mussels were more firmly attached to the pontoon, consequently I scraped them off with a mason spatula. A Styela sample (coded St 1 to 10) consisted of a tunicate individual roughly 10- 15 cm in length, with the attached and swimming flora and fauna. A Mytilus sample (coded P 1 to 10) consisted of a 16 cm diameter scraping of blue mussels and their floral and faunal epibionts (around 10-12 cm2). I roughly differentiated between “adult” and “juvenile” blue mussels by considering the ones with a shell length bigger than 2 cm (up to around 6 cm) adults and the smaller ones, less than 2 cm (down to 3 mm) juveniles.
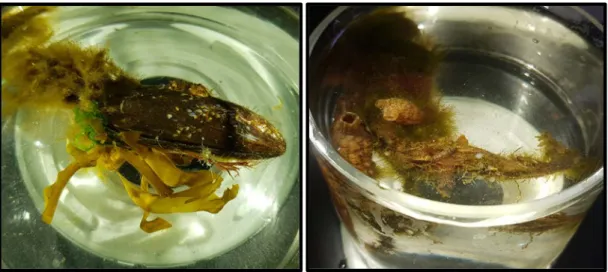
Fig. 1. Example of the collected Mytilus edulis (left) and Styela clava (right) samples during the evaluation of epibiota.
Before and after evaluation, I stored the samples in saltwater filled Kautex™ bottles at 10°C, in a temperature-controlled room. In the lab, I sieved the samples through a 500 µm mesh; detached the epibionts, identified them to the lowest possible taxonomic level using a stereo microscope1 and field keys for the identification of the North-East Atlantic flora and fauna (https://nature22.com/estran22/photographes.html [updated 20-Apr-20]; Kornmann and Sahling 1977; Hayward and Ryland 2017) and counted. During this phase, I noticed the presence of multiple orders of epibionts. I considered S. clava and M. edulis 1st order epibiota and studied their epibiota
1 For the identification of more cryptic characteristics of algae and occasionally fauna, we used the microscope with up to 400x magnification.
6
(2nd to higher order of epibiota). Hence, I assigned the term of “associated epibiota” (i.e. epibiota 2nd order) to those organisms that were either directly attached to the biogenic substrate (sessile) or in the immediate vicinity and or within the sampled seawater column (mobile). I only counted and identified the “associated epibiota”, ignoring their respective overgrowths (as much as possible).
Fig. 2. The location of the study. Highlighted: 1. the island of Sylt, in the German Wadden Sea; 2. List on Sylt; 3. and 4. the marina of List and the pontoons from where I sampled the organisms for this study. Collecting depth ranged from water surface level to about 20-30 cm under it. Sources: OpenStreetMap (1, 2), Google Maps – maps.google.com (3) and list- sylt.de (4)
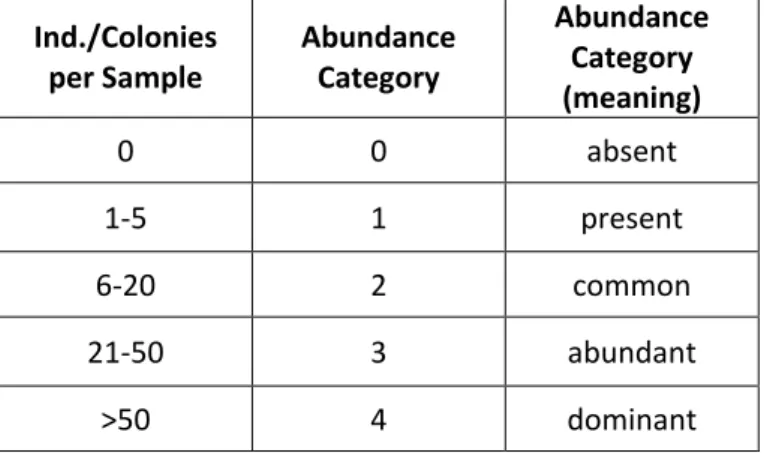
I documented the number of colonies for organisms, such as hydrozoans or bryozoans. On account of the many species with a lot of individuals, I decided to record categories of abundances, rather than the number of counted individuals. I, hence, made a subjective assessment of the abundance, following a similar study by Buschbaum et al. (2006), and assigned the abundances as seen in Table 1. The categories have been treated as numerical abundance data for the analyses that required
North Sea
Sylt List on Sylt
1. 2. 3.
4.
20 m
N
N
7
transformation of such data (Resemblance matrices for MDS plot, SIMPER and PERMANOVA) and are hereafter referred to only as “abundance”.
Table 1. Abundance categories used for the assessment of organisms per sample, according to Buschbaum et al. (2006).
Ind./Colonies
per Sample Abundance Category
Abundance Category (meaning)
0 0 absent
1-5 1 present
6-20 2 common
21-50 3 abundant
>50 4 dominant
Data analyses
For the statistical analysis I used the resulting data with the statistical PRIMER package, v6 (Clarke and Gorley 2006) and PERMANOVA+ add-on PRIMER v6 (Anderson et al. 2008). First, I transformed the abundance data with square root. Then I defined “station” (2 levels: “St”, “My” for the equivalent substrate) as a factor, that would be used when testing the data. On the data resulting from the resemblance matrix based on the Bray-Curtis similarity index, I ran univariate one-way PERMANOVA tests and an analysis of similarities (ANOSIM). For rejecting the null hypothesis, the yielded p-value had to be below the value of 0.05. Thus, the chance of a type I error (false positive results) was 5% (Anderson et al. 2008). For the purpose of illustrating the trends in multivariate data, I used MDS plots. I determined the difference in community composition using the similarity percentage routine (SIMPER) analysis. Species richness and diversity, as well as means and standard deviations, were calculated in R v. 4.0.0 “Arbor Day” (The R Foundation for Statistical Computing 2020, (R Development Core Team 2004-).
Indices
I used a set of indices to quantify certain attributes of the two substrates I wanted to compare.
The “Species richness” I defined as the number of species that have more than one individual record in one sample. For the measuring of the diversity, I employed the most commonly used diversity index, the Shannon Diversity Index (H’), which ranges from 0 to 5 (lowest to highest diversity), or 1.5 to 3.5 more often. The Shannon Diversity index is calculated according to the equation:
𝐻𝐻′ =− ∑ �𝑛𝑛𝑛𝑛𝑁𝑁×𝑙𝑙𝑙𝑙𝑛𝑛𝑛𝑛𝑁𝑁�,
where 𝑙𝑙𝑛𝑛stands for number of individuals of the species 𝑛𝑛 and 𝑁𝑁 is the total number of individuals for the site (flutterbys.com.au [updated 11-Mar-15]).
To determine the community’s evenness, I used Pielou’s evenness (J). This index quantifies how homogeneous or even a community or ecosystem is, with regards to the (numerical) abundance of the identified species. Pielou’s evenness ranges from 0 to 1, with a lower index signifying a lower community evenness and the presence of a dominant species. Using the previously calculated
8
Shannon Diversity Index (H’), I inferred Pielou’s index (J). This index is calculated based sampled diversity (H’) and the maximum potential diversity (Hmax), per the following equation:
𝐽𝐽= 𝐻𝐻′
𝐻𝐻𝑚𝑚𝑚𝑚𝑚𝑚
Results
Species richness & Diversity
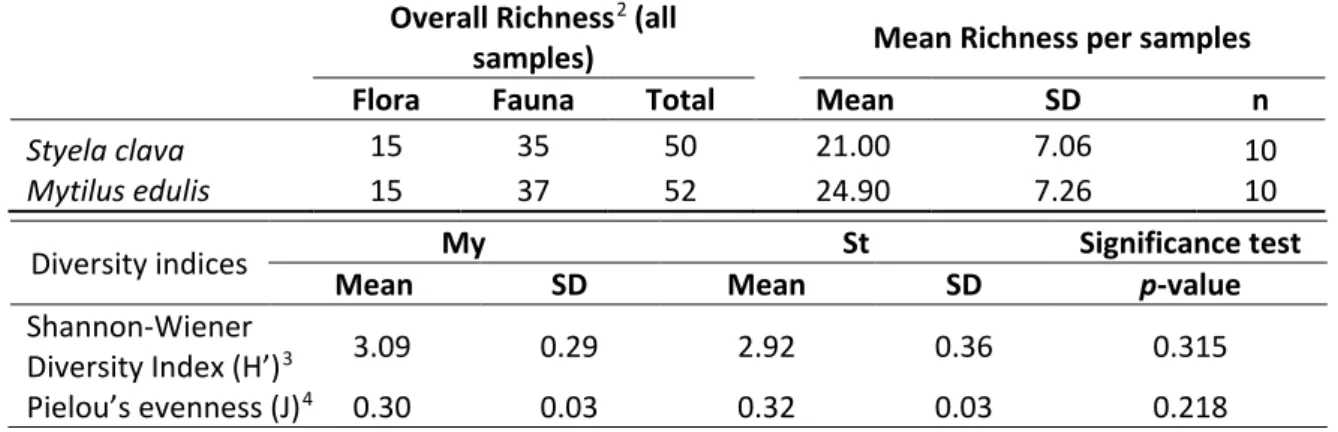
In total, I identified 61 species of epifauna and flora on the two biogenic substrates. On Styela (St), I counted 50 associated taxa, compared to 52 species on Mytilus (My). Styela also had a lower average richness (21.00 ± 7.06, n = 10) of epibionts than Mytilus (24.90 ± 7.26, n = 10). The data displayed relatively high diversity indexes for both substrates, Mytilus scoring slightly higher Shannon (3.09) indices, than Styela (2.92). The two substrates both scored around 0.3 on Pielou’s Evenness index. The value of this index, on the lower end of the scale (between 0 and 1), hints at the presence of certain species dominating the communities. There were no significant differences between the different substrates with regards to richness, diversity or evenness (Table 2). The species collected and identified in the 10 samples of two substrate ranged from 11 to 31 (St) and 15 to 34 (My). I observed a steady increase in the number of species identified in samples of both substrates over the sampling duration of a month (Fig. 3). By plotting the species richness of the collected samples against the predicted species richness (Fig. 4), I verified that the number of samples collected was high enough. The predicted species richness was based on logarithmic trendlines with the following formulas and R2:
• Mytilus: y = 16.224ln(x) + 14.094 R²My = 0.9641 (96.41%)
• Styela: y = 15.189ln(x) + 11.158 R²St = 0.9384 (93.84%)
According to literature (Moreno and Halffter 2000; Willott 2001), a fit (R2) of the actual species richness curve with the trendline, i.e. the predicted species richness, of over 90% allows for a meaningful comparison of the sampled species with the overall communities.
Table 2. Species richness (p-value = 0.239) and diversity on Mytilus (My) and Styela (St): Overall richness (all samples), mean richness (averaged per samples) including standard deviation (SD) and replication (n).
Overall Richness2 (all
samples) Mean Richness per samples
Flora Fauna Total Mean SD n
Styela clava 15 35 50 21.00 7.06 10
Mytilus edulis 15 37 52 24.90 7.26 10
2 The number of species that have more than one individual record
3 Diversity measure, assuming sample was collected randomly - H′ values range from 0 to 5, but more often range from 1.5 to 3.5 flutterbys.com.au ([updated 11-Mar-15]).
4 How homogeneous or even a community or ecosystem is. Based on the abundances of its species. J ranges between 0 and 1. A lower J stands for less evenness in communities (and the presence of a dominant species.
flutterbys.com.au ([updated 11-Mar-15]).
Diversity indices My St Significance test
Mean SD Mean SD p-value
Shannon-Wiener
Diversity Index (H’)3 3.09 0.29 2.92 0.36 0.315
Pielou’s evenness (J)4 0.30 0.03 0.32 0.03 0.218
9
Fig. 3. Number of epibiotic species collected and identified in the 10 samplings of the two biogenic substrates – Styela clava (Styela) and Mytilus edulis (Mytilus). Sampling occurred over the duration of one month (7th April – 7th May 2020).
Fig. 4. Species accumulation curve for the 10 samplings of the two biogenic substrates - Styela and Mytilus. The broken lines represent the logarithmic trendline, which predicts the species richness. A fit (R2) of over 90% of the log trendline with the actual species accumulation curves means that the samples offer an accurate view of the whole species richness and allow for a comparison between the collected and overall community , according to the literature (Moreno and Halffter 2000; Willott 2001).
Community analysis
With a total of 14 different taxa on both substrates, Crustacea was the most diverse and abundant taxonomic group, followed by Rhodophyta (7 taxa), Phaeophyta (6 taxa) and Coelenterata (6 taxa).
The comparative analysis of the species richness and diversity did not reveal significant differences, however both PERMANOVA pair-wise testing (P = 0.0025) and the ANOSIM (R-statistic5 = 0.21; P <
0.004) procedure based on the square root transformed abundance data revealed significant differences between the samples. The two substrates had 41 species in common and 9 (St) or 11 (My) species exclusively (see Table 5 in Appendix). The species appearing exclusively on one
5“An R value close to ‘1.0’ suggests dissimilarity between groups while an R value close to ‘0’
suggests an even distribution of high and low ranks within and between groups. R values below ‘0’
suggest that dissimilarities are greater within groups than between groups.” ANOSIM - GUSTA ME ([updated 02-Nov-20])
0 10 20 30 40
1 2 3 4 5 6 7 8 9 10
Number of species
Sample pair
Species collected and identified
Styela Mytilus
Mytilus trendline R²My= 0.9641 Styela trendline R²St= 0.9384 0
10 20 30 40 50 60
1 2 3 4 5 6 7 8 9 10
Number of species
Sample pair
Species accumulation curve
Mytilus Styela Log. (Mytilus) Log. (Styela)
10
substrate did not display a pattern at the level of a taxonomic group and about half of them only appeared in 1 out of 10 samplings.
MDS
The Multidimensional scaling (MDS) plot (Fig. 5), based on the previously mentioned square root transformed abundance data, displays the 10 samples taken for each of the two biogenic substrates. The 20 samples with the abundance of the identified epibiotic species as variables, have been analysed based on the differential factor “station” with two levels, based on the type of substrate – Styela clava (St) and Mytilus edulis (P). The MDS shows the samples grouped in two substrate (station) groups. Some samples (St4 and P2) slightly distance themselves from the central position of their respective group. Otherwise, the samples are in relative proximity of one another.
Fig. 5. Multidimensional scaling (MDS) image of the epibiotic (flora and fauna) communities associated with Styela clava and Mytilus edulis collected from pontoons in the harbour of List on the island of Sylt. Analysis is based on the square root transformed abundance data of species and on Bray-Curtis similarities. Samples are identified by the biogenic substrate: St (Styela clava, n=10), P (Mytilus edulis, n = 10).
The SIMPER analysis highlighted the species responsible for the significant similarities between replicates (Table 3), as well as dissimilarities between the substrates (Table 4). In particular Crassicorophium bonellii (CRUSTACEA) and juvenile6 Mytilus edulis (BIVALVIA) stood out for their contributions to the in-group similarities, respectively groups dissimilarities.
The epibiota on Styela was dominated by Crustaceans: Crassicorophium bonellii (CRUSTACEA) (9.46%), Monocorophium sextonae (CRUSTACEA) (9.37%) and Balanus crenatus (CRUSTACEA) (7.98%). Just these three species made up more than 25% of the individuals found on Styela. Other species with significant contributions were two alien species, Tricellaria inopinata (BRYOZOA) (8.29%) and Botryllus schlosserii (TUNICATA) (7.98%), the red seaweed Polysiphonia sp.
(RHODOPHYTA) (5.93%) and the bryozoan Electra pilosa (BRYOZOA) (5.05%).
The community on Mytilus was also dominated by Crustaceans, their contributions adding up to almost 35% on this substrate. Among the Crustaceans, Crassicorophium bonellii (CRUSTACEA) had the highest contribution to the community composition with 8.48 %, followed by Balanus crenatus (CRUSTACEA) (7.89%), Austrominius modestus (CRUSTACEA) – an alien species (7.81%), Monocorophium sextonae (CRUSTACEA) (5.82%) and Gammarus locusta (CRUSTACEA) (4.81%).
6 ranging in size between 3 mm and approx. 5 cm.
11
Other species who contributed significantly to the community composition were the red seaweed Ceramium rubrum agg. (RHODOPHYTA) (4.91%) and other individuals of Mytilus edulis (BIVALVIA) (4.39%).
Table 3. Similarity percentages (SIMPER) analysis of epibiota. Average epibiota community similarities among samples.
Note: Refer to the Table 5 in Appendix for a full list of species; highlighted – non-native species with invasive characteristics.
The SIMPER analysis also displayed a 48.08% dissimilarity with regards to the abundance of associated epibiont communities between Styela and Mytilus (Table 4). The presence and abundance of (juvenile) Mytilus edulis (BIVALVIA) contributed most (4.15%) to the difference between the biogenic substrates. Another species which significantly distinguished the epibiota of the two substrates were the tunicate Molgula sp. (TUNICATA) (3.61%), the Australian barnacle Austrominius modestus (CRUSTACEA) (2.89%), the polychaete Myrianida prolifera (POLYCHAETA) (2.86%) and the crustacean Gammarus locusta (CRUSTACEA) (2.75%).
I also compared the communities of the two substrates with regards to the motility trait. Out of the 61 identified species, 21 (34.4%) exhibited mobile behaviour, while the other 40 species (65.5%) displayed sessile behaviour. In the SIMPER mobile analysis, the average dissimilarity between the Styela and Mytilus groups was 46.20%, with the biggest contributors being Myrianida prolifera (POLYCHAETA) (11.06%) and Gammarus lacusta (CRUSTACEA) (10.70%). The SIMPER analysis based on the sessile species presented an average dissimilarity of 48.81% between the Styela and Mytilus groups. The biggest contributors to the differentiation between substrates were juvenile blue mussels (5.59%) attached to the sampled M. edulis, as well as the higher abundance of Molgula sp. (TUNICATA) (4.96%) and Austrominius modestus (CRUSTACEA) (3.95%) on M. edulis than on S. clava.
Substrates Styela % Mytilus %
(average
similarity %) 57,08% Contribution 56,79% Contribution
Species dominating epibiota
Crassicorophium
bonellii 9,46 Crassicorophium
bonellii 8,48
Monocorphium
sextonae 9,37 Balanus crenatus 7,89
Tricellaria inopinata 8,29 Austrominius
modestus 7,81
Balanus crenatus 7,98 Botryllus schlosserii 6,12 Botryllus schlosserii 7,98 Monocorophium
sextonae 5,82
Polysiphonia sp. 5,93 Ceramium rubrum
agg 4,91
Electra pilosa 5,05 Gammarus locusta 4,81 Mytilus edulis 4,39 Cumulative
percentage Σ 54,07 50,24
> 50%
12
Table 4. Similarity percentages (SIMPER) analysis of epibiota. Average epibiota community dissimilarities between substrates
Substrates Styela-Mytilus %
(average dissimilarity %) 48,08% Contribution
Species distinguishing Mytilus edulis 4,15
epibiota of different Molgula sp. 3,61
substrates Austrominius modestus 2,89
Myrianida prolifera 2,86
Gammarus locusta 2,75
Cumulative percentage Σ 16,25
Discussion
Generally, the spreading and establishing of nonindigenous species (NIS) via anthropogenic pathways is viewed as a threat to native assemblages (Davis 2003). In the Wadden Sea alone, 66 such species were identified, the Asian tunicate Styela clava among them (Buschbaum et al. 2012).
However, since its first mention in the area (Lützen 1998), 23 years have passed. Until this current study no research has been conducted to ascertain whether the Asian tunicate poses a threat to the native assemblages, by attracting other non-indigenous species.
With this in mind, my study examined the epibiota associated with the NIS Styela clava in a marina in the northern part of the island of Sylt. Records of S. clava’s abundance in the Wadden Sea are scarce, the published studies usually focusing on other species (Buschbaum et al 2006; Davis et al.
2007; Buschbaum et al. 2009). In my approach I focus on S. clava and its epibiota in the marina of List. While epibiota has been shown to vary between marinas (Glasby 1997), I am confident my study is a good foundation for understanding the effects of S. clava as a substrate provider. Upon comparing the epibiotic community associated with the most abundant native hard substrate provider in the Wadden Sea, the blue mussel M. edulis, to that of the NIS S. clava, I observed that the two shared most of the species identified. What distinguished the two communities was a limited number of organisms’ presence and abundance, or lack thereof, which I believe relates to the behaviour of the substrate givers.
Mytilus edulis – ecosystem engineer and biofouling organism
Regarding natural habitats, Albrecht (1998) wrote: “In the Wadden Sea primary hard substrate is practically non-existent.” In these soft sediment tidal flats, accumulations of bivalves, like the native blue mussel Mytilus edulis, build reefs and act as secondary hard substrate, providing refuges from competition, predation and disturbance and hard surface for settlement (Buschbaum et al. 2009). In artificial habitats, as I have also observed, M. edulis exhibits fouling behaviour and attaches itself to any hard substrate – pontoons (Connell 2000), boats (Berntsson and Jonsson 2003) and other blue mussels (Fig. 5, Table 4). I believe this predisposition to clustering, which increases the habitats heterogeneity, is responsible for the slightly higher richness and epibiotic diversity associated with M. edulis. I remarked that even the other studied substrate provider, S.
clava, was observed in one of the samples as an epibiont attached to a blue mussel.
13 Styela clava – epibiont and substrate provider
Indeed, S. clava has mostly been recorded as an epibiont on both artificial (Lützen 1998; Locke et al. 2007; Lackschewitz et al. 2015) and natural habitats. In the latter, the tunicate has been observed in high abundances on natural bivalve built reefs (Davis et al. 2007) and even on algae (Buschbaum et al. 2006; Buschbaum et al. 2012). In high abundance and with a clear impact of one epiphyte, the Asian kelp Undaria pinnatifida, shown to be facilitated by the tunicates presence, S.
clava was indirectly recognized as an ecosystem engineer (Pereyra et al. 2015). Pereyra et al. (2015) provided the first look into the interaction between S. clava, as a substrate provider, and the associated epiphyte. However, as far as I know, my study is the first one not only in the Wadden Sea area, but worldwide, to look at all the epibiota associated with the introduced Asian tunicate S. clava.
Differences and commonalities in epibiotic communities
Studies have observed that M. edulis has several mechanism (texture, chemical composition of the shell) to prevent the attachment of fouling organisms (Wahl et al. 1998; Bers and D'Souza et al.
2006; Bers and Prendergast et al. 2006). Despite these mechanisms, in my study the blue mussel had an epibiotic community similar in composition and abundance with that of S. clava, which as far as I know, does not have any such biofouling prevention mechanisms. In the marina of List/Sylt, I identified 50 taxa associated with the tunicate S. clava and 52 with the blue mussel M. edulis. The dissimilarities between the epibiotic communities were caused by the differences in the abundance of certain distinguishing organisms (see Table 4). However, for the most part the communities of the two biogenic substrates showed many similarities, from the overall species richness and diversity to the community composition. On both substrates faunal species were more abundant and frequent than algal species.
Epibiotic communities – Epiphytes
I can explain the lower abundance and number of algal species in the communities associated with the two substrate providers through the characteristics of the substrate surface. As a result of their innate behaviour, their surface is covered in biodeposites, like excretion residues or excess particles, which when squirted tend to settle in the proximity (mouth, anus, or other adjacent surface) (Jiang et al. 2008). Albrecht (1998) observed that algal zygotes have a significant recruitment failure because of the accumulation of faeces and pseudofaeces, which shaded, buried and eventually killed the new settlers. Although with the same number of algal species in the epibiotic communities of the two substrates, the algae on S. clava were more abundant than on M. edulis (Table 3). I accounted this finding to M. edulis cleaning its shell surface with its foot and inhibiting the growth of biofoulers (Theisen 1972), while considering S. clava’s lack of such antifouling mechanisms.
Epibiotic communities – Epifauna
The faunal epibiota was mainly dominated by Crustacean species. Sonier et al.’s (2021) study on the faecal matter feeding of M. edulis and S. clava can be linked to my study’s most abundant Crustacean family, the Corophiidae, with two dominant species in the epibiotic communities, Crassicorophium bonellii and Monocorophium sextonae. Similar results were observed in a study on epibiotic communities associated with red algae, were C. bonellii was also the most common
14
and abundant amphipod species (Uryupova et al. 2012). Additionally, I observed the two corophiid species living in and occasionally feeding on the organic material accumulated on the biogenic substrate providers. My observations regarding their feeding behaviour, as well them living in organic matter and building “tube” dwelling, is in accordance with the taxonomic literature (Crawford 1937; Ruffo 1982; Uryupova 2005; Casu et al. 2009). The accumulation of organic matter, and consequently the presence and abundance of corophiids, seemed to differ between the substrate providers.
In S. clava’s case organic matter accumulates in the irregular longitudinal wrinkles and grooves of its tunic (see Fig. 6). These ridges with biomatter, or rather accumulations of “’biofilms’ […]
consisting of bacteria, microscopic algae, fungi, protozoans and their secretions, as well as other organic compounds that stick to the particle surface” (Casu et al. 2009), seemed attractive to the corophiids and other filter feeders (the colonial ascidian Botryllus schlosserii, the bryozoan Electra pilosa, the alien bryozoan Tricellaria inopinata etc). The alien bryozoan Tricellaria inopinata, another highly abundant species on S. clava along sides the corophiids, has been observed previously in association with the tunicate (Arenas et al. 2006).
Fig. 6. The tunic or "skin" of Styela clava has irregular longitudinal wrinkles and grooves, where organic matter accumulates and epibiota settles. Various epibionts, Botryllus schlosserii colonies (blueish and pinkish tests – left and
right) and Balanus crenatus (right) on the surface of S. clava.
In M. edulis’ case corophiids seemed to gather in the interstices at the bases of the balanoids native Balanus crenatus and the introduced Austrominius modestus. Buschbaum and Saier’s (2001) study on balanoids overgrowing M. edulis to the point of influencing mussel growth, clearly displayed the balanoids preference for the blue mussel in wild habitats. In the man-made habitat of the marina, I also observed this preference, as balanoid presence on S. clava was not as strong as on the mussels. It might also be that the balanoids were outcompeted for settlement surface on S. clava by other biofouling epibionts, such as the invasive tunicate Botryllus schlosserii. Similar observations were reported by Anger (1978) in a epifaunal community development study in Helgoland Harbour, North Sea. He observed that only a major physical disturbance stopped B.
schlosserii from becoming dominant in a barnacle-ascidian community.
15 Mytilus, Styela and interactions with neobiota
Armonies et al. (2018) compiled a list of marine flora and fauna of around the island of Sylt. 397 species, out of a total of 2758 species identified, were listed under the neobiota category. Out of the 38 aquatic species, in my study I ascertained 7 species: the acorn barnacle Austrominius modestus, the bryozoan Tricellaria inopinata, the Pacific oyster Crassostrea gigas, the Japanese seaweed Sargassum muticum, the Asian tunicate Styela clava and two encrusting, colonial tunicates Botryllus schlosserii and Botrylloides violaceus.
With regards to non-native species in the epibiotic communities, my study revealed that S. clava’s NIS epibiont diversity was slightly less than of M. edulis. The two studied substrate providers were also similar regarding the associated epibiont alien species. This contradicted my initial hypothesis, the NIS in the marina of List would be more attracted to a NIS substrate provider. Interestingly, an important NIS substrate provider, the Pacific oyster Crassostrea gigas, appeared in my samples as an epibiont only on the blue mussel. This finding relates to a study by Reise et al. (2017a, 2017b), who observed the coexistence of the native M. edulis and alien C. gigas in multi-layered mixed reefs. I expected to also find the oyster in S. clava’s epibiotic community, because of the important role the spat of oyster C. gigas played in the spread of the Asian tunicate (Lützen 1998; Davis 2009;
Dupont et al. 2010; Wolff and Reise 2011). However, the oysters absence might be explained by a study on the predation of oyster larvae by the tunicate (Osman et al. 1989).
Among the epibiota of both M. edulis and S. clava, I found another NIS, the Japanese seaweed Sargassum muticum. The seaweed, despite being labelled as an “alien invader”, has been shown to attract epibionts and positively impact the biodiversity of native assemblages (Buschbaum et al.
2006). Surface providers of the higher orders, like this seaweed, each enhanced the epibiotic communities in their own way. One of this study’s limitation is, for logistic reasons, having to draw the line at the 2nd order of epibiota, i.e. the epibiota of S. clava and M. edulis.
Methodological considerations
A limitation was noted with respect to the sampling period of my study. Some differences between samples could be seen in the respective grouping and dispersion (Fig.3). These shifts appear over the course of the sampling period (30 days) and I assume this occurred because of either abiotic or biotic factors, or maybe a combination of both. The first factor I considered was temperature at the time of sampling. During the sampling period the sea-surface temperature rose from 6.4°C to 10.1°C (Ocean Forecast [updated 03-Nov-20]) according to satellite measurements. I did not measure the water temperature for the first 6 (out of 20) samples, however the temperatures measured for the rest were between 10° and 11.4°C (avg. measured temperature of 10.8°C).
Temperature measurements between 1984-2007 put the average temperature for April at around 7(±2)°C and at around 12(±2)°C (van Beusekom et al. 2010). I believe my measured temperatures are within the expected temperature range. So, it is possible that the slight community shift, did not happen because of the temperature variations, but rather because of changes other seasonally variable abiotic factors, such as light intensity and duration. Related to these factors the increase in primary production (spring bloom of phytoplankton) also overlaps with my study’s period of increase in species and abundance (van Beusekom et al. 2009). In my analyses I also did not consider the sampling location, randomly sampling from the pontoons without taking current directions and light expositions into account. Distance of the pontoons from the marina entrance has been shown to play a significant role in the variability of epibiotic assemblages (Toh et al. 2017).
7 one species is a terrestrial vascular plant – the English cordgrass Spartina anglica
16
This disregard might, like seasonal variation, explain the significant differences between the samples.
Taking into account the limitation of my current study, I will definitely strive to fill in these blanks in future research. Additionally, I would be very interested to see a comparative study between the native species and their introduced counterpart – M. edulis’ vs. Crassostrea gigas’ epibiota both in the marina and in the natural habitats. It would also be interesting to see whether the epibiotic communities associated with the Asian tunicate and the blue mussel in the marina differ from those in the wild and in the mussel farms off the coast of the island.
Conclusion
While the introduced tunicate S. clava does not exhibit reef-building behaviour, like the native blue mussel M. edulis, on its rugged, leather-like surface a complex microhabitat thrives. My investigation recorded the epibiota associated with the solitary ascidian in the marina of List. I expected differences in the associated communities of S. clava and M. edulis. However, these were not significant from the species point of view, but rather abundance and sample-wise. I found interesting and meaningful similarities to the community associated with the native ecosystem engineer M. edulis. Overall, in light of my results, I do not believe S. clava is a direct threat to the native assemblages, however further research is needed to rule it out completely. As such, I hope my study can be seen as an a priori investigation for further research on the dynamic of these two biogenic substrate providers.
Acknowledgements
I would like to thank my two research supervisors, Prof. Dr. Kai Bischof (University of Bremen) and Dr. Christian Buschbaum (AWI), for their endless patience, good mentoring and for providing me with the freedom (and resources) to conduct this study. Additionally, I would like to thank the DAAD for funding my stay in Germany for the duration of the Master programme and indirectly, the current study also. Last but not least, I would like to express how grateful I am to my family, Eilish, Sheng and all my other beautiful and loving classmates and colleagues – I would not have made it without you, thank you so, so much!
17
References
Albrecht AS. 1998. Soft bottom versus hard rock. Journal of Experimental Marine Biology and Ecology. 229(1):85–109. doi:10.1016/S0022-0981(98)00044-6.
Anderson MJ, Gorley RN, Clarke K. 2008. PERMANOVA+ for PRIMER: Guide to Software and Statistical Methods. Plymouth: PRIMER-E.
Anger K. 1978. Development of a subtidal epifaunal community at the island of Helgoland. Helgol Mar Res. 31(4):457–470. doi:10.1007/BF02189494.
ANOSIM - GUSTA ME. [updated 02-Nov-20]. [place unknown]: [publisher unknown]; [accessed 06- Nov-20]. https://sites.google.com/site/mb3gustame/hypothesis-tests/anosim.
Arenas F, Bishop J, Carlton JT, Dyrynda PJ, Farnham WF, Gonzalez DJ, Jacobs M, Lambert C, Lambert G, Nielsen SE, et al. 2006. Alien species and other notable records from a rapid assessment survey of marinas on the south coast of England. J. Mar. Biol. Ass. 86(6):1329–1337.
doi:10.1017/S0025315406014354.
Armonies W, Asmus H, Buschbaum C, Lackschewitz D, Reise K, Rick J. 2018. Microscopic species make the diversity: a checklist of marine flora and fauna around the Island of Sylt in the North Sea. Helgolander Wiss. Meeresunters. 72(1):1–9. En;en. doi:10.1186/s10152-018-0512-8.
Austen G. 1994. Hydrodynamics and particulate matter budget of Königshafen, southeastern North Sea. Helgol Mar Res. 48(2-3):183–200. doi:10.1007/BF02367035.
Austen I. 1994. The surficial sediments of Königshafen-variations over the past 50 years. Helgol Mar Res. 48(2-3):163–171. En;en. doi:10.1007/BF02367033.
Bayerl K-A, Higelke B. 1994. The development of northern Sylt during the Latest Holocene. Helgol Mar Res. 48(2-3):145–162. En;en. doi:10.1007/BF02367032.
Berntsson KM, Jonsson PR. 2003. Temporal and spatial patterns in recruitment and succession of a temperate marine fouling assemblage: a comparison of static panels and boat hulls during the boating season. Biofouling. 19(3):187–195. eng. doi:10.1080/08927014.2003.10382981.
Bers AV, D'Souza F, Klijnstra JW, Willemsen PR, Wahl M. 2006. Chemical defence in mussels:
antifouling effect of crude extracts of the periostracum of the blue mussel Mytilus edulis.
Biofouling. 22(3-4):251–259. eng. doi:10.1080/08927010600901112.
Bers AV, Prendergast GS, Zürn CM, Hansson L, Head RM, Thomason JC. 2006. A comparative study of the anti-settlement properties of mytilid shells. Biol Lett. 2(1):88–91. eng.
doi:10.1098/rsbl.2005.0389.
Billings WD, Golley F, Lange OL, Olson JS, Remmert H, Reise K. 1985. Tidal Flat Ecology. Berlin, Heidelberg: Springer Berlin Heidelberg (Ecological Studies; vol. 54). ISBN: 0070-8356.
doi:10.1007/978-3-642-70495-6.
Buschbaum C, Chapman AS, Saier B. 2006. How an introduced seaweed can affect epibiota diversity in different coastal systems. Marine Biology. 148(4):743–754. doi:10.1007/s00227-005-0128-9.
Buschbaum C, Dittmann S, Hong J-S, Hwang I-S, Strasser M, Thiel M, Valdivia N, Yoon S-P, Reise K.
2009. Mytilid mussels: global habitat engineers in coastal sediments. Helgolander Meeresunters.
63(1):47–58. En;en. doi:10.1007/s10152-008-0139-2.
Buschbaum C, Lackschewitz D, Reise K. 2012. Nonnative macrobenthos in the Wadden Sea
ecosystem. Ocean & Coastal Management. 68:89–101. doi:10.1016/j.ocecoaman.2011.12.011.
Buschbaum C, Saier B. 2001. Growth of the mussel Mytilus edulis L. in the Wadden Sea affected by tidal emergence and barnacle epibionts. Journal of Sea Research. 45(1):27–36. http://
www.sciencedirect.com/science/article/pii/S1385110100000617. doi:10.1016/S1385- 1101(00)00061-7.
18
Casu D, Ceccherelli G, Sechi N, Rumolo P, Sarà G. 2009. Caulerpa racemosa var. cylindracea as a potential source of organic matter for benthic consumers: evidences from a stable isotope analysis. Aquat Ecol. 43(4):1023–1029. doi:10.1007/s10452-008-9223-6.
Clarke K, Gorley RN. 2006. PRIMER v6: User Manual/Tutorial. Plymouth Routines in Multivariate Ecological Research. Plymouth: PRIMER-E. 193 p.
Connell SD. 2000. Floating pontoons create novel habitats for subtidal epibiota. Journal of
Experimental Marine Biology and Ecology. 247(2):183–194. doi:10.1016/S0022-0981(00)00147- 7.
Crawford GI. 1937. A review of the amphipod genus Corophium, with notes on the British species. J.
Mar. Biol. Ass. 21:589–629. http://www.marinespecies.org/
aphia.php?p=sourcedetails&id=190796.
Davis M. 2009. Styela clava (Tunicata, Ascidiacea) – a new threat to the Mediterranean shellfish industry? AI. 4(1):283–289. doi:10.3391/ai.2009.4.1.29.
Davis M, Lützen J, Davis M. 2007. The spread of Styela clava Herdman, 1882 (Tunicata, Ascidiacea) in European waters. AI. 2(4):378–390. doi:10.3391/ai.2007.2.4.6.
Davis MA. 2003. Biotic Globalization: Does Competition from Introduced Species Threaten Biodiversity? BioScience. 53(5):481. doi:10.1641/0006-3568(2003)053[0481:BGDCFI]2.0.CO;2.
Dupont L, Viard F, Davis MH, Nishikawa T, Bishop JDD. 2010. Pathways of spread of the introduced ascidian Styela clava (Tunicata) in Northern Europe, as revealed by microsatellite markers.
Biological Invasions. 12(8):2707–2721. doi:10.1007/s10530-009-9676-0.
Engelen AH, Serebryakova A, Ang P, Britton-Simmons K, Mineur F, Pedersen MF, Arenas F,
Fernandez C, Steen H, Svenson R. 2015. Circumglobal invasion by the brown seaweed Sargassum muticum. Oceanography and Marine Biology: An Annual Review. 53:81–126.
Epstein G, Foggo A, Smale DA. 2019. Inconspicuous impacts: Widespread marine invader causes subtle but significant changes in native macroalgal assemblages. Ecosphere. 10(7):169.
doi:10.1002/ecs2.2814.
Epstein G, Smale DA. 2017. Undaria pinnatifida: A case study to highlight challenges in marine invasion ecology and management. Ecol Evol. 7(20):8624–8642. eng. doi:10.1002/ece3.3430.
Epstein G, Smale DA. 2018. Environmental and ecological factors influencing the spillover of the non- native kelp, Undaria pinnatifida, from marinas into natural rocky reef communities. Biol
Invasions. 20(4):1049–1072. eng. doi:10.1007/s10530-017-1610-2.
Fletcher RL, Farrell P. 1998. Introduced brown algae in the North East Atlantic, with particular respect toUndaria pinnatifida (Harvey) suringar. Helgoländer Meeresuntersuchungen. 52(3- 4):259–275. En. https://hmr.biomedcentral.com/articles/10.1007/BF02908901.
doi:10.1007/BF02908901.
flutterbys.com.au. [updated 11-Mar-15]. Species richness and diversity. [place unknown]: [publisher unknown]; [accessed 15-Nov-20]. https://www.flutterbys.com.au/stats/tut/tut13.2.html.
Glasby TM. 1997. Analysing data from post-impact studies using asymmetrical analyses of variance:
A case study of epibiota on marinas. Austral Ecol. 22(4):448–459. doi:10.1111/j.1442- 9993.1997.tb00696.x.
Glasby TM, Connell SD, Holloway MG, Hewitt CL. 2007. Nonindigenous biota on artificial structures:
could habitat creation facilitate biological invasions? Mar Biol. 151(3):887–895.
doi:10.1007/s00227-006-0552-5.
Grosholz E, Ruiz G. 1996. Predicting the impact of introduced marine species: Lessons from the multiple invasions of the European green crab Carcinus maenas. Biological Conservation. 78(1- 2):59–66.
Grosholz E, Ruiz GM, Dean CA, Shirley KA, Maron JL, Connors PG. 2000. The impacts of nonindigenous marine predator in a California Bay. Ecology. 81(5):1206–1224. en. https://
19
esajournals.onlinelibrary.wiley.com/doi/full/10.1890/0012-
9658%282000%29081%5B1206%3ATIOANM%5D2.0.CO%3B2?casa_
token=ehh8p1OFn28AAAAA%3ANwS0utTg1kcp3YaIUmmLvk5g4PGNWhsuK1LKOSigQv_
VtEJEZ333OD_rqCynnaicm-jPl9nE1H_JtQGd. doi:10.1890/0012- 9658(2000)081[1206:TIOANM]2.0.CO;2.
Hayward PJ, Ryland JS, editors. 2017. Handbook of the marine fauna of north-west europe. 2ND revised edition. [Place of publication not identified]: OXFORD UNIV Press. 785 p. ISBN:
9780199549450. eng.
https://nature22.com/estran22/photographes.html. [updated 20-Apr-20]. Identification key
amphipodes Senticaudata. [place unknown]: [publisher unknown]; [accessed 20-Apr-20]. https://
nature22.com/estran22/crustace/amphipodes/amphipodes.html.
James K. 2016. Project: Reviewing invasion impact: Undaria pinnatifida; (PDF) A review of the impacts from invasion by the introduced kelp Undaria pinnatifida. [place unknown]. en. https://
www.researchgate.net/project/Reviewing-invasion-impact-Undaria-pinnatifida.
Jiang A, Yu Z, Cai W, Wang C. 2008. Feeding selectivity of the marine ascidian Styela clava.
Aquaculture Research. 39(11):1190–1197. doi:10.1111/j.1365-2109.2008.01983.x.
Kornmann P, Sahling PH. 1977. Meeresalgen von Helgoland. Helgol Mar Res. 29(1-2):1–289. De;de.
doi:10.1007/BF01611137.
Kraan S. 2017. Undaria marching on; late arrival in the Republic of Ireland. Journal of Applied Phycology. 29(2):1107–1114. eng. doi:10.1007/s10811-016-0985-2.
Lackschewitz D, Reise K, Buschbaum C, Karez R. 2015. Neobiota in deutschen Küstengewässern: - Eingeschleppte und kryptogene Tier-und Pfanzenarten an der deutschen Nord- und Ostseeküste.
[place unknown]: [publisher unknown]. https://epic.awi.de/id/eprint/43415/1/neobiota.pdf.
list-sylt.de. [updated 16-Nov-20]. Webcam am Lister Hafen. [place unknown]: [publisher unknown];
[accessed 16-Nov-20]. https://www.list-sylt.de/service/webcams.
Locke A, Hanson JM, Ellis KM, Thompson J, Rochette R. 2007. Invasion of the southern Gulf of St.
Lawrence by the clubbed tunicate (Styela clava Herdman): Potential mechanisms for invasions of Prince Edward Island estuaries. Journal of Experimental Marine Biology and Ecology. 342(1):69–
77. http://www.sciencedirect.com/science/article/pii/S0022098106005752.
doi:10.1016/j.jembe.2006.10.016.
Lützen J. 1998. Styela clava Herdman (Urochordata, Ascidiacea), a successful immigrant to North West Europe: ecology, propagation and chronology of spread. Helgolander Meeresunters. 52(3- 4):383–391. en. https://hmr.biomedcentral.com/track/pdf/10.1007/BF02908912.
doi:10.1007/BF02908912.
Macleod A, Cook EJ, Hughes D, Allen C. 2016. Investigating the Impacts of Marine Invasive Non- Native Species.: A report by Scottish Association for Marine Science Research Services Ltd for Natural England & Natural Resources Wales. [place unknown]: [publisher unknown]; [updated 22-Jun-20; accessed 22-Jun-20]. 59 p. Natural England Commissioned Reports. http://
publications.naturalengland.org.uk/search?q=styela&num=100.
Minchin D, Duggan CB. 1988. The Distribution of the Exotic Ascidian, Styela clava Herdman, in Cork Harbour. Ir. Nat. J. 22(9):388–393. https://www.jstor.org/stable/25539233?seq=1.
Minchin D, Nunn J. 2014. The invasive brown alga Undaria pinnatifida (Harvey) Suringar, 1873 (Laminariales: Alariaceae), spreads northwards in Europe. BIR. 3(2):57–63.
doi:10.3391/bir.2014.3.2.01.
Moreno CE, Halffter G. 2000. Assessing the completeness of bat biodiversity inventories using species accumulation curves. Journal of Applied Ecology. 37(1):149–158. doi:10.1046/j.1365- 2664.2000.00483.x.
20
Ocean Forecast. [updated 03-Nov-20]. Seawater temperature in List (Germany) in April | Historical Data for Sea Temperature in April for List. [place unknown]: [publisher unknown]; [accessed 03- Nov-20]. https://seatemperature.net/monthly/list-schleswig-holstein-germany-sea-
temperature-in-april-731.
OpenStreetMap. [updated 16-Nov-20]. OpenStreetMap. [place unknown]: [publisher unknown];
[accessed 16-Nov-20]. https://www.openstreetmap.org/.
Osman RW, Whitlatch RB, Zajac RN. 1989. Effects of resident species on recruitment into a community: larval settlement versus post-settlement mortality in the oyster Crassostrea
virginica. Marine Ecology Progress Series. 54(1/2):61–73. http://www.jstor.org/stable/24837814.
Pereyra P, Narvarte M, Tatián M, González R. 2015. The simultaneous introduction of the tunicate Styela clava (Herdman, 1881) and the macroalga Undaria pinnatifida (Harvey) Suringar, 1873, in northern Patagonia. BIR; [accessed 08-Jan-20]. 4(3):179–184. doi:10.3391/bir.2015.4.3.04.
Pereyra PJ, La Barra P de, Gastaldi M, Saad JF, Firstater FN, Narvarte MA. 2017. When the tiny help the mighty: facilitation between two introduced species, a solitary ascidian and a macroalga in northern Patagonia, Argentina. Mar Biol; [accessed 08-Jan-20]. 164(9):191. doi:10.1007/s00227- 017-3202-1.
R Development Core Team. 2004-. The R reference manual: Base package / the R Development Core Team. Bristol: Network Theory Limited. ISBN: 0954612019.
Reise K, Buschbaum C, Büttger H, Rick J, Wegner KM. 2017b. Invasion trajectory of Pacific oysters in the northern Wadden Sea. Marine Biology. 164(4):68. eng. doi:10.1007/s00227-017-3104-2.
Reise K, Buschbaum C, Büttger H, Wegner KM. 2017a. Invading oysters and native mussels: from hostile takeover to compatible bedfellows. Ecosphere. 8(9):e01949. doi:10.1002/ecs2.1949.
Rodriguez LF. 2006. Can Invasive Species Facilitate Native Species? Evidence of How, When, and Why These Impacts Occur. Biol Invasions. 8(4):927–939. doi:10.1007/s10530-005-5103-3.
Ruffo S. 1982. The Amphipoda of Mediterranean, parte 1, Gammaridae (Acanthonomatidae to Gammaridea). Mem Inst Oceanogr Fond Albert Ier Prince Monaco. 13:1.
Sakai AK, Allendorf FW, Holt JS, Lodge DM, Molofsky J, With KA, Baughman S, Cabin RJ, Cohen JE, Ellstrand NC, et al. 2001. The Population Biology of Invasive Species. Annu. Rev. Ecol. Syst.
[Annual Review of Ecology and Systematics, 32(1), 305-332]. 32(1):305–332.
doi:10.1146/ANNUREV.ECOLSYS.32.081501.114037.
Schaffelke B, Hewitt CL. 2007. Impacts of introduced seaweeds. Botanica Marina. 50(5/6):282.
doi:10.1515/BOT.2007.044.
Schiller J, Lackschewitz D, Buschbaum C, Reise K, Pang S, Bischof K. 2018. Heading northward to Scandinavia: Undaria pinnatifida in the northern Wadden Sea. Botanica Marina. 61(4):365–371.
doi:10.1515/bot-2017-0128.
Simkanin C, Davidson IC, Dower JF, Jamieson G, Therriault TW. 2012. Anthropogenic structures and the infiltration of natural benthos by invasive ascidians. Marine Ecology. 33(4):499–511.
doi:10.1111/j.1439-0485.2012.00516.x.
Sonier R, Comeau LA, Tremblay R, Olivier F, Meziane T, Genard B. 2021. Mytilus edulis and Styela clava assimilate picophytoplankton carbon through feces and pseudofeces ingestion.
Aquaculture. 531:735868. http://www.sciencedirect.com/science/article/pii/
S0044848620305779. doi:10.1016/j.aquaculture.2020.735868.
South PM, Floerl O, Forrest BM, Thomsen MS. 2017. A review of three decades of research on the invasive kelp Undaria pinnatifida in Australasia: An assessment of its success, impacts and status as one of the world's worst invaders. Marine Environmental Research. 131:243–257. eng.
doi:10.1016/j.marenvres.2017.09.015.
Theisen BF. 1972. Shell cleaning and deposit feeding in Mytilus edulis L. (Bivalvia). Ophelia. 10(1):49–
55. doi:10.1080/00785326.1972.10430101.
21
Toh KB, Ng CSL, Wu B, Toh TC, Cheo PR, Tun K, Chou LM. 2017. Spatial variability of epibiotic assemblages on marina pontoons in Singapore. Urban Ecosyst. 20(1):183–197.
doi:10.1007/s11252-016-0589-2.
Uryupova EF. 2005. SEM mouthparts morphology of four amphipod species-dwellers of red algae beds in the White Sea. Arthropoda Selecta. Русский артроподологический журнал. 14(4):291–
296.
Uryupova EF, Spiridonov VA, Zhadan DG. 2012. Amphipods (Crustacea: Amphipoda) associated with red algae (Rhodophyta) in Kandalaksha Bay (the White Sea, Russia). J. Mar. Biol. Ass. 92(2):265–
273. https://scholar.google.com/scholar?hl=ro&as_
sdt=0%2C5&q=E.F.+Uryupova+%282005%29+SEM+mouthparts+morphology+of+four+amphipod +species--dwellers+of+red+algae+beds+in+the+White+Sea.+Arthropoda+Selecta+14%2C+291- 296.&btnG=. doi:10.1017/S0025315411001676.
van Beusekom JE, Loebl M, Martens P. 2009. Distant riverine nutrient supply and local temperature drive the long-term phytoplankton development in a temperate coastal basin. Journal of Sea Research. 61(1-2):26–33. doi:10.1016/j.seares.2008.06.005.
van Beusekom JEE, Buschbaum C, Loebl M, Martens P, Reise K. 2010. Long-Term Ecological Change in the Northern Wadden Sea. In: Müller F, Baessler C, Schubert H, Klotz S, editors. Long-Term Ecological Research: Between Theory and Application. Dordrecht: Springer Netherlands. p. 145–
153.
Wahl M, Kröger K, Lenz M. 1998. Non-toxic protection against epibiosis. Biofouling. 12(1-3):205–226.
doi:10.1080/08927019809378355.
Willott SJ. 2001. Species accumulation curves and the measure of sampling effort. Journal of Applied Ecology. 38(2):484–486. doi:10.1046/j.1365-2664.2001.00589.x.
Wolff WJ, Reise K. 2011. Oyster Imports as a Vector for the Introduction of Alien Species into Northern and Western European Coastal Waters. Dordrecht, London: Springer. 1 volume ;. p.
193–205 (Invasive Aquatic Species of Europe. Distribution, Impacts and Management). ISBN:
9789048161119. doi:10.1007/978-94-015-9956-6_21.
22 Appendix
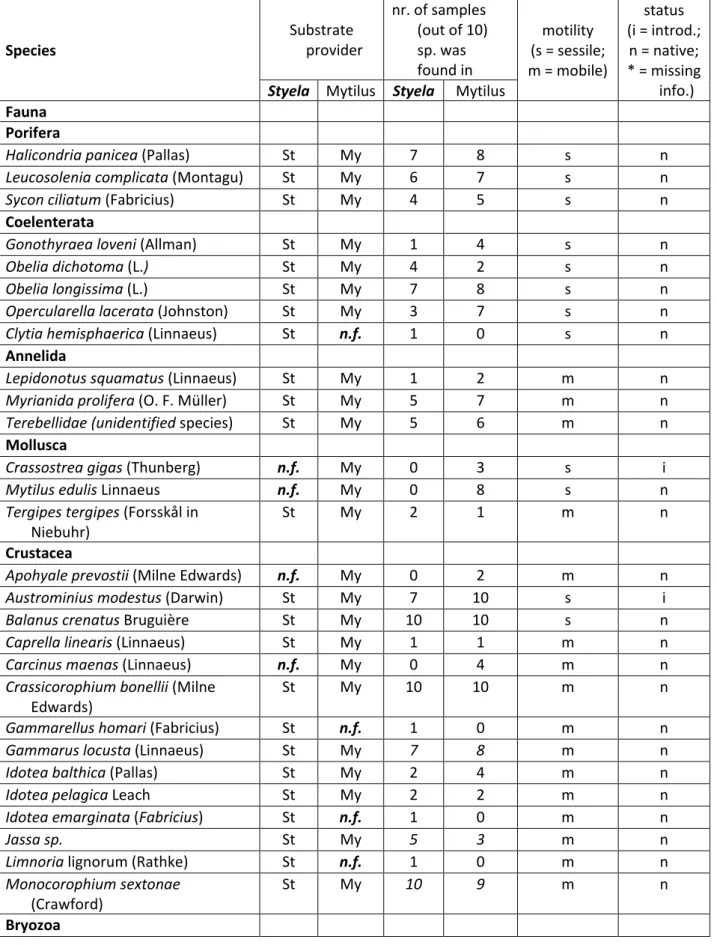
Table 5. List of species identified on the two substrate providers, Mytilus (My) and Styela (St), the number of samples the species where identified in, locomotive properties (sessile or mobile) and species status in the Sylt area (i - introduced, n – native or * - not enough information to classify) according to (Lackschewitz et al. 2015; Armonies et al. 2018).
Species Substrate
provider
nr. of samples (out of 10) sp. was found in
motility (s = sessile;
m = mobile)
status (i = introd.;
n = native;
* = missing info.) Styela Mytilus Styela Mytilus
Fauna Porifera
Halicondriapanicea (Pallas) St My 7 8 s n
Leucosolenia complicata (Montagu) St My 6 7 s n
Sycon ciliatum (Fabricius) St My 4 5 s n
Coelenterata
Gonothyraea loveni (Allman) St My 1 4 s n
Obelia dichotoma (L.) St My 4 2 s n
Obelia longissima (L.) St My 7 8 s n
Opercularella lacerata (Johnston) St My 3 7 s n
Clytia hemisphaerica (Linnaeus) St n.f. 1 0 s n
Annelida
Lepidonotus squamatus (Linnaeus) St My 1 2 m n
Myrianida prolifera (O. F. Müller) St My 5 7 m n
Terebellidae (unidentified species) St My 5 6 m n
Mollusca
Crassostreagigas (Thunberg) n.f. My 0 3 s i
Mytilus edulis Linnaeus n.f. My 0 8 s n
Tergipes tergipes (Forsskål in
Niebuhr) St My 2 1 m n
Crustacea
Apohyaleprevostii (Milne Edwards) n.f. My 0 2 m n
Austrominius modestus (Darwin) St My 7 10 s i
Balanus crenatus Bruguière St My 10 10 s n
Caprella linearis (Linnaeus) St My 1 1 m n
Carcinus maenas (Linnaeus) n.f. My 0 4 m n
Crassicorophium bonellii (Milne
Edwards) St My 10 10 m n
Gammarellus homari (Fabricius) St n.f. 1 0 m n
Gammarus locusta (Linnaeus) St My 7 8 m n
Idotea balthica (Pallas) St My 2 4 m n
Idotea pelagica Leach St My 2 2 m n
Idotea emarginata (Fabricius) St n.f. 1 0 m n
Jassa sp. St My 5 3 m n
Limnoria lignorum (Rathke) St n.f. 1 0 m n
Monocorophium sextonae
(Crawford) St My 10 9 m n
Bryozoa
23
Species Substrate
provider
nr. of samples (out of 10) sp. was found in
motility (s = sessile;
m = mobile)
status (i = introd.;
n = native;
* = missing info.) Styela Mytilus Styela Mytilus
Alcyonidiummytili Dalyell n.f. My 0 1 s n
Conopeum reticulum (Linnaeus) n.f. My 0 5 s n
Electra pilosa (Linnaeus) St My 8 3 s n
Tricellaria inopinata d’Hondt and
Occhipinti Ambrogi St My 10 8 s i
Tunicata
Botrylloidesviolaceus Oka St My 4 4 s i
Botryllus schlosseri (Pallas) St My 10 9 s i
Molgula sp.8 St My 7 7 s *
Styela clava Herdman n.f. My 0 1 s i
Others
Cluniomarinus Haliday (Insecta) n.f. My 0 2 m n
Pseudostomum quadrioculatum
(Leuckart) (Platyhelminthes) St My 1 1 m n
Unidentified annelid St n.f. 1 0 m *
Unidentified juvenile bivalve St My 5 2 s *
Unidentified juvenile snail St n.f. 1 0 m *
Unidentified green worm St My 1 3 m *
Unidentified anemone n.f. My 0 1 s *
Unidentified tunicate St n.f. 1 0 s *
Flora Chlorophyta
Bryopsishypnoides Lamour. n.f. My 0 4 s n
Derbesia marina (Lyngb.) St My 3 7 s n
Enteromorpha sp. St My 2 7 s n
Ulva sp. St My 8 8 s n
Phaeophyta
Litosiphonfiliformis (Reinke) Batt. St My 6 2 s n
Dictyosiphon foeniculaceus (Huds.)
Grey. St My 2 1 s n
Petalonia fascia (O.F.Müller) Kuntze n.f. My 0 3 s n
Sargassum muticum (Yendo)
Fensholt St My 2 3 s i
Scytosiphon lomentaria (Lyngbye)
Link St My 1 2 s n
Desmarestia viridis (O. F. Miill.)
Lamour. St My 1 4 s n
Rhodophyta
Antithamnion sp. St n.f. 1 0 s n
8M. manhattensis is non-native and very hard to distinguish from the native M. socialis (Lackschewitz et al.
2015).
24
Species Substrate
provider
nr. of samples (out of 10) sp. was found in
motility (s = sessile;
m = mobile)
status (i = introd.;
n = native;
* = missing info.) Styela Mytilus Styela Mytilus
Brongniartella byssoides (Good. et
Woodw.) Schmitz St My 6 6 s n
Ceramium rubrum agg. St My 8 9 s n
Cystoclonium purpureum (Huds.)
Batt. St My 1 4 s n
Erythrotrichia carnea (Dillw.) J. Ag. St n.f. 4 0 s n
Vertebrata fucoides (Hudson)
Kuntze St My 4 3 s n
Polysiphonia sp. 9 St My 9 8 s *
9 Polysiphonia violacea from Helgoland (Kornmann and Sahling 1977) is Neosiphonia harveyi, identified on Sylt also (Lackschewitz et al. (2015) I was unable to differentiate between P. elongate (native) and P. violacea, the two species being very similar.