Bachelor thesis
This thesis is submitted for the degree of Bachelor of Science
Implications of extreme liquid
precipitation events on permafrost degradation at Spitsbergen
Submitted by:
Lisa Wenzel Supervisors:
Prof. Dr. Julia Boike Dr. Sebastian Schubert
Submitted at the Geography Department of Humboldt-Universität zu Berlin on:
October 19, 2020
Abstract
The signals of the Arctic Amplification are manifold. Different climate developments like the increase in moisture and air temperature or the decrease of the snow cover can be observed. The Svalbard archipelago is one of the warmest areas in the Arctic. It lies at the end of the North Atlantic cyclone track which is the main source of energy for the Arctic. A warming-induced intensified hydrological cycle increases the frequency of cyclones in Svalbard and thereby the occurrence of extreme rain events, in particular in winter. Only a few publications investigated the changes of precipitation in accordance to the existing permafrost, which characterizes 40% of the archipelago. This study de- scribes the development of (extreme) liquid precipitation in Spitsbergen and investigates the impact of extreme rain events in relation to the degradation of permafrost that al- ready occurs due to the amplified warming. Therefore, meteorological data as well as topsoil temperature data of Ny-Ålesund (Spitsbergen) were analyzed for the period from 1999 to 2020. It confirms an actual increase of (extreme) liquid precipitation in general and in winter season. Further, an examination of distinct extreme events revealed a re- markable effect of extreme rainfall on topsoil temperature on a micro-level and indicates complex interactions of several environmental factors regarding the heat fluxes between the atmosphere and the ground. In particular rain-on-snow events have a noticeable im- pact on topsoil temperature and thereby influence the thermal state of the permafrost substantially.
Contents
1 Introduction 1
1.1 Objectives . . . 3
1.2 Study site . . . 4
2 Theoretical background 6 2.1 Permafrost thermal state . . . 6
2.2 Precipitation development at Spitsbergen . . . 8
2.3 Rain-on-snow events and their implications for permafrost . . . 9
3 Methods 11 3.1 Data . . . 11
3.2 Quality assurance . . . 12
3.3 Data analysis . . . 13
4 Results 16 4.1 General liquid precipitation development . . . 16
4.2 Extreme liquid precipitation development . . . 18
4.3 Topsoil temperature development . . . 20
4.4 Effects of rain-on-snow on topsoil temperature . . . 21
4.4.1 November 2016 . . . 21
4.4.2 January 2018 and the complete snow season . . . 22
4.4.3 January 2015 . . . 25
4.5 Correlations and linear regression model . . . 26
5 Discussion and Conclusion 29 5.1 Discussion . . . 29
5.2 Conclusion . . . 33
Acknowledgements 34
Contents
Bibliography 35
List of Figures
1.1 View to Ny-Ålesund and Bayelva . . . 5 2.1 Segments and temperature profile of permafrost . . . 7 4.1 Annual averages for liquid precipitation (above; annual totals), air tem-
perature (middle; annual means) and topsoil temperature (below; annual mean) with linear trends from Aug 1999 to Sep 2020 . . . 17 4.2 Intra-annual course of monthly average liquid precipitation from Aug 1999
to Sep 2020 . . . 18 4.3 Annual numbers of extreme rain events above the 4.5 mm threshold (global
95th percentile of the whole record) from Aug 1999 to Sep 2020) . . . 19 4.4 Annual numbers of extreme rain events above the 10 mm threshold from
Aug 1999 to Sep 2020 . . . 20 4.5 Intra-annual course of daily topsoil and air temperature from Aug 1999
to Sep 2020 . . . 21 4.6 Extreme rain event on 07.11.2016 (Top 1) with 70.3 mm and associated
topsoil and air temperatures, no snow cover occurred . . . 22 4.7 Extreme rain event on 13.01.2018 (Top 2) with 59.2 mm and associated
topsoil and air temperatures, 9 cm snow occurred on this day . . . 23 4.8 Snow season of 2017/2018 with daily liquid precipitation, air temperature,
original topsoil temperature and predicted topsoil temperature (by air temperature), asterisks mark greatest differences between predicted and actual values of topsoil temperature . . . 24 4.9 Snow season of 2017/2018 with daily liquid precipitation and the residuals
of the predicted topsoil temperature (by air temperature), asterisks mark highest ranked residuals . . . 25 4.10 Extreme rain event on 23.01.2015 (Top 7) with 38.2 mm and associated
topsoil and air temperature, snow cover occurred . . . 26
List of Tables
1.1 Annual and seasonal mean air temperatures (in ◦C) and average solid and liquid precipitation totals (in mm) during 1961-1990 and 1981-2010 for Ny-Ålesund by Førland et al. (2011) . . . 4 3.1 Percentage of missing daily data for liquid precipitation, topsoil temper-
ature and air temperature between Aug 1999 - Sep 2020 . . . 12 3.2 Pearson correlation coefficients at different thresholds for the comparison
of liquid precipitation data of AWI and pluvio data (liquid and solid precipitation) of the University of Cologne for the period from Aug 2017 to Feb 2020 . . . 13 4.1 Top ten of daily extremes (≥10 mm) of observed liquid precipitation . . . 19 4.2 Results of linear regression models. (1) for topsoil temperature by liquid
precipitation, (2) for topsoil temperature by the dummy variable for ex- treme events, (3) for topsoil temperature with extreme liquid precipitation and air temperature . . . 27
Chapter 1
Introduction
The extent of the anthropogenic induced climate change is dependent on feedback from terrestrial and oceanic systems. Minor changes within these systems can accelerate climate change which results in even more severe impacts for natural ecosystems and human settlements. These feedback mechanisms contribute to the Arctic warming two times faster than to the rest of the world. This process is also known as the Arctic Amplification (AMAP, 2019; Yang and Kane, 2021). The signals of this amplification are various, e.g. the increase in moisture and air temperature, the loss of sea ice, the decrease of snow cover, a changed liquid to solid precipitation ratio with a trend towards liquid precipitation and the surge of longwave radiation due to an increase in cloud cover, atmospheric moisture and greenhouse gas concentration (Yang and Kane, 2021).
Different climate developments can be observed in the circumpolar Arctic. The Atlantic sector and the region around the Svalbard archipelago are the warmest. For example, Longyearbyen made the headlines at the end of July 2020 with a record temperature of 21.7°C (Adomaitis, 2020). These climate changes can be read from long-term measure- ments taken on site. In Ny-Ålesund, the oldest time series of temperature measurements date back to 1934, at Svalbard Airport, they can even be traced back to 1898. This de- velopment is particularly visible during the winter months when temperatures have risen by 2-3°C per decade at Svalbard Airport over the last 30 years (Førland et al., 2011).
The warming-induced changes of climate variables have a high impact on the water and energy balance as well as regional ecosystems within the Arctic, e.g. the degradation of permafrost. Nearly 25 % of the land mass in the northern hemisphere consists of this kind of soil. In the Quaternary Period, huge amounts of organic matter were accumu- lated by cryopedogenetic processes into permafrost influenced soils when low average
Chapter 1 Introduction
temperatures in terrestrial permafrost areas slowed down microbial decomposition of organic matter over a span of thousands of year. Global warming accelerates microbial breakdown of organic carbon in permafrost soils which leads to the release of carbon dioxide and methane into the atmosphere (Zubrzycki et al., 2011; Schuur et al., 2015).
Biskaborn et al. (2019) showed that, during the decade 2007 to 2016, the ground temper- ature of permafrost near the depth of the zero annual amplitude (ZAA) in continuous permafrost zones, i.e. the depth at which the annual soil temperature variations are below 0.1◦C, increased by 0.39±0.15◦C. Lenton et al. (2008) define permafrost areas as a tipping element of the global climate system, so if permafrost thawing reaches a critical threshold this transition can qualitatively change the climate system to a new stage. Therefore, permafrost is a key indicator of climate change (Romanovsky et al., 2010).
The thermal dynamics of the permafrost are determined by the ground-atmosphere energy exchange as well as the internal energy transfer in association with phase changes of water (Loranty et al., 2018). One of the main atmospheric parameters that influences the thermal regime and drives hydrological processes is precipitation. In solid form, snow, it insulates the permafrost and changes the surface albedo, both influencing the persistence of the permafrost substantially (Loranty et al., 2018). In its liquid form, rain, it affects the heat transport of the permafrost, changes its energy budget and drives sediment transport as well as thermo-erosion (Vincent et al., 2017). The recently published Special Report on the Ocean an Cryosphere in an Changing Climate by the Intergovernmental Panel on Climate Change (IPCC) indicates that the thickness of permafrost’s active layer has increased by changes in precipitation that affect ground thermal regime (IPCC, 2019). As stated above, precipitation rates increase much faster in the Arctic than on global scale (Bintanja and Andry, 2017). According to Førland et al. (2011) the total annual precipitation in the Arctic, especially in autumn and winter, has increased by 14 % over the past century. Climate simulations indicate further that the ratio of liquid to solid precipitation in the Arctic will change prospectively with a trend to more liquid precipitation. In addition, there is an increase in extreme rain (Hansen et al., 2014). In winter, this liquid precipitation occurs usually as a rain-on- snow (ROS) event. Depending on its properties, snow can only store a certain amount of rain. If the rain event is extreme, it can percolate through the snow and thus affects the soil temperature due to latent heat release (Putkonen and Roe, 2003; Westermann et al., 2011). Measurement results from 1998 - 2017 show that the trend of warming is accelerating. Over a period of 20 years, temperatures in the active layer near the surface increased by 0.18 (±0.07)°C per year and the thickness of the thaw layer has
1.1 Objectives
approximately doubled (Boike et al., 2018). The reasons of warming can be attributed to winter warming on Svalbard (Dahlke and Maturilli, 2017).
1.1 Objectives
The aim of this study is to examine whether winter rainfall warms the permafrost at Svalbard. Only a few publications investigate a change of (extreme) liquid precipitation in particular as well as its implications to the active layer’s temperature. Therefore, meteorological data and soil temperature data of Spitsbergen, the Norwegian archipelago in the Arctic ocean were examined with a special focus on single extreme events that occurred during winter. I raise the question whether extreme rain events increased in intensity and occurred more frequently in the second decade between 1999 -2020, specifically during winter. Moreover, I investigate a potentially strong and positive relationship between (extreme) rainfall and topsoil temperature. By that, the following research questions were addressed in this work:
• Had (extreme) rain events increased between 1999 and 2020?
• Had (extreme) winter rain events increased between 1999 and 2020?
• Did soil temperatures increase when (extreme) winter rainfall occurs?
The study proceeds as follows: The remainder of Chapter 1 describes the study setting, Chapter 2 provides the theoretical foundation of permafrost, its thermal state and dy- namics along with a long-run perspective on (extreme) liquid precipitation developments in Spitsbergen. Chapter 3 describes the data and methodologies used for the analysis in this study. Chapter 4 presents the key statistics of broad trends as well as individual events that highlight the relationships posed earlier. Chapter 5 concludes.
1.2 Study site
1.2 Study site
The 63 000 km2large Svalbard archipelago is situated in the Arctic ocean between Green- land (East) and the Barents Sea (West). It is administered by Norway. In general, Svalbard is characterized by a High Arctic climate with strong seasonal patterns as well as small variability in temperature on a daily basis but large variability on an annual basis indicating a strong seasonality (Hanssen-Bauer et al., 2019; Førland et al., 2011).
Svalbard is regularly of special interest for climate research since its climate sensitivity is very high (Humlum et al., 2003). This is due to the location of the island which is
"directly in the main transport pathway for air masses into the Arctic Basin [...] near the confluence of air masses and ocean currents with very different temperature charac- teristics, and [...] rapid variations in the sea ice extent, coupled with both atmospheric and oceanic circulation" (Humlum et al., 2003). Up to 40 % of the archipelagos land surface is characterized by permafrost, the remaining 60 % are formed and influenced by glaciers. By that, it is the largest European permafrost area (without Russia) (Humlum et al., 2003).
1961-1990 1981-2010
Annual Winter Spring Summer Autumn Annual Winter Spring Summer Autumn
Temperature -6.3 -13.8 -9.8 3.4 -5.3 -5.2 -12 -8.5 3.8 -4.4
Precipitation 385 99 86 84 116 427 132 78 82 136
Table 1.1: Annual and seasonal mean air temperatures (in ◦C) and average solid and liquid precipitation totals (in mm) during 1961-1990 and 1981-2010 for Ny-Ålesund by Førland et al. (2011)
Spitsbergen is the largest island of the Svalbard archipelago. The Bayleva research site is located at 78.551°N, 11.571°E near the Western coast close to the village of Ny- Ålesund. The Alfred Wegener Institute for Polar and Marine research (AWI) is using this site since 1998 for their permafrost observations. It is characterized by continuous permafrost of about 100 m depth (Liestøl, 1980). The mean winter temperature of Ny- Ålesund from 1981 to 2010 was−12◦C and the mean summer temperature 3.8◦C. The average annual precipitation total from 1981 to 2010 was 427 mm and consisted primarily of snow (September - May) (Table 1.1). Occasionally, strong winds occur. The Bayleva research site is situated on continuous permafrost ground on the 25 m high Leirhaugen hill between two mountains (which can shade the site temporarily, Figure 1.1) (Boike et al., 2018). The Bayleva site is part of the Bayleva river catchment which flows 1 km aside from it. The soil consists of a heterogeneous mixture of sediments (loam, clay,
1.2 Study site
Figure 1.1: View to Ny-Ålesund with the Bayelva study site in the middle of the im- age (left) and instruments at the Bayleva site (right) (©Bill Cable, Alfred-Wegener- Institut)
sand, larger stones) and is comprised of glacial and periglacial structures. The area is covered to 50-60 % by vegetation like low vascular plants, grasses, moss and lichen, the rest is bare soil (Boike et al., 2018). The research site has a meteorological station above ground and a soil station below ground. Since the year 1998 meteorological data such as air temperature (2 m above ground), relative humidity, wind, radiation, liquid precipitation, snow depth and ground air temperatures (in winter snow temperatures) as well as soil data like soil temperatures, soil liquid volumetric water content and soil electrical conductivity are measured. The liquid precipitation is observed in an unheated tipping bucket rain gauge every hour (totals in mm/hour), since 2010 at a half-hour frequency. The soil temperatures are measured with a CS 107 sensor in eight different depth levels of the active layer (1 cm, 11 cm, 21 cm, 37 cm, 55 cm, 71 cm, 89 cm, 141 cm) every 60 seconds and submitted every hour. The precipitation observations have a field accuracy of 2 %, the soil temperature of 0.1◦C (Boike et al., 2018).
Chapter 2
Theoretical background
2.1 Permafrost thermal state
Permafrost typically characterizes polar regions without glaciers, usually known as peri- glacial regions or environments. It is defined as soil or ground with temperatures below 0◦C for two or more consecutive years and further classified by its distribution. In regions with continuous permafrost (mainly in the Arctic), the permafrost is seamlessly (90-100 %) present except under some minor zones like lakes or rivers. Discontinuous permafrost zones are defined by permafrost presence of 50-90 %, sporadic by 10-50
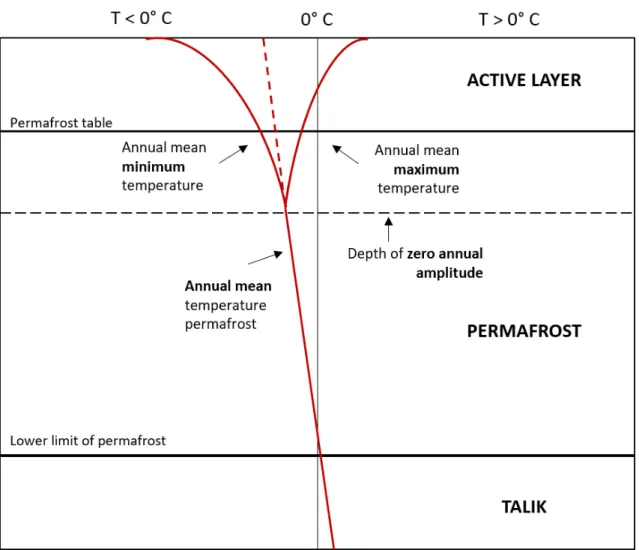
%, isolated by 0-10 %. These zones are not only located in high latitudes but also in high altitudes like alpine regions or plateaus. The common definition of permafrost cited above is explicitly linked to the air temperature which shows that the climate is the most important factor of the permafrost formation beside other factors like topography, water bodies, vegetation, snow cover, wind, geothermal heat flow or the lithology (French, 2007; Humlum et al., 2003). Beside the temperature, soil moisture and the presence of water/ice are highly relevant regarding the thermal state of permafrost. Figure 2.1 illustrates the structure of permafrost influenced soil and its temperature profile. The uppermost part of the permafrost is the active layer which annually thaws in spring and freezes back in autumn. Thus, it is not defined by temperature but by its states (frozen, partially-frozen or unfrozen). The active layer’s thickness varies within the arctic regions from 0.15–2 m or more (Yang and Kane, 2021). Below the active layer the permafrost table marks the uppermost part of the permanent frozen soil whose depth depends on the mean annual air temperature (MAAT). Beneath the lower limit of the permafrost a zone of non-frozen soil, so-called talik can occur (French, 2007).
2.1 Permafrost thermal state
Figure 2.1: Segments and temperature profile of permafrost. Figure adapted from French (2007) and Zepp (2014)
The thermal balance of the permafrost ground is characterized by the difference of the net radiation, which is absorbed by the bare ground, the snow or different plants and the energy loss of latent, sensible and ground heat fluxes (Loranty et al., 2018). Further, vegetation and especially the snow pack and its properties strongly influence the thermal regime of permafrost. Depending on the time of occurrence, duration and accumulation snow can cool or warm the permafrost by insulating the soil and changing the albedo and thereby the impact of solar radiation. Vegetation can cool the surface by shading it from solar radiation. (French, 2007; Roth and Boike, 2001; Yang and Kane, 2021;
Vincent et al., 2017). The thermal regime of the active layer evolves according to four stages within a year. In winter the entire soil is completely frozen and usually isolated by
2.2 Precipitation development at Spitsbergen
a snow cover. In spring, when air temperature rises and the snow melts, water gradually infiltrates the frozen soil, followed by the thawing of the active layer (downward moving) during the summer and a freeze back period in fall (Roth and Boike, 2001). Generally, ground temperatures are essentially determined by the type of heat exchange between the ground surface, the atmosphere, and the subsurface as well as the current stage of the active layer. The most dominant form of heat exchange between permafrost soil and upper layers or within the permafrost is conduction. For frozen soils this is of special relevance since the conductivity of ice is four times higher than the conductivity of water. So when the active layer is frozen, heat can penetrate the permafrost as a whole more rapidly. In autumn, when the active layer is freezing back, the latent heat which is released causes the zero curtain effect. Despite freezing and decreasing air temperatures, the ground temperature remains constant for a certain time around 0◦C (Outcalt et al., 1990). Summarizing, the thermal conductivity influences the temperature gradient of the permafrost and the thickness of the active layer primarily. When the active layer is in an unfrozen state (primarily in summer), also convective heat exchange plays a role, e.g. by infiltration of rainfall precipitation or due to pore water convection.
2.2 Precipitation development at Spitsbergen
The large currents of the North Atlantic are the main source of energy for the Arctic and have major influence on the cyclone activity in this region. The Svalbard archipelago lies at the northern end of the North Atlantic cyclone track. Its proximity to the margin of sea ice supports advection which is why cyclones occur frequently (Serreze et al., 2015). Within Svalbard the precipitation variability is very high. From 1971–2017 the average rate of change for decadal precipitation in Barentsburg was 0.8%, in Ny- Ålesund 7.1% (Hanssen-Bauer et al., 2019). Snow is the typical form of precipitation at Svalbard prevailing up to 8 month. From 1958–2017 the duration of the snow season for Svalbard decreased by 20 days (Hanssen-Bauer et al., 2019) Due to global warming heat and moisture transport towards Spitsbergen have enhanced, which results in larger and stronger cyclone activities, a decrease of solid precipitation (snow) and an increase in liquid precipitation, especially in winter (Akperov et al., 2020; Romanovsky et al., 2010; Hanssen-Bauer et al., 2019). Zahn et al. (2018) observed a three times higher frequency for deep cyclones in winter than in summer for the period from 1981–2010. Due to reduced sea-ice (and consequently enhanced surface evaporation) this precipitation increase could dominate during autumn and winter. The region around Svalbard is quite
2.3 Rain-on-snow events and their implications for permafrost
sensitive to the seasonal cycle of the ice cover and the surface temperature of the sea (Christensen et al., 2020; Førland et al., 2011). In addition, the climate change induced amplification of the hydrological cycle can foster climate extremes like severe rainfall. For the Arctic the magnitude of such precipitation extremes might be much smaller than in tropical regions, but within the Arctic, Spitsbergen is closer to that moisture sources than other Arctic regions (Serreze et al., 2015). Førland et al. (2011) applied different climate models to the Svalbard region and indicating an increase in the frequency of rainfall events exceeding the 95-percentile of daily rainfall at the end of the century. However, it has to be mentioned that future projections on the climate at Spitsbergen are linked to several uncertainties, since the projections resulted from downscaled climate scenarios where the sea ice development is not considered sufficiently. The sea ice development has not only local implications on the future Arctic climate but also large-scale implications on atmospheric circulation which affects precipitation (and is affected by precipitation).
If atmospheric circulation does not change substantially the intensity of precipitation events will increase due to the raise of moisture in the atmosphere. On the other hand, if global warming leads to more stable atmospheric conditions, this could also weaken the atmospheric circulation and thus reduce intensive precipitation events (Pendergrass, 2018; Førland et al., 2011).
2.3 Rain-on-snow events and their implications for permafrost
Liquid precipitation that occurs in winter at Spitsbergen and falls on snow are often described in literature as rain-on-snow (ROS) events (Hansen et al., 2014). Heavy ROS events can have a significant impact on the ground surface and soil temperatures (West- ermann et al., 2011). Roth and Boike (2001) investigated two winter seasons (2005/2006, 2006/2007) with heavy rainfall (≥ 10 mm/day) at Spitsbergen and showed that these events can alter the ground surface temperature below the snow for several weeks, while small ROS events are negligible. Due to the heavy rain, water percolates through the snow, it refreezes and latent heat is released. In addition, the latent heat is transferred by advection to the soil and changes permafrost conditions by increasing the soil tem- perature (Hansen et al., 2014; Westermann et al., 2011; Putkonen and Roe, 2003). A long-term extreme ROS event in Ny-Ålesund was observed in winter 2011/2012 with a maximum of 98 mm rain on a single day (30 January 2012) which accounts for 25 % of
2.3 Rain-on-snow events and their implications for permafrost
the mean annual precipitation of Ny-Ålesund. During that very wet winter 2011/2012, ground surface temperature close to Longyearbyen on Spitsbergen have risen to more than 7◦C, substantially above the 10-year average of (3.6◦C) (2000-2011). Two weeks after the extreme event on 30 January 2012 ground soil temperature stayed near 0◦C for several weeks although air temperatures decreased to −10◦C (Hansen et al., 2014).
A model simulation by Putkonen and Roe (2003) revealed that a single 50 mm ROS event can raise the average winter soil surface temperature to the same extent like a 7◦C increase of the winter surface air temperature. Summarizing, ROS events, especially ex- tremes can accelerate the global warming induced permafrost degradation additionally by destabilizing permafrost systems and increasing active layer thickness. This desta- bilization can cause permafrost erosion and the mobilization of transportable materials which affects different ecosystems and fosters the release of greenhouse gases by enabling the decomposition of organic matter (Westermann et al., 2011; Christensen et al., 2020).
Furthermore, ROS events can cause avalanches by changing snow-pack properties and foster the formation of thick ice-layers on the ground which have severe implications for fauna and flora like a restricted food availability for herbivores as well as for the infrastructures of local settlements (Hansen et al., 2014).
Chapter 3
Methods
3.1 Data
Soil temperature from different stations at the Bayleva site is available since 1998. As there are no records available of equal depth of soil temperature for the complete period of 20 years from one station, data from two nearby stations with slightly different soil depths were combined for this study. The time series of soil temperature in 10 cm depth (topsoil temperature) used in this work consists of Level 2 data from August 1999 to May 2020 and was augmented with Level 1 data until September 2020. The term Level 2 indicates that the data was modified by combining them with further data series from different sensors, Level 1 indicates that the data was quality flagged with quality flags such as good quality, maintenance work or physical plausibility (Boike et al., 2018).
Level 1 and Level 2 data have a resolution of one hour.
For liquid precipitation, air temperature and snow depth the time series of Level 1 data from August 1999 to September 2020 were used. They are only quality flagged and not changed or combined with different data. Until mid-2010 the resolution of both variables is one hour, since then 30 minutes.
3.2 Quality assurance
3.2 Quality assurance
In order to use high-quality data for the analysis, the data was quality checked. First, the data was filtered by quality flag so that only high quality (flag 0) data were used.
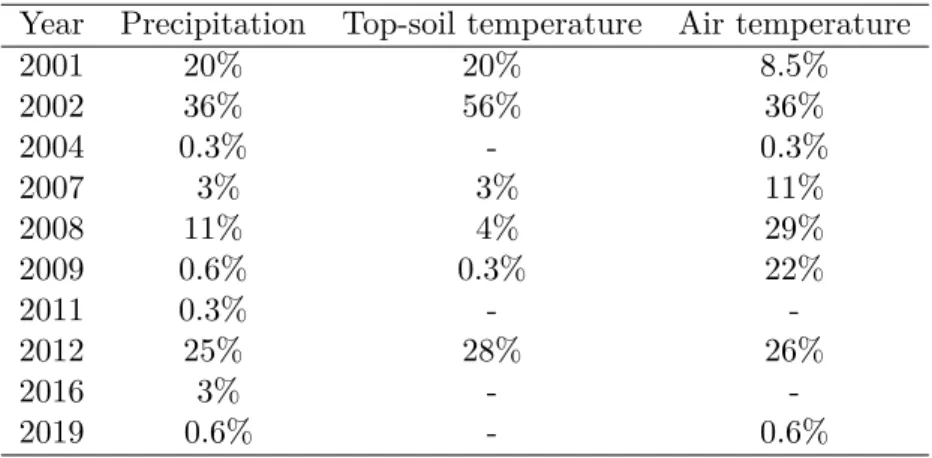
After resampling the hourly values to a daily resolution, the times series exhibited data gaps. For air temperature 6.4 % of all recorded days were missing, for liquid precipitation 5 % and for topsoil temperature 5.4 %. For snow depth 28% of the Level 1 data were missing, most notably for 2002, 2013 -2015 and 2019. The daily time series consists of 7,732 observations. The annual data gaps for air temperature, liquid precipitation and topsoil temperature on daily basis are depicted in Table 3.1.
Year Precipitation Top-soil temperature Air temperature
2001 20% 20% 8.5%
2002 36% 56% 36%
2004 0.3% - 0.3%
2007 3% 3% 11%
2008 11% 4% 29%
2009 0.6% 0.3% 22%
2011 0.3% - -
2012 25% 28% 26%
2016 3% - -
2019 0.6% - 0.6%
Table 3.1: Percentage of missing daily data for liquid precipitation, topsoil temperature and air temperature between Aug 1999 - Sep 2020
Several approaches for interpolating the missing data were considered. Since precipita- tion has a very high regional variability a reasonable interpolation for consecutive gaps of several days or weeks is very complex. Comparable precipitation data of the same period from a nearby station in Ny-Ålesund exist but the data quality is inadequate since the process of data cleansing and adjusting has not been done at the time of writing.
Therefore, no interpolation was applied to the precipitation data. The interpolation of soil temperature data is just as complex due to the different states of the active layer within a year. For missing values of several weeks a simple linear interpolation cannot appropriately capture the cyclicality of the permafrost thaw-freeze-cycles. Different sta- tistical approaches for interpolating the soil temperature were considered but eventually not used due to their complexity and insufficient reliability. For the event-based analysis in this work only recorded extreme events were considered.
3.3 Data analysis
I assessed the quality of the liquid precipitation data from August 2017 to February 2020 with comparative data from Ny-Ålesund that were provided by the University of Cologne.
The provided data includes both solid and liquid precipitation, therefore the data has been filtered by an air temperature threshold. Liu et al. (2018) determined threshold temperatures for separating rainfall and snowfall in Northern China which ranges from
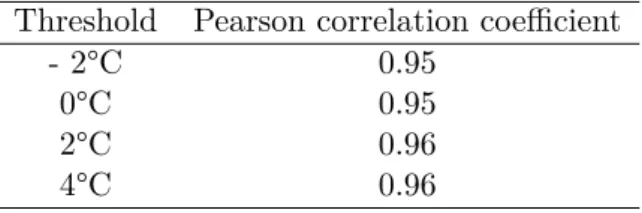
−1.2–6.3◦C with a mean of 2.8◦C. Based on that four different thresholds were applied in order to separate liquid precipitation values from solid precipitation values. After filtering the Cologne measurements by these different thresholds the Pearson correlation coefficients of both precipitation data sets were calculated. For all four thresholds the coefficients are high, indicating almost perfect positive comovement between the data sources (Table 3.2). Therefore, the original liquid precipitation data (of AWI) seems to be plausible.
Threshold Pearson correlation coefficient
- 2°C 0.95
0°C 0.95
2°C 0.96
4°C 0.96
Table 3.2: Pearson correlation coefficients at different thresholds for the comparison of liquid precipitation data of AWI and pluvio data (liquid and solid precipitation) of the University of Cologne for the period from Aug 2017 to Feb 2020
3.3 Data analysis
The daily data (00:00–23:00) were resampled to seasonal and annual resolutions in order to display seasonal and inter-annual differences and typical regimes of all three variables.
Liquid precipitation resampling was aggregated by sum totals (monthly, seasonally, an- nually), air and soil temperature by their means. For years with data gaps≥10% annual means or totals are not presented due to possible seasonal biases. Further, decadal trends only were presented for 2000–2019 since 1999 and 2020 are only available partly. For the seasonal resampling the commonly known season definition by the World Meteorological Organisation (WMO) was used, despite the fact that Artic seasons might differ from these. The winter season is much longer due to the proximity to the north pole and the lack of intense solar radiation. However, I use the WMO season definition in order to ensure comparability to different studies which also use this season definition, e.g.
3.3 Data analysis
Hanssen-Bauer et al. (2019). For the event-based study of several extreme rain events on topsoil temperature, snow season is used, since ROS-events can also occur in spring and autumn where snow can be present, too.
For the definition of extreme events daily data points were used. Zhang et al. (2011) provides indices for monitoring changes in precipitation extremes which are based on the daily resolution of precipitation data and in accordance to the European Climate Assessment indices. The following indices which both characterize heavy precipitation events, have been selected in order to determine extreme liquid precipitation events in this work:
• R 10: Number of heavy precipitation days (annual count when precipitation ≥ 10 mm)
• R 95p: Very wet days (annual total precipitation in mm from days ≥global 95th percentile)
Based on the above defined thresholds for liquid precipitation extremes in this work, the number of extreme events for both indices were calculated for every year. Further, the Top 10 extreme events on a daily basis have been determined and the three top events were investigated in detail on hourly and daily basis to recognize the behavior of the soil temperature after an extreme liquid precipitation event and a possible lag of infiltration and latent heat release. One snow season (2017/2018) with an extreme event was chosen and the time series of the three winter months of air temperature, topsoil temperature and liquid precipitation were visualized in order to show the general variability and a possible anomaly caused by a extreme rain event. The snow cover was also considered for this investigation, but not plotted. An additional line has been added to that time series with a linearly modeled soil temperature based on air temperature to display the possible anomaly which could not be explained by air temperature. Furthermore, the Pearson correlation coefficients between liquid precipitation and topsoil temperature on a daily basis for the whole record as well as for the snow season 2017/2018 with different soil temperature lags (0 -7 days) were calculated in order to identify the delay until the topsoil temperature responds to liquid precipitation.
The Pearson correlation coefficients for topsoil temperature and liquid precipitation as well as for topsoil temperature and air temperature were calculated on daily data. Since
3.3 Data analysis
this work aims to test the hypothesis that there is a statistical association between topsoil temperature and liquid precipitation, a simple linear regression model (using the OLSE
= ordinary least squares estimator) of the form yt=β0+β1xt+t
where yt is the topsoil temperature, β0 and β1 are the regression coefficients, xt is an explanatory variable related to liquid precipitation andt the error term was applied to daily data. In a first specificationxtcorresponds to the daily liquid precipitation amount.
In a second specification, xt corresponds to an indicator variable (dummy) that takes on the value of 1 if on day tthe recorded liquid precipitation amount exceeded 10 mm, and 0 otherwise. A third specification augments model 2 by air temperature, accounting for the joined interaction between liquid precipitation and air temperature on topsoil temperature.
Chapter 4
Results
4.1 General liquid precipitation development
From 2000–2019 the average annual liquid precipitation was 289 mm with an annual total minimum in 2004 of 141 mm and an annual total maximum of 536 mm in 2016. I found an increase of the annual average total between the first decade (2000–2009) and the second decade (2010–2019) of approximately 120 mm. The years with the highest amount of liquid precipitation were 2015, 2016 and 2018 with 426 mm, 536 mm and 519 mm, respectively. The overall increase of liquid precipitation is in accordance with the development of the associated air temperature in Bayleva. In the first decade of the record the average annual air temperature was −5.2◦C, in the second decade it was−3.7◦C. So, the increase of the average annual air temperature is approximately 1.5◦C. The very wet years of 2015, 2016, 2018 were also rather warm years in comparison to the 20-year annual mean of the air temperature of−4.4◦C. 2015 was 1.5◦C warmer than this annual mean, 2016 2.8◦C and 2018 1.5◦C. This link becomes even clearer for the winter of 2015/2016 and 2017/2018. 2015/2016 was the second-warmest winter of the complete time series (−7.25◦C) and had a total of liquid precipitation of 118 mm (winter mean is 66 mm). The winter 2017/2018 was even the warmest winter with −6.4◦C and had a total liquid precipitation of 126 mm.
4.1 General liquid precipitation development
1995 2000 2005 2010 2015 2020
Year 0
200 400 600
Prec (mm)
Annual total Linear trend Winter total
1995 2000 2005 2010 2015 2020
Year -6
-4 -2
Tair (°C)
Annual mean Linear trend
1995 2000 2005 2010 2015 2020
Year -4
-2 0
Ts (°C)
Annual mean Linear trend
Figure 4.1: Annual averages for liquid precipitation (above; annual totals), air temper- ature (middle; annual means) and topsoil temperature (below; annual mean) with linear trends from Aug 1999 to Sep 2020
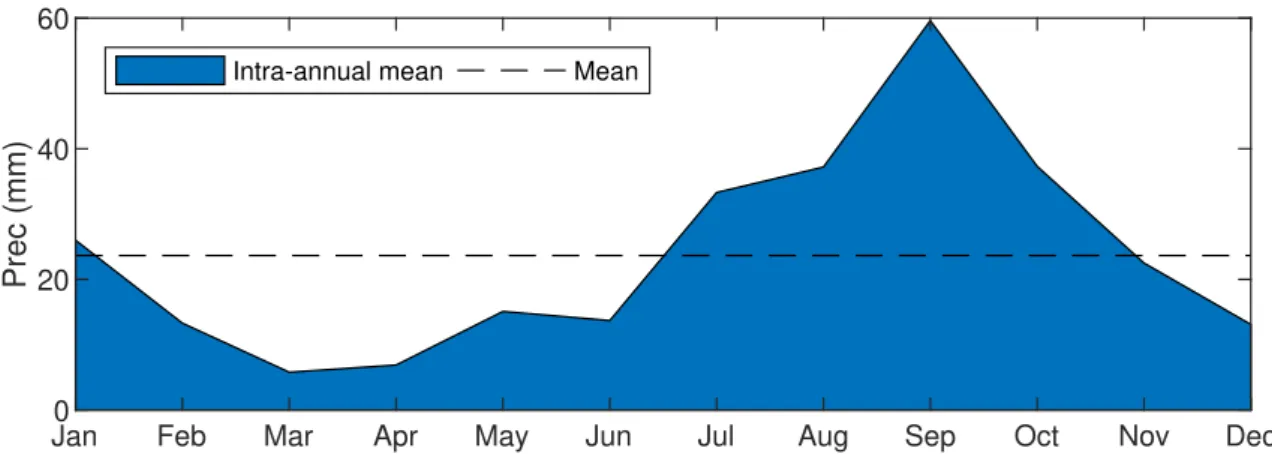
Within the record, the late summer and the early autumn were characterized by higher monthly average of liquid precipitation with a maximum of around 60 mm in September (Figure 4.2). In late autumn and early winter intra-annual means precipitation declined below the monthly average of 24 mm, in January it was slightly above the average.
The spring season was characterized by relatively less liquid precipitation which rose in summer in accordance to increasing air temperature. I found an increase of the average seasonal liquid precipitation for all four seasons between the first decade and the second.
The highest increase was found in autumn. The mean total surged from 93 mm (first decade) to 146 mm (second decade). The second highest increase of the average seasonal total was found in spring (from 15 mm to 39 mm), followed by winter (from 45 mm to 66 mm) and summer (from 77 mm to 91 mm). The available associated snow depth data showed a decreasing tendency in all snow seasons (autumn, winter, spring) which is in
4.2 Extreme liquid precipitation development
line with the higher liquid precipitation totals.
Jan0 Feb Mar Apr May Jun Jul Aug Sep Oct Nov Dec
20 40 60
Prec (mm)
Intra-annual mean Mean
Figure 4.2: Intra-annual course of monthly average liquid precipitation from Aug 1999 to Sep 2020
In summary, the results show an overall increase of liquid precipitation on annual as well as seasonal bases between 2000–2019 for the Bayleva site. This increase is in accordance with a rise in associated air temperatures for this period as well as a tendency in a decreasing snow cover.
4.2 Extreme liquid precipitation development
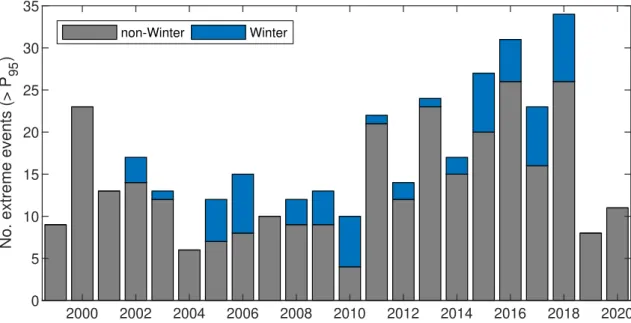
The global 95th percentile of the time series of liquid precipitation was 4.5 mm. 364 of 7,732 daily observations (4.7%) were above this threshold. Among these 364 observations in 153 cases (days) the daily liquid precipitation total exceeded 10 mm. The top ten of these events are listed below (see Table 4.1). The top two events occurred in the very moist and warm years of 2016 and 2018. The top 3 and 4 events appeared consecutive and can be seen as one event. 50% of the top ten events occurred in autumn, 30% in winter and 20% in summer.
4.2 Extreme liquid precipitation development
Table 4.1: Top ten of daily extremes (≥10 mm) of observed liquid precipitation
Date mm
07.11.2016 70.3 13.01.2018 59.2 08.10.2002 46.1 09.10.2002 44.2 03.09.2017 39.4 07.12.2002 38.5 23.01.2015 38.2 18.09.2001 35.8 25.08.2002 33.8 30.08.2018 32.2
The frequency of days with liquid precipitation above 4.5 mm rose from 134 in the first decade to 210 in the second decade, a more than 40 % increase. In the first decade those events occurred 23 times (17 %) in winter, in the second decade they occurred 39 times (18%) in winter.
2000 2002 2004 2006 2008 2010 2012 2014 2016 2018 2020 0
5 10 15 20 25 30 35
No. extreme events (> P 95)
non-Winter Winter
Figure 4.3: Annual numbers of extreme rain events above the 4.5 mm threshold (global 95th percentile of the whole record) from Aug 1999 to Sep 2020)
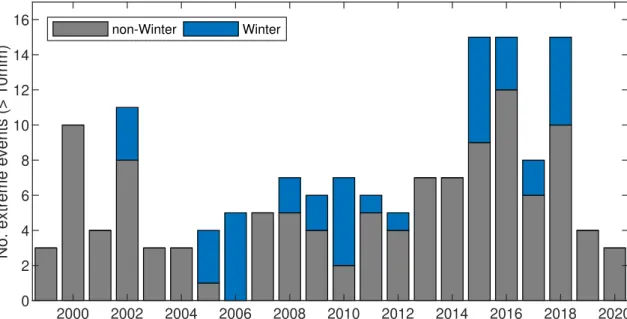
Figure 4.4 shows the distribution of the absolute extreme liquid precipitation events above the daily threshold of 10 mm. In the first decade, on 58 days the amount of liquid
4.3 Topsoil temperature development
precipitation exceeded the 10 mm threshold. 25% of those occurred in winter. The second decade had 92 daily events with 25 % in winter. That shows, that there was also an increase of extreme events in the second decade in general but the fraction of those events occurring during winter did not change at all. In other words, an overall increased frequency of rain events is independent of its distribution with respect to winter seasons.
2000 2002 2004 2006 2008 2010 2012 2014 2016 2018 2020 0
2 4 6 8 10 12 14 16
No. extreme events (> 10mm)
non-Winter Winter
Figure 4.4: Annual numbers of extreme rain events above the 10 mm threshold from Aug 1999 to Sep 2020
4.3 Topsoil temperature development
From 2000–2019 the annual mean temperature of the soil in 10 mm depth (topsoil tem- perature) was approximately−1.3◦C with a maximum of 1◦C in 2006 and a minimum of −4.5◦C in 2003. The topsoil temperature has increased by 0.33◦C between the first and the second decade, but it was rather variable. From 2003 to 2006 there was a strong increase to the 1◦C maximum. After a decline until 2010 to−2.61◦C a more constant period followed with temperatures between 0 and−1◦C. From 2017 to September 2020 the average annual topsoil temperature was decreasing again (Figure 4.1, bottom panel).
Regarding the seasonal behaviour of the topsoil temperature four phases were identified.
A cold period from February to April where the topsoil is frozen with a minimum tem- perature above −6◦C, a warming period in May and June, a thawed active layer from
4.4 Effects of rain-on-snow on topsoil temperature
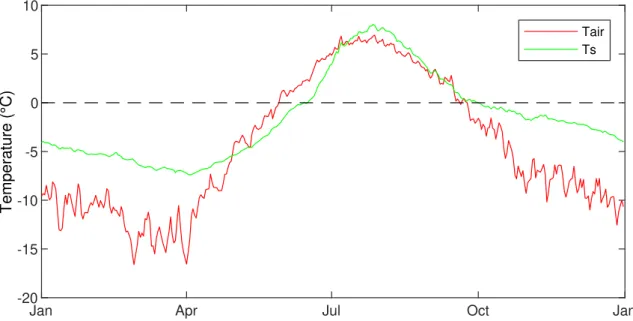
July to October where topsoil temperature are above 7◦C and a refreezing of the active layer from October to the negative peak in April. In spring and winter temperatures of the topsoil deviated from the annual mean by 2.6◦C and 1◦C in summer and autumn.
That shows the frozen state of the active layer is more exposed to meteorological and other environmental changes. Figure 4.5 shows that the average daily course of the topsoil temperatures is in accordance to the average daily course of the air temperature with some time lag.
Jan Apr Jul Oct Jan
-20 -15 -10 -5 0 5 10
Temperature (°C)
Tair Ts
Figure 4.5: Intra-annual course of daily topsoil and air temperature from Aug 1999 to Sep 2020
4.4 Effects of rain-on-snow on topsoil temperature
4.4.1 November 2016
A detailed investigation of three extreme events revealed different reactions of the topsoil temperature to a strong rain event. The most extreme event of the 7th November 2016 (Table 4.1, Figure 4.6) did not show a noticeable change of the topsoil temperature after the extreme event. The temperature of the soil was slightly below 0◦C before the extreme event and at this time no snow covered the ground. There was no rain-on-snow event. Furthermore, the air temperature was positive before and during the event. That
4.4 Effects of rain-on-snow on topsoil temperature
indicates that the active layer may have begun to thaw before the rain and all incoming energy from the atmosphere was invested in the thawing in the form of latent heat.
Hence, a warming effect is not to see in topsoil temperature shortly after the rain event.
It would be visible by the liquid water content change. The actual warming effect can be seen later, when the thawed topsoil refreezes and remains at 0◦C instead of dropping faster (like air temperature).
Nov 06 Nov 09 Nov 12 Nov 15 Nov 18 Nov 21
2016 -6
-4 -2 0 2 4
Temperature (°C)
0 10 20 30 40 50 60 70 80
Prec (mm)
Tair Ts Prec
Figure 4.6: Extreme rain event on 07.11.2016 (Top 1) with 70.3 mm and associated topsoil and air temperatures, no snow cover occurred
4.4.2 January 2018 and the complete snow season
A different reaction was observed for the extreme event on the 13th of January 2018.
One day before the rain event, the soil was frozen below −6◦C and 13 cm of snow were observed (Figure 4.7). Despite the fact, that the air temperature rose, it is obvious that the extreme rain with almost 60 mm affected the topsoil temperature strongly. Within two consecutive days the topsoil temperature increased from below −6◦C to almost
−1◦C. For a short period of several hours it was even above the air temperature. It seems unlikely that only the slight increase of the air temperature (1.5◦C) caused the topsoil temperature to rise by such an extent. As mentioned, the snow depth before the event was 13 cm, on the day of the event it declined to 9 cm and then remained at 5 cm. Therefore, the event on 13th January 2018 was a rain-on-snow (ROS) event and
4.4 Effects of rain-on-snow on topsoil temperature
the strong increase of the topsoil temperature indicates that latent heat was released as rain percolated through the snow and froze at the ground of the soil and affected the soil temperature positively.
Jan 12 Jan 15 Jan 18 Jan 21 Jan 24 Jan 27
2018 -12
-10 -8 -6 -4 -2 0 2 4
Temperature (°C)
0 10 20 30 40 50 60
Prec (mm)
Tair Ts Prec
Figure 4.7: Extreme rain event on 13.01.2018 (Top 2) with 59.2 mm and associated topsoil and air temperatures, 9 cm snow occurred on this day
Figure 4.8 displays the period from November 2017 to April 2018. In these months, snow normally occurs and ROS-events are possible. Several phenomenons can be seen in this plot. The black-dotted line is the predicted topsoil temperature from a linear regression model that regresses topsoil temperature on air temperature only. The slope coefficient is about 0.3 and statistically significant at the 99% confidence level. Before the extreme rain event on 13th January 2018 this line fits quite well (R2 = 0.41) with the actual top-soil temperature (except at the beginning of November, since at the end of October there was another extreme rain event). The three greatest differences between the actual topsoil temperature and the predicted topsoil temperature were on
1. 28.02.2018, 1 day after a two-day consecutive extreme rain event (26.02: 17.5 mm rain, 28.02.: 18.5 mm rain) with a snow depth of around 30 cm these days
2. 01.03.2018, 2 days after a two-day consecutive extreme rain event (26.02: 17.5 mm rain, 28.02.: 18.5 mm rain) with a snow depth of around 30 cm these days
4.4 Effects of rain-on-snow on topsoil temperature
3. 14.01.2010, 1 day after a single extreme rain event (13.01.: 17.5 mm) with a snow depth of around 10 cm
which are also displayed in Figure 4.9 (indicated by an asterisk) and show the residuals of the linear model of topsoil temperature by air temperature. Immediately after these three extreme rain events topsoil temperature rose. The great differences between the predicted values and the actual values of topsoil temperature indicate that air tempera- ture cannot explain topsoil temperature solely during these periods. These residuals can be meaningfully interpreted as anomalies due to the extreme precipitation events. The effect of the two extreme rain events (January 2018 and end of February 2018) on the topsoil temperature varied, because snow depth was different. At the end of February 2018 the snow was thicker and the location of the heat release may be different, in the snowpack or on the ground surface, so possibly the latent heat release to the soil was different. To summarize, an effect of heavy rain on the topsoil temperature development as captured by the residuals from the linear regression for the snow season 2017/2018 was found.
Nov 2017-25 Dec 2017 Jan 2018 Feb 2018 Mar 2018 Apr 2018 May 2018 -20
-15 -10 -5 0 5
Temperature (°C)
0 10 20 30 40 50 60
Prec (mm)
Tair Ts Ts_fit Prec
Figure 4.8: Snow season of 2017/2018 with daily liquid precipitation, air temperature, original topsoil temperature and predicted topsoil temperature (by air temperature), asterisks mark greatest differences between predicted and actual values of topsoil temperature
4.4 Effects of rain-on-snow on topsoil temperature
Nov 2017-6 Dec 2017 Jan 2018 Feb 2018 Mar 2018 Apr 2018 May 2018 -4
-2 0 2 4 6
Temperature (°C)
0 10 20 30 40 50 60
Prec (mm)
Residuals Prec
Figure 4.9: Snow season of 2017/2018 with daily liquid precipitation and the residuals of the predicted topsoil temperature (by air temperature), asterisks mark highest ranked residuals
4.4.3 January 2015
The extreme event on the 23th January 2015 confirms the hypothesis, that a heavy rain-on-snow event affects topsoil temperature (Figure 4.10). Due to a lack of available snow data, the snow cover was determined by a photography of the site on this day.
Snow existed and the rain event had a positive impact on the topsoil temperature. On 22th January it rained 18 mm, on the 23th January 38 mm, topsoil temperature was rising from −4◦C to −1.1◦C within two consecutive days. Two days after the event, air temperature was dramatically decreasing but topsoil temperature remained more constant for the following days.
4.5 Correlations and linear regression model
Jan 21 Jan 24 Jan 27 Jan 30 Feb 02 Feb 05
2015 -20
-15 -10 -5 0 5
Temperature (°C)
0 5 10 15 20 25 30 35 40
Prec (mm)
Tair Ts Prec
Figure 4.10: Extreme rain event on 23.01.2015 (Top 7) with 38.2 mm and associated topsoil and air temperature, snow cover occurred
Both examples of extreme liquid precipitation events in winter indicate that extreme rain can disturb the thermal state of the topsoil most remarkably in winter, but also in autumn, where it influences the phase change (freeze/thawing) and is not directly visible in the temperature, but to a later time. A correlation analysis of the liquid precipitation and the topsoil temperature revealed a average time-lag of 1 day until a maximum reaction of topsoil temperature on the extreme event is reached.
4.5 Correlations and linear regression model
The Pearson correlation coefficient of the daily liquid precipitation and the daily topsoil temperatures was found to beR= 0.12, with a time lag of 1 day it increased marginally to R = 0.13, which both correspond to a very weak positive correlation. Between air temperature and topsoil temperatureR= 0.73 (strong) which shows the dominant effect of air temperature on topsoil temperature. By filtering the daily liquid precipitation values by different thresholds of precipitation (in accordance to defined extremes) and in order to maximize the correlation, the coefficients decreased to a very low negative correlation (R = −0.1 to R = −0.2). In the snow season 2017/2018, the Pearson
4.5 Correlations and linear regression model
correlation coefficient between rain and topsoil temperature with a time lag of 1 day was R= 0.3 which corresponds to a weak positive correlation.
Table 4.2: Results of linear regression models. (1) for topsoil temperature by liquid precipitation, (2) for topsoil temperature by the dummy variable for extreme events, (3) for topsoil temperature with extreme liquid precipitation and air temperature
Dependent variable:
Ts_10
(1) (2) (3)
prec 0.194∗∗∗
(0.018)
dummy 2.021∗∗∗ −1.289∗∗∗
(0.413) (0.290)
Tair_200 0.443∗∗∗
(0.005) Constant −1.502∗∗∗ −1.388∗∗∗ 0.524∗∗∗
(0.060) (0.059) (0.047)
Observations 7,262 7,262 7,084
R2 0.015 0.003 0.533
Adjusted R2 0.015 0.003 0.533
Note: ∗p<0.1; ∗∗p<0.05; ∗∗∗p<0.01
The linear regression model (1) for topsoil temperature (10 cm) by liquid precipitation reveals a positive and significant slope coefficient, stationary residuals for inference but very low fit (R2). It indicates that 1 mm of rain is associated with a 0.19◦C increase in topsoil temperature. Linear model (2) uses the dummy variable for extreme events (0 = no extreme, 1 = extreme,≥10 mm) and finds an even higher coefficient, indicating that the occurrence of an extreme liquid precipitation event is associated with an increase of about 2◦C, also highly statistically significant, stationary residuals and also a low fit.
The first two linear regression models omit that topsoil temperature is not only affected by liquid precipitation but also by air temperature and snow. Further, precipitation and air temperature are weakly positively correlated (R = 0.22, R = 0.12 for a daily precipitation and extreme precipitation, respectively). Therefore, a simple linear model
4.5 Correlations and linear regression model
which attempts to explain topsoil temperature only by liquid precipitation is upward biased and needs to be correctly specified by more covariates. When applying a multiple linear regression model (3) for topsoil temperature with extreme liquid precipitation AND air temperature, a statistically significant negative coefficient of liquid precipitation (dummy) and a statistically significant positive coefficient for air temperature were found with a good fit (R2 = 0.53). As one can see, accounting for an important omitted variable affects the size and even reverses the sign of the coefficient associated with extreme liquid precipitation. However, a negative association between topsoil temperature and extreme liquid precipitation can be ruled out by theory. Such an counter-intuitive empirical result can be explained by data limitations that are due to the rare nature of extreme events as well as additional environmental and atmospheric factors.
Chapter 5
Discussion and Conclusion
5.1 Discussion
The analysis showed that the general liquid precipitation increased within the whole observation period which is in line with an average increased air temperature. This tendency of warmer and more moist weather at Spitsbergen accords with the findings of Hanssen-Bauer et al. (2019). They identified an increase of precipitation for Ny-Ålesund between 1961–1990 and 1971–2000 from 385 mm to 409 mm. Likewise they showed that solid precipitation decreased in Ny-Ålesund during 1975–2017 and determined an in- creased frequency of rain-on-snow events for the last fifty years. Further, they presented a rise of annual air temperature of −6.3◦C to −5.7◦C. For the period from 1971–2000 they indicated an overall upward change in precipitation of 7.1% per decade and a warm- ing trend of 0.7◦C per decade for Ny-Ålesund. In addition to the general increase in liquid precipitation that was established an increase of liquid precipitation in all sea- sons also for winter was found. This finding is in accordance to the enhanced cyclone activity in winter which has been described by Rinke et al. (2017) for the period from 1979–2015.
I concluded that intensified rainfall is linked with the Arctic warming for the years of 2015, 2016 and 2018 where the highest annual as well as winter totals of liquid pre- cipitation were observed. Bintanja (2018) emphasizes this link between enhanced air temperatures in the Arctic and intensified precipitation, especially in winter. They point out that the increased rainfall in the Arctic is to an extent of 30% caused by large-scale and non-local thermo-dynamical processes and to 70 % caused by changes of
5.1 Discussion
air temperature on local scale that determines whether precipitation occurs as snow or as rain. They assume that with an enhanced local warming of the Arctic the possibility that precipitation falls as rain rather than snow is likely to increase.
Regarding an increased frequency of extreme rainfall in general and for the winter season I found a clear increase for both between the first (2000–2009) and the second decade (2010–2019) of the record. But it is to mention that on basis of the time series investi- gated in this work winter extremes increased only proportionate to the total increase of extreme rain events which is opposite to the indications of Hanssen-Bauer et al. (2019) who found an clear increase of rain extremes particularly in winter. For Ny-Ålesund they showed an overall record of 98 mm for the winter in 2012. But Serreze et al. (2015) point out that the occurrence of extreme rain is very variable within Spitsbergen. At different sites like Longyearbyen or Barentsburg extremes are less frequent and therefore they indicate no temporal trend in extreme precipitation at Spitsbergen. Hence, my finding for Bayleva regarding the occurrence of extreme rain in winter is not representative for the whole of Spitsbergen or Svalbard. Further, the overall recorded extreme of liquid precipitation for Ny-Ålesund of 98 mm is not considered in this work, since it was not recorded (data gap). In consideration of other data gaps in this record it is to mention that a complete time series of liquid precipitation for the observed period may resulted in different indications regarding the occurrence and frequency of extreme rainfall in general and in winter.
The average topsoil temperature rose around 0.33◦C within the recorded period between the first and the second decade which agrees well with the increase of the active layer thickness as well as permafrost temperatures at Spitsbergen by Hanssen-Bauer et al.
(2019) and in the overall Arctic by Biskaborn et al. (2019). A high positive correlation between liquid precipitation and topsoil temperature as well as a high positive correla- tion between extremes and topsoil temperatures could not be confirmed with the Pearson correlation coefficient. One the one hand, this might be due to the limited number of observed extremes. The effect could probably be greater if stronger extremes (≥20 mm) as reported by Serreze et al. (2015) and Romanovsky et al. (2010) would occur more fre- quently. On the other hand, the weak correlation shows that liquid precipitation is not the only and not the dominant factor that influences soil temperature in the high Arctic.
The analysis with a simple linear regression model underlines this fact. Soil tempera- ture cannot be explained by liquid precipitation only. The complex interactions of air temperature, solid and liquid precipitation, the type of soil, vegetation, shortwave and longwave radiation influence the thermal regime of permafrost as described by Hansen
5.1 Discussion
et al. (2014) and Yang and Kane (2021). A differentiated analysis that considers these different environmental factors requires a more sophisticated methodology. Furthermore, the linear regression model could be biased due to existing data gaps. If a single season or two are missing within the daily data (as for single years in the record that was used in this work), the coefficients can be biased. For further studies, I suggest an adequate interpolation of the meteorological variables as well as for the soil temperature that cope with the high complexity of the interactions between these variables and combines the physical and statistical dimensions sufficiently.
Although the most extreme liquid precipitation event of Ny-Ålesund was on 30th January 2012 with a daily total of 98 mm was not recorded by AWI (data gap), the investigation of other distinct extreme events in this work showed a remarkable effect on topsoil tem- perature on a micro-level and indicates complex interactions of several environmental factors regarding the heat fluxes between atmosphere and ground. In particular rain-on- snow events have a noticeable impact on topsoil temperature as was shown in Figure 4.8 and Figure 4.9. When snow covers the ground and cannot store the rain completely, the rain percolates through the snow to the soil surface and freezes. The thereby released la- tent heat warms the topsoil. But the increase of the topsoil temperature after an extreme rain event strongly depends on the presence of snow, its actual amount, its temperature and its water holding capacity as Westermann et al. (2011) showed. Fang et al. (2019) also determined a high variability in the correlations between soil temperatures and pre- cipitation in the Tibetan Plateau regarding the exact location, the snow depth and the snow pack properties. Summarizing, rain only has an impact on soil temperature if it is really extreme and percolates through the snow to the soil surface. This condition was met for the two events in January 2015 (Figure 4.10) and January 2018 (Figure 4.7), that have been investigated in this work. In addition, a detailed investigation of the snow season 2017/2018 in this work showed that rain events influenced the topsoil tempera- ture even for several weeks. Such an impact of extreme rain on the thermal regime of the permafrost (active layer) was only visible by the event-based analysis. Nevertheless, the anomalous short-term behaviour of the topsoil temperature can contribute to the destabilization of the permafrost and foster its degradation as indicated by Christensen et al. (2020) and Westermann et al. (2011). The extreme events that occurred in au- tumn did not show such clear and immediate effect on the topsoil temperature like those winter events but they may influence the thermal state of the active layer later. The identified time lag by which the soil responds to the rain event found in this work is one day but this should not be interpreted as a general time lag since only distinct events were investigated and the time lag can possibly not be explained only by rain but rather
5.1 Discussion
by air temperature, the existing snow depth and the type of soil.
There exists still uncertainties if extreme rain events may actually increase in the future at Spitsbergen until the end of the century. Rain-on-snow events are highly dependent on atmospheric circulation (Hansen et al., 2014). Førland et al. (2011) have shown that rain events above 20 mm were rather unusual until the end of the 21st century. The observed years of 2019 and 2020 in this study were at a very low level regarding the annual liquid precipitation totals as well as the air temperature. The winter seasons 2019/2020 were very cold with a winter mean air temperature of−14.4◦C, topsoil tem- peratures decreased accordingly to −8.8◦C and liquid precipitation was close to zero.
Hence, the years 2015, 2016, 2018 with intensified rainfall may be temporal exceptions.
For a valid assessment the following years need to be considered in future research on empirical-statistical projections of large-scale precipitation predictions from Global Cli- mate Models and their adaption for regional scales need to be enhanced. The prediction of precipitation pattern poses a difficult task (Førland et al., 2011; Bintanja and Andry, 2017).
Regarding the effect of heavy rainfall on soil temperature I suggest further studies which aim to explore from which magnitude liquid precipitation events start to outperform the effect of air temperature. Putkonen and Roe (2003) determined that the extreme event on 30th January 2012 (98 mm) increased the soil surface temperature as a 7◦C increase of mean wintertime surface temperature. Such a clear proposition was not possible for this work. Every events was characterized by different environmental conditions that influenced the actual impact on soil temperature. Therefore, it can be said that heavy rain has a positive impact on topsoil temperature, but the extent is uncertain.
Further studies should examine the actual impact of extreme rain on soil temperature by more event-based studies with different classifications of extremes and a more complete consideration of the physical interactions.
Finally, it should be noted that despite quality assurance the recorded data contains data gaps and measurements of the liquid precipitation in rain gauges can be exposed to occasionally occurring strong winds. Further, the snow data has larger data gaps than the other variables. Hence, an adequate investigation of changes in solid and liquid precipitation rates could not be conducted but would certainly contribute to a deeper understanding of changes in general and extreme precipitation. Anyhow, for the whole record increases (extreme) rainfall, air temperature and topsoil temperatures have been revealed as well as an impact of heavy rain on topsoil temperature for single events.
5.2 Conclusion
5.2 Conclusion
This study’s objective was to describe (extreme) liquid precipitation developments at Spitsbergen and relate this to alarming permafrost degradation by an enhanced topsoil temperature (active layer), especially in winter. Therefore, seasonal and annual develop- ments of (extreme) liquid precipitation and associated air and topsoil temperatures were described and an event-based study of distinct extreme events was conducted. Wetter and warmer conditions influence the high Arctic for several decades. Due to its location, Spitsbergen is particularly exposed to the global warming induced heat and moisture transfer to the Arctic. Air temperature, rainfall and topsoil temperature of the per- mafrost have increased within the 21-year record. A link between extreme rainfall and the increase of topsoil temperature was presented on a micro-level. Notwithstanding the limitations of a complete data record for the observed period, my study contributes to current research that investigates the impact of an intensified hydrological cycle in the Arctic on permafrost degradation that already occur due to the amplified warming. For a deeper understanding of the temporal and spatial variability of Arctic rainfall as well as changes in the ratio of liquid and solid precipitation in the Arctic further research needs to be accomplished in order to enhance climate modelling and the projections of potential terrestrial feedback. That will raise the public awareness for the vulnerable Arctic environment that affects global climate essentially.