Page | 1
FAULT PATTERNS, FAULT ACTIVITY
RECONSTRUCTIONS AND A NEW SOURCE CANDIDATE FOR TSUNAMIS IN THE MESSINA STRAIT, SOUTHERN
ITALY
DISSERTATION
in fulfilment of the requirements for the degree “Dr. rer. nat.”
of the Faculty of Mathematics and Natural Sciences at Kiel University
submitted by
Lili Fu
Kiel, 2015
Page | 2
First referee: Prof. Dr. Sebastian Krastel-Gudegast Second referee: Prof. Dr. Jan-Hinrich Behrmann
Date of the oral examination: 21.09.2015
Approved of publication: 22.09.2015
Page | 3
Hiermit erkläre ich, dass die vorliegende Dissertation – abgesehen von der Beratung durch meine Betreuer – nach Inhalt und Form meine eigene Arbeit ist. Weder diese noch eine ähnliche Arbeit wurde an einer anderen Abteilung oder Hochschule im Rahmen eines Prüfungsverfahrens vorgelegt, veröffentlicht oder zur Veröffentlichung vorgelegt.
Ferner versichere ich, dass die Arbeit unter Einhaltung der Regeln guter wissenschaftlicher Praxis der Deutschen Forschungsgemeinschaft entstanden ist.
Lili Fu
Page | 4
ABSTRACT
Submarine hazards, such as earthquakes, submarine slope failures, and resulting tsunamis, on the continental margins pose great threats to coastal communities and have received much concern in scientific research. The 1908 Messina earthquake and tsunami, the deadliest event in Europe since then, is a typical event of this kind. However, no general agreement has been archived on the seismogenic/tsunamigenic faults, mainly because the tectonics of the Messina Strait is still unclear.
In order to contribute to this open question, new multi-beam bathymetry data, sediment echo sounding data, and high-resolution 2D reflection seismic data were collected during RV Meteor Cruise M86/2 off Southern Italy (including the Messina Strait) from December 27th, 2011 to January 17th, 2012. Based on the new data, many near-surface faulting structures have been identified for the first time in the Messina Strait. The fault patterns of the Messina Strait were built up and analysed, fault activities in the outer Messina Strait were reconstructed, and numerical tsunami modelling was done. Central questions of this thesis include:
i) What types of faults have been identified in the Messina Strait?
ii) How do they fit to the overall tectonic framework of the Messina Strait?
iii) Were the faults in the outer Messina Strait active recently?
iv) Can the faults in the outer Messina Strait generate tsunamis and how large may they get?
The new data suggest that the inner Messina Strait is an angular graben. Near-surface faults in the graben strike in N-S and E-W directions. The N-S-trending near surface faults are right-lateral transtensional faults and distribute along the Messina Canyon and the coastline off southern Calabria, dipping toward the Messina Canyon; E-W-trending near-surface faults are left-lateral transtensional faults and located in the northern inner Messina Strait off Calabria. Most of them dip toward the south.
The apparent dip angles of all near-surface faults are less than 50 degrees. Several newly-discovered near-surface faults fit to the suggested focal mechanisms of the 1908 Messina earthquake, but we were not able to identify the master fault of this event. The lengths of the fault planes (< 15 km) are too small to generate an earthquake of 7 Mw. The inferred Taormina Fault (TF) was considered as one of the most hazardous and largest seismic gaps in Italy. However, this fault has not been imaged on any seismic data set including our new seismic data. Hence, the existence of the TF is doubted.
Page | 5 In the outer Messina Strait, a prominent fault zone has been discovered and named as the Fiumefreddo - Melito di Porto Salvo Fault Zone (F-MPS_FZ). It is located in the source area proposed for the 1908 Messina tsunami. The F-MPS_FZ is a E-W-trending left-lateral transtensional fault zone, which shows ongoing tectonic activity and supports a transtensional regime in the outer Messina Strait. Most of the faults in this zone dip toward the south at apparent dip angles around 60 degrees. The dominant scarp- like structure (DSS) represents the surface expression of the master fault of the F-MPS_FZ. The F- MPS_FZ may be a STEP-Connector Fault, linking the two postulated Subduction-Transform Edge Propagator (STEP) faults: the Ionian Fault and the Alfeo-Etna Fault. This STEP-Connector Fault may have formed in two ways: in a pull-apart basin style or in a fault-termination basin style. Based on our data, the pull-apart basin style model is more reasonable for this newly-discovered fault zone.
The F-MPS_FZ reach down to the acoustic basement. It has been active during the entire regional tectonic evolution of the outer Messina Strait. During its evolution, the fault activity alternated between tranpressional and transtensional with varying apparent displacements. Currently, the F-MPS_FZ is an active transtensional fault zone. Based on the results of the tsunami modelling, the F-MPS_FZ could generate tsunamis, and an assumed slip rate of up to 15 m could generate a tsunami comparable to the 1908 Messina tsunami, but the F-MPS_FZ may not be a candidate source for the 1908 Messina tsunami, because an E-W-trending fault is not in agreement with seismological data of the 1908 Messina earthquake, and a 15 m slip event is highly unlikely. However, the F-MPS_FZ is still a highly potential hazard source in Southern Italy, because it shows the most obvious vertical displacement in the entire Messina Strait and seems to be active.
Page | 6
ZUSAMMENFASSUNG
Untermeerische Naturgefahren wie Erdbeben und Hangrutschungen im Bereich von Kontinentalhängen sowie damit einhergehende Tsunamis haben in den letzten Jahrzehnten einen hohen Grad an Aufmerksamkeit in der Forschung erhalten. Dies liegt darin begründet, dass solche teilweise katastrophal verlaufenden Ereignisse eine hohe Zahl an Todesopfern fordern können und immense Schäden in Küstenregionen mit sich bringen können.
Das bis heute schwerwiegendste Ereignis dieser Art in Europa war 1908 das Messina-Erdbeben und der nachfolgende Tsunami, ein typisches Beispiel für eine solche Katastrophe. Jedoch herrscht bisher kein eindeutiger Konsens über die Lokation der Störungen die die Quelle für das Erbeben und den Tsunami waren, hauptsächlich weil die tektonischen Gegebenheiten der Straße von Messina noch nicht genau bekannt sind.
Um einen Beitrag zur Beantwortung der bisher ungeklärten Frage nach den Quellregionen für das Erdbeben und den Tsunami leisten, wurde während der Forschungsausfahrt M86/2 (FS METEOR) vom 27. 12. 2011 bis zum 17. 01. 2012 in Süditalien und der Straße von Messina, neue hochauflösende Fächerecholot-, Sedimentecholot-, und Mehrkanalseismik- Daten aufgezeichnet. Mithilfe der gewonnenen Daten war es nun es erstmals möglich einige unbekannte Störungszonen im Untergrund der Straße von Messina zu lokalisieren.
Basierend auf diesen neuen hydroakustischen und seismischen Daten, war es möglich, zahlreiche, bisher unbekannte oberflächennahen Verwerfungssysteme in und südlich der Straße von Messina zu identifizieren, Aktivitäten entlang dieser Störungszonen zu rekonstruieren und die numerische Modellierung eines möglichen Tsunami südlich der Straße von Messina durchzuführen. Die Hauptfragestellungen, die in dieser Arbeit behandelt werden lauten dementsprechend:
i) Welche Typen von von tektonischen Verwerfungen sind in der Straße von Messina vorhanden?
ii) Wie ist hängen diese Verwerfungen mit dem regionalen Störungssystem der Straße von Messina und von Süditalien zusammen?
iii) Sind die neu entdeckten Verwerfungen südlich der Straße von Messina aktiv?
iv) Könnten die Verwerfungen südlich der Straße von Messina eine Quelle für einen zukünftigen Tsunami darstellen und wenn ja, welche Ausmaße könnte ein solcher Tsunami haben?
Page | 7 Auf Grundlage der neu gewonnenen Daten ist zu vermuten, dass die innere Straße von Messina ein verkippter Graben ist. Oberflächennahe Verwerfungen im Bereich des Grabens entlang des Messina Canyons und der Küstenlinie des südlichen Kalabrien streichen N-S und fallen in Richtung des Messina Canyons ein, während im Bereich der nördlichen inneren Straße von Messina vorhandene sinistrale Transtensionsstörungen O-W streichen und hauptsächlich nach Süden einfallen. Der scheinbare Einfallswinkel aller oberflächennahen Störungen ist kleiner als 50 °. Einige neu entdeckte oberflächennahe Verwerfungen passen zum vorgeschlagenen Herdmechanismus des 1908 Messina Erdbebens, jedoch war es nicht möglich anhand unserer Daten die Hauptstörungsfläche zu identifizieren. Die Länge der Störungsflächen (<15 km) wären zu gering um ein Erdbeben mit der Magnitude 7 zu erzeugen. Die vermutete Taormina Verwerfung (TF) wird in dieser Arbeit als die westliche Begrenzung des Grabens der Straße von Messina vorgeschlagen. Es wird angenommen, dass sie einer der größten Gefahrenherde auf Grund ihrer seismischen Kluft für Erdbeben in Italien darstellt.
Jedoch konnte die TF bis heute, auch mit Hilfe der hier beschriebenen neuen seismischen Daten, nicht eindeutig nachgewiesen werden.
Das hier erstmals beschriebene Fiumefreddo - Melito di Porto Salvo Störungssystem (F-MPS_FZ) wurde in der äußeren Straße von Messina identifiziert und befindet sich ebenfalls in der vorgeschlagenen Quellregion des Messina- Tsunamis von 1908. Beim F-MPS_FZ handelt es sich um ein rezent aktives Verwerfungssystem, welches als links-laterale transtensive Verwerfungszone in der (äußeren) Straße von Messina identifiziert werden kann. Die meisten Verwerfungen dieser Verwerfungszone fallen in Richtung Süden mit einem scheinbaren Winkel von ~60° ein. Die dominierende stufenähnliche Struktur (DSS) repräsentiert die oberflächennahe Ausprägung der Hauptverwerfung des F-MPS_FZ. Das F-MPS_FZ stellt eventuell eine STEP-Connector Verwerfung dar, die die zwei vorgeschlagenen Transform Edge Propagator (STEP) Verwerfungen verbindet: Die Ionian Fault und die Alfeo-Etna Fault. Diese STEP-Connector Verwerfung könnte sich auf zwei verschiedene Arten ausgebildet haben: dem Pull-Apart Becken Stil oder dem Verwerfungsabschluss- Becken Stil. Anhand unserer Datengrundlage erscheint jedoch eine Bildung als Pull-Apart Basin plausibler.
Das F-MPS_FZ ist ein Ost-West streichendes Verwerfungssystem, das bis in das akustische Basement verfolgt werden kann. Es war während der gesamten tektonischen Entwicklung der äußeren Straße von Messina aktiv. Während seiner Entwicklung wechselten transpressive und transtensive Deformationsphasen, und damit einhergehend ergaben sich Variationen in der Sprunghöhe. Rezent stellt das F-MPS_FZ ein aktives transtensives Verwerfungssystem dar. Daher wird diese
Page | 8 Verwerfungszone als eine mögliche Quelle für zukünftige Tsunamis, die die italienischen Küsten treffen könnte, erachtet. Mit einem angenommenen vertikalen Versatz von bis zu 15 m könnte ein Tsunami ausgelöst werden, dessen Ausmaße mit denen des Tsunami von 1908 vergleichbar wären.
Jedoch ist nicht davon auszugehen, dass der Tsunami von 1908 an dieser Verwerfung ausgelöst wurde, da ein Ost-West streichendes Verwerfungssystem den gemessenen seismologischen Daten von 1908 nach nicht die Ursache des Erdbebens war. Zudem ist ein Versatz von 15 m während eines einzigen seismischen Ereignisses sehr unwahrscheinlich. Jedoch ist zu vermuten, dass es sich bei diesem Störungssystem um einen potentiellen Gefahrenherd handelt, da es die eindeutigsten und größten bekannten Sprunghöhen in der gesamten Straße von Messina aufweist.
Page | 9
DEDICATIONS
The 1908 Messina earthquake and tsunami, which occurred in the Messina Strait, is the deadliest event in Europe since then. However, no general agreement has been archived on the seismogenic/tsunamigenic fault [AMORUSO et al. 2002a; TINTI and ARMIGLIATO 2003b; ARGNANI et al.
2009a]. One of the obstacles may be the unclear neo-tectonic setting of the Messina Strait. To bridge this gap, ARGNANI et al. [2009a] obtained the first high-resolution seismic grid in the Strait and successfully identified some single neo-tectonic features, but did not construct the neo-tectonic patterns of the Strait.
Inspired by ARGNANI et al. [2009a]’s work and ideas, an additional survey was carried out by members of the Kiel Cluster of Excellence ‘The Future Ocean’ and colleagues from Italy. We recognized numerous faulting structures that were unknown before, and based on these newly-discovered faults, we are able to construct the near-surface fault patterns of the Messina Strait for the first time. The fault with the most remarkable surface expression is exactly located in the source area proposed by BILLI et al. [2008] for the 1908 Messina tsunami; this fault aroused our greatest interest. It is the master fault of the Fiumefreddo - Melito di Porto Salvo Fault Zone (F-MPS_FZ). This fault zone is located between two Subduction-Transform Edge Propagator (STEP) faults: the Ionian Fault [POLONIA et al. 2014] and the Alfeo-Etna Fault [GALLAIS et al. 2013; POLONIA et al. 2014]. It may work as a connector of the two STEP faults. The three form a larger faulting system. This kind of system has not been described before.
It may classify a new type of fault -- a STEP-Connector Fault.
We think that we have opened a new way of investigating submarine hazards off Southern Italy, but this new direction may even make the research more complicated.
Page | 10
TABLE OF FIGURES
Figure 1 (a) Source models for the 1908 Messina earthquake and tsunami. Modified after BILLI et al. [2008]; FAVALLI et al.
[2009a]; PINO et al. [2009b]. DSS, dominated scarp-like structure. The stars are epicentres proposed for the earthquake. The coloured straight lines together with the black rectangles show the possible seismogenic faults of the earthquake. The coloured straight lines indicate the intersections of the fault planes and the earth surface (cut-off lines).
The black rectangles represent the surface projections of the fault planes. The dashed segments of the fault planes show the uncertain parts of those faults. The straight lines connected to the ellipses indicate the moving directions of landslides. The blue bars perpendicular to the frame of the figure represent the tsunami run-up heights of some cities.
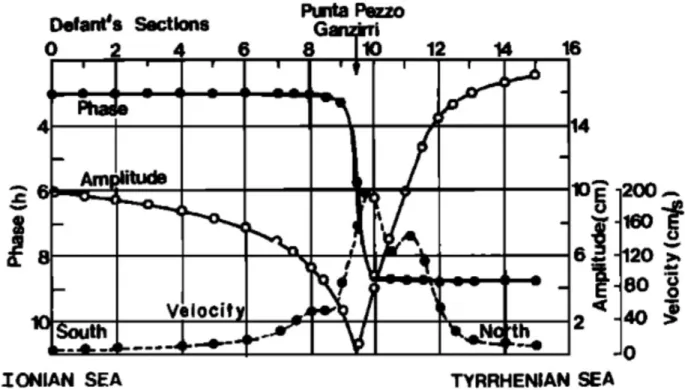
The numbers beside these bars are the values of the run-up heights in metres. (b) Overview of the Messina Strait. MS, Messina Strait. ... 21 Figure 2 Distribution of tidal height, amplitude and phase, and the tidal current speed through the Messina Strait. Computed
by DEFANT [1940]. ... 24 Figure 3 Schematic representation of the longitudinal distribution of currents at the sill of the Messina Strait, during a tidal
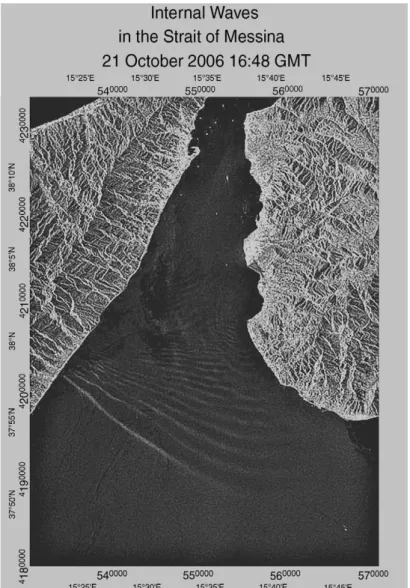
period, from DEFANT [1940]. Water mass in green is the Levantine Intermediate Water. Water mass in orange is the Tyrrhenian Surface Water. ... 25 Figure 4 SAR image for the Internal Wave in the Messina Strait. Data from RADARSAT1 satellite with a clear internal
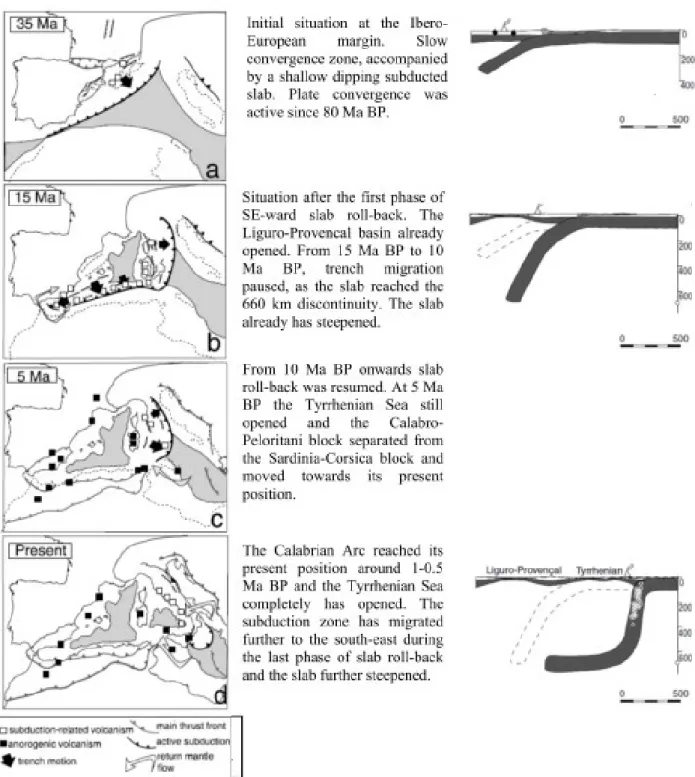
solitary waves train signature seen on 21 October 2006, 16:48 UTC. Taken from CASAGRANDE et al. [2009]. ... 27 Figure 5 Evolution of the African-Eurasian plate convergence zone over the last 35 Ma. Image was taken and modified
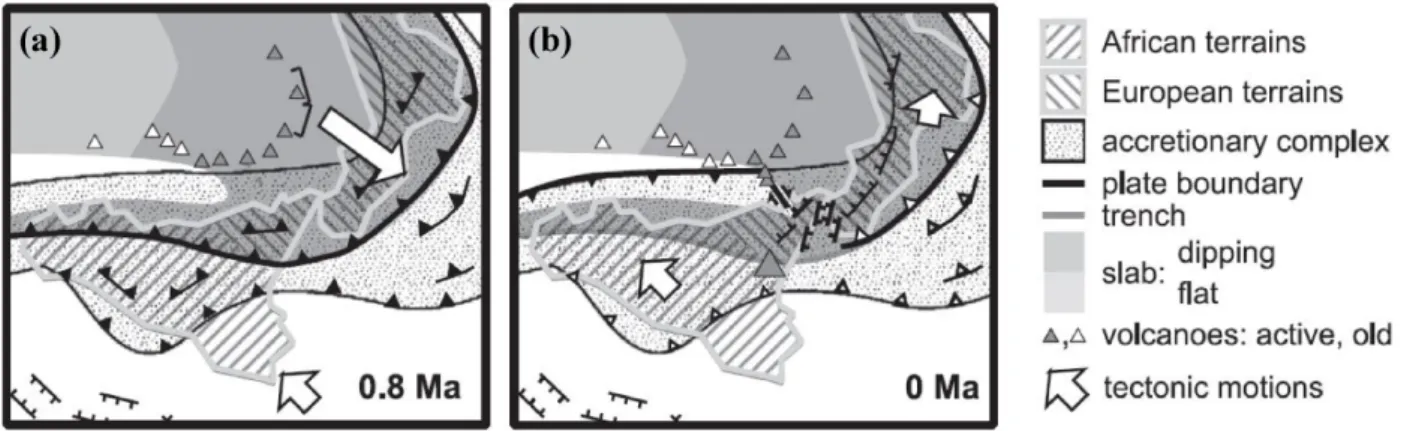
from FACCENNA et al. [2004] and FACCENNA et al. [2001]... 28 Figure 6 Sketch of the consequences of the recent tectonic change on the Sicily–Calabrian area. Lines and fills are explained
in the legend. Taken from GOES et al. [2004]... 30 Figure 7 Overall tectonic setting of the Messina Strait, Southern Italy. The red box in (b) shows the range of (a). Modified
from [ARGNANI and BONAZZI 2005; GUARNIERI 2006; CATALANO et al. 2008; ARGNANI et al. 2009a; POLONIA et al.
2011a; VITI et al. 2011a; DOGLIONI et al. 2012; GALLAIS et al. 2013]. MS, Messina Strait. SL, Sangineto line; TL, Tindari-Letojanni faults/Taormina Line. RIF, Rosolini–Ispica faults; AF, Avola fault; WF, Western Ionian Fault; EF, Eastern Ionian Fault; ASF, Acireale–S. Alfio faults; PF, Piedimonte fault; TF, Taormina fault; RCF, Reggio Calabria fault; ARF, Armo fault; SF, Scilla faults; SEF, S. Eufemia fault; CF, Cittanova fault; SRF, Serre fault; VF, Vibo fault;
CVF, Capo Vaticano fault. SCF, Southern Calabria fault; FA, fault discovered by ARGNANI et al. [2009a]; MSF, Messina Straits fault... 31 Figure 8 (a) 3D sketch of the Sicilian-Ionian Sea transition zone, where the Etna volcano is emplaced along the dextral
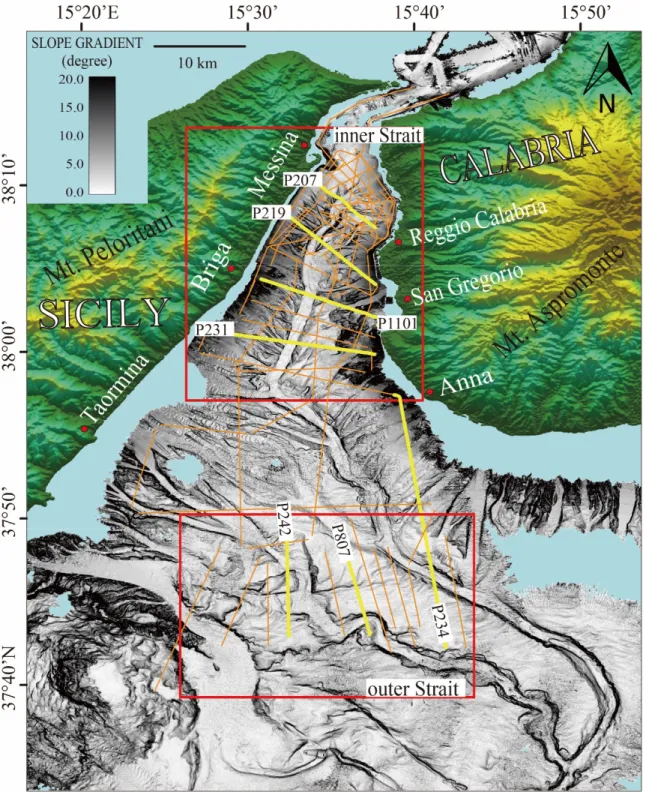
transtensional fault due to differential slab roll-back. (b) 2D view from above on the plate boundary zone. The differential trench migration, as well as the measured dips of the subducted slabs is displayed, showing a gentler dip west of the Malta escarpment and a steeper dip east of it. Images from DOGLIONI et al. [2001]. ... 32 Figure 9 Bathymetry of the Messina Strait with 2D seismic and hydro-acoustic survey lines (orange and yellow lines).
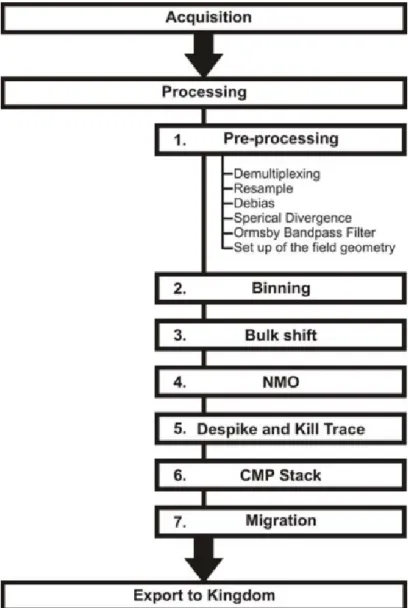
Survey lines in yellow are selected to be shown in this thesis. ... 43 Figure 10 2D seismic processing flow chart. ... 45
Page | 11 Figure 11 Velocity correction in bathymetry processing. [Left] Uncorrected bathymetry grid generated by “mbeditviz” with
the corresponding editing window (underneath). At least three seafloor surfaces can be observed, due to the strong downward dip of the outer beams. [Right] Same area and editing window as on the left images, but velocity corrected using a SVP-file. Only one seafloor is visible. ... 47 Figure 12 Frequency adjustment before migration. [Upper] migrated profile with an OBPF low cut frequency of 10/20 Hz
before migration. [Lower] migrated profile with an OBPF low cut frequency of 20/40 Hz before migration. An artificial reflector can be noticed above the seafloor reflector in the lower image. No increase/decrease of the S/N-ratio within the sediment strata is observable comparing the upper and lower image. ... 48 Figure 13 “Kill Trace” in 2D seismic processing. The upper image displays the data after 2D despike. The middle image
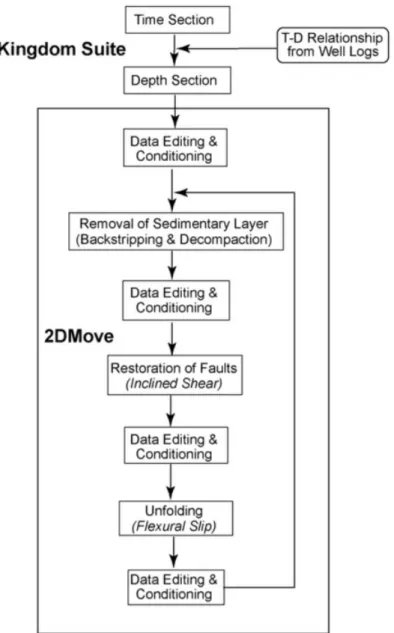
shows how the kill trace was applied to the data set. In the lower image, the result can be observed, showing a strong increase of the S/N-ratio as most of the assembly lines are erased. ... 49 Figure 14 Cross-section restoration flow chart, taken from Cukur et al. (2011) ... 51
Figure MI- 1 (a) Overall tectonic framework of Southern Italy. Modified from ARGNANI and BONAZZI [2005], GUARNIERI
[2006], CATALANO et al. [2008], ARGNANI et al. [2009a], POLONIA et al. [2011a], VITI et al. [2011a], DOGLIONI et al.
[2012], and GALLAIS et al. [2013]. MS, Messina Strait. SL, Sangineto line; TL, Taormina Line. RIF, Rosolini–Ispica faults; AF, Avola fault; WF, Western Ionian Fault; EF, Eastern Ionian Fault; ASF, Acireale–S. Alfio faults; PF, Piedimonte fault; TF, Taormina fault; RCF, Reggio Calabria fault; ARF, Armo fault; SF, Scilla faults; SEF, S. Eufemia fault; CF, Cittanova fault; SRF, Serre fault; VF, Vibo fault; CVF, Capo Vaticano fault; SCF, Southern Calabria fault;
FA, fault identified by ARGNANI et al. [2009a]; MSF, Messina Straits fault. Red box shows the ranges of Fig. MI-2 and Fig. MI-7a. (b) Overview map of central Mediterranean Sea. Red box shows the range of (a). The meanings of the symbols used in the figure are shown in the LEGEND. ... 56 Figure MI- 2 Bathymetry (slope gradient) of the inner Messina Strait. MC, Messina Canyon [COLANTONI 1987]; SCC,
South Calabria Canyon [RIDENTE et al. 2014]. Orange and yellow lines show the location of the seismic profiles. The profiles shown in this manuscript are marked in yellow. The red boxes show the ranges of Fig. MI-7b and Fig. MI-7c, respectively. ... 63 Figure MI- 3 (a) Seismic Profile P207 and (b) line drawing. Pink and black solid lines mark major surface faults and
basement faults, respectively. Brown sold lines mark minor faults. Dashed lines show inferred continuations of faults.
Vertical exaggeration is 8. See Fig. MI-2 and small inset map for location of profile. nfs_wMC, negative flower structure west of the Messina Canyon; nfs_uMC, negative flower structure under the Messina Canyon. ... 65 Figure MI- 4 (a) Seismic Profile P219 and (b) line drawing. Pink and black solid lines mark major surface faults and
basement faults, respectively. Brown sold lines mark minor faults. Dashed lines show inferred continuations of faults.
Vertical exaggeration is 8. See Fig. MI-2 and small inset map for location of profile. ... 66 Figure MI- 5 (a) Seismic Profile P1101 and (b) line drawing. Pink and black solid lines mark major surface faults and
basement faults, respectively. Brown sold lines mark minor faults. Dashed lines show inferred continuations of faults.
Vertical exaggeration is 8. See Fig. MI-2 and small inset map for location of profile. ... 67 Figure MI- 6 (a) Seismic Profile P231 and (b) line drawing. Pink and black solid lines mark major surface faults and
basement faults, respectively. Brown sold lines mark minor faults. Dashed lines show inferred continuations of faults.
Vertical exaggeration is 8. See Fig. MI-2 and small inset map for location of profile. ... 68
Page | 12 Figure MI- 7 (a) Newly-discovered near-surface faults (pink solid lines) in the tectonic framework of the inner Messina
Strait. The location of faults previously described (in chapter 1.2.2) are shown in black: TL, Taormina Line; TF, Taormina Fault; RCF, Reggio Calabria Fault; ARF, Armo Fault; SF, Scilla Faults; SEF, S. Eufemia Fault; CF, Cittanova Fault; SCF, Southern Calabria Fault; MSF, Messina Straits Fault. Gray lines are seismic profiles. (b) Horizontal distributions of the newly-discovered near-surface faults (pink solid lines). (c) Horizontal distribution of the newly-discovered basement faults. See Fig. MI-2 for locations of maps shown on Fig. MI-7a and MI-7b. ... 70
Figure MII- 1 (a) Overall tectonic framework of Southern Italy. Modified from GOVERS and WORTEL [2005]; ARGNANI and BONAZZI [2005]; GUARNIERI [2006]; CATALANO et al. [2008]; ARGNANI et al. [2009a]; POLONIA et al. [2011b]; POLONIA
et al. [2014]; VITI et al. [2011b]; DOGLIONI et al. [2012]; GALLAIS et al. [2013]. The green and blue lines show the location of Subduction-Transform Edge Propagator (STEP) faults. Dashed lines are inferred fault locations. MS, Messina Strait. SL, Sangineto line; TL, Taormina Line. RIF, Rosolini–Ispica faults; AF, Avola fault; WF, Western Ionian Fault; EF, Eastern Ionian Fault; ASF, Acireale–S. Alfio faults; PF, Piedimonte fault; TF, Taormina fault; RCF, Reggio Calabria fault; ARF, Armo fault; SF, Scilla faults; SEF, S. Eufemia fault; CF, Cittanova fault; SRF, Serre fault;
VF, Vibo fault; CVF, Capo Vaticano fault; SCF, Southern Calabria fault; FA, fault identified by ARGNANI et al. [2009a];
MSF, Messina Straits fault. (b) General map of central Mediterranean Sea... 85 Figure MII- 2 (a) Bathymetry of the outer Messina Strait with 2D seismic profiles. Location of map is shown on Fig. MII- 1. DSS, dominant scarp-like structure; NSS_N, northern N-S trending scarp-like structure; NSS_S, southern N-S trending scarp-like structure; SCC, South Calabria Canyon [RIDENTE et al. 2014]; SC, South Canyon; LM: large meander. Orange and yellow solid lines are 2D seismic survey lines. (b) Fault pattern of the outer Messina Strait reconstructed based on the selected seismic profiles. The DSS is the surface expression of fault SF21. Light blue dashed curves circle out the source area proposed by BILLI et al. [2008] for the 1908 Messina tsunami. See text for details. ... 91 Figure MII- 3 (a) Sediment echo sounder data interpretation of profile P234. Red arrows indicate the surface expressions
of major faults. Vertical exaggeration is 6. (b) Uninterpreted and (c) interpreted seismic sections of P234. Faults in pink are major surface faults. Faults in brown are minor surface faults. The dashed lines show the uncertain lower parts of the major surface faults. Colored solid lines show the picked horizons. TWT, Two-Way-Travel-Time. Vertical exaggeration is 6. See Fig. MII-2 for location of profile. ... 93 Figure MII- 4 (a) Sediment echo sounder data interpretation of profile P807. Red arrows indicate the surface expressions
of major faults. Vertical exaggeration is 6. (b) Uninterpreted and (c) interpreted seismic sections of P807. Faults in pink are major surface faults. Faults in brown are minor surface faults. The dashed lines show the uncertain lower parts of the major surface faults. Colored solid lines show the picked horizons. TWT, Two-Way-Travel-Time. Vertical exaggeration is 6. See Fig. MII-2 for location of profile. ... 94 Figure MII- 5 (a) Sediment echo sounder data interpretation of profile P242. Red arrows indicate the surface expressions
of major faults. Vertical exaggeration is 6. (b) Uninterpreted and (c) interpreted seismic sections of P242. Faults in pink are major surface faults. Faults in brown are minor surface faults. The dashed lines show the uncertain lower parts of the major surface faults. Colored solid lines show the picked horizons. TWT, Two-Way-Travel-Time. Vertical exaggeration is 6. See Fig. MII-2 for location of profile. ... 95
Page | 13 Figure MII- 6 Fiumefreddo - Melito di Porto Salvo Fault Zone (F-MPS_FZ) in the regional tectonic framework of the outer
Messina Strait. See figure 1a for location of map. Modified from GOVERS and WORTEL [2005]; ARGNANI and BONAZZI
[2005]; GUARNIERI [2006]; CATALANO et al. [2008]; ARGNANI et al. [2009a]; [POLONIA et al. 2011b; POLONIA et al.
2014]; VITI et al. [2011b]; DOGLIONI et al. [2012]; GALLAIS et al. [2013]. TL, Taormina Line; WF, Western Ionian Fault; EF, Eastern Ionian Fault; TF, Taormina fault; RCF, Reggio Calabria fault; SF, Scilla faults; SEF, S. Eufemia fault; ARF, Armo fault; SCF, Southern Calabria fault; FA, fault identified by Argnani; MSF, Messina Straits fault;
ME, Malta Escarpment. The green and blue lines show the location of Subduction-Transform Edge Propagator (STEP) faults. Dashed lines are inferred fault locations. (b) Pull-apart basin and (c) fault-termination basin style models for the patterns of the “H” faulting system in the outer Messina Strait. PDZ, principle displacement zone. See text for details. ... 99
Figure MIII- 1 (a) Bathymetry of the Messina Strait and proposed source models for the 1908 Messina earthquake and tsunami. Modified after BILLI et al. [2008]; FAVALLI et al. [2009a]; PINO et al. [2009b]; POLONIA et al. [2011b];
GALLAIS et al. [2013]. The coloured straight lines together with the black rectangles show the possible seismogenic faults of the 1908 Messina earthquake. The coloured straight lines indicate the intersections of the proposed fault planes and the earth surface (cut-off lines). The black rectangular represent the surface projections of the fault planes.
The dashed segments of the fault planes show the uncertain parts of those faults. The straight lines connected to the ellipses indicate the moving directions of landslides. The blue bars perpendicular to the frame of the figure represent the observed run-up heights of the 1908 Messina tsunami in some cities. The numbers beside these bars are the values of the run-up heights in metres. The red box marks the research area of this study and the range of Fig. MIII-2. DSS, dominate scarp-like structure. (b) Overall tectonic evolution of the central Mediterranean Sea (Southern Italy).
Modified after NERI et al. [2009]. (c) Present tectonic setting of Southern Italy. Please see the LEGEND to know the meanings of the symbols used in the figure. ... 106 Figure MIII- 2 Horizontal distributions of the newly-discovered Fiumefreddo - Melito di Porto Salvo Fault Zone in the
outer Messina Strait. SCC, South Calabria Canyon [RIDENTE et al. 2014]; SC, South Canyon. Pink lines show the faults. Light blue dashed closed curves show the source area proposed by BILLI et al. [2008] for the 1908 Messina tsunami. Yellow lines mark the locations of the selected seismic profiles, P807 and P242. See Fig. MIII-1a for location of map. ... 111 Figure MIII- 3 (a) Uninterpreted and (b) interpreted seismic sections of profile P807. Faults in brown are minor surface
faults; faults in other colours are the major surface faults. The dashed lines show the uncertain lower parts of the faults.
Solid coloured horizontal lines show the picked horizons. TWT, Two-Way Travel Time. The vertical exaggeration is 6. See Fig. MIII-2 for location of the profile. ... 112 Figure MIII- 4 (a) Uninterpreted and (b) interpreted seismic sections of profile P242. Faults in brown are minor surface
faults; faults in other colours are the major surface faults. The dashed lines show the uncertain lower parts of the faults.
Solid coloured horizontal lines show the picked horizons. TWT, Two-Way Travel Time. The vertical exaggeration is 6. See Fig. MIII-2 for location of the profile. ... 113 Figure MIII- 5 Reconstructions of fault activities of the F-MPS_FZ, based on profile P807 that runs across the central part
of the F-MPS_FZ. Stage 1. See Fig. MIII-2 for the location of the profile. F807-1, F807-2, and F807-3 are minor
Page | 14 surface faults on the section P807. From the acoustic basement to sequence 9, no water column is included, as the water column has already been decompacted when reconstructing the sequence 9 from the present phase. We set the depth to 0, as we do not have any evidences for the paleo-water depths at the time of the sequences’ deposition. .. 115 Figure MIII- 6 Reconstructions of fault activities of the F-MPS_FZ, based on profile P242 that runs across the western part
of the F-MPS_FZ. Stage 1. See Fig. MIII-2 for the location of the profile. F242-1 and F242-2 are minor surface faults on the section P242. From the acoustic basement to sequence 9, no water column is included, as the water column has already been decompacted when reconstructing the sequence 9 from the present phase. We set the depth to 0, as do not have any evidence for the paleo-water depths at the time of the sequences’ deposition. ... 118 Figure MIII- 7 Results of tsunami simulations for four scenarios with slips of 2 m (a), 5 m (b), 10 m (c) and 15 m (d) and
comparisons with observed wave heights. The red and blue contours represent the uplift and subsidence due to the tectonic source, respectively. The colour maps show the distribution of maximum tsunami amplitudes due to each source scenario. The parameter K shows the quality of fit between observations and simulations according to Equ. (1).
... 123 Figure MIII- 8 Tsunami travel times in minutes for scenario (d) shown in Fig. MIII-7. The contours are in minutes and
show the arrivals of first tsunami waves. The side plots compare the observed arrival times with the first noticeable peak (with amplitude > 0.5 m) in simulations. The right panel shows some of the simulated waveforms. The parameter K shows the quality of fit between observations and simulations according to Equ. (1). ... 124
Figure A1 Sketch of the tectonic evolution of the central-western Mediterranean, based on GOES et al. [2004], with the reconstruction of subducted plate geometry. Bold lines mark the reconstructed paleogeography from 35 Ma to present, relative to a fixed Europe. For reference, dotted lines show present-day geography in all panels. The dipping part of the slab is shaded in dark gray, the part that lies flat above 660 km in light gray. A gap (in white) develops in this slab after 15–10 Ma, starting just south of Sardinia. The bold gray line indicates the approximate location of the trench axis (not the deformation front). Extension in the Sicily Channel started around 5–6 Ma... 134 Figure A2 [Left] Principal axes of the horizontal strain rate tensor (in blue) and associated 1 sigma errors (red bars). [Right]
The orientation of uniform faulting that can accommodate the strain rate field shown in the left figure. Red lines are faults with a left-lateral component; blue lines are faults with a right-lateral component. Line lengths are equal to the magnitude of the difference between the principal strain rates. Taken from D'AGOSTINO and SELVAGGI [2004]. .... 135 Figure A3 Geodetic strain rate field of Southern Italy computed over a regular 0.2°×0.2° grid. Taken from SERPELLONI et
al. [2010]. [Left] Red and blue arrows show extensional and compressional strain rates, respectively. Grey crosses display 1σ uncertainties. [Right] Rotation rates and 1σ uncertainties (grey wedges). Red wedges show clockwise rotations, whereas blue wedges show counter-clockwise rotations. Grey arrows in both panels show GPS velocities with respect to the Nubian plate. ... 135
Page | 15
TABLE OF TABLES
Table MI- 1 Fault geometries in the inner Messina Strait. See locations in Fig. MI-7b. na, north azimuth; rhr, right hand
rule; aada, average apparent dip angle; dd, dip direction; E. S. P., Equal-area stereo-graphic plots of the fault planes (strike, dip (rhr)). ... 72
Table MII- 1 Fault geometries in the outer Messina Strait. ... 96
Table MIII- 1 Fault geometries of the major surface faults in the newly-discovered Fiumefreddo - Melito di Porto Salvo
Fault Zone in the outer Messina Strait. Details are given in Fu et al. (this thesis) (chapter 5 4.2). ... 114 Table MIII- 2 Reconstructed amounts of the apparent displacements of the faults in the outer Messina Strait at the end of
the formation of each sequence. Negative and positive signs indicate the normal and the reverse slip components, respectively. ... 120
Page | 16
TABLE OF CONTENTS
ABSTRACT ... 4
ZUSAMMENFASSUNG ... 6
DEDICATIONS ... 9
TABLE OF FIGURES...10
TABLE OF TABLES ...15
TABLE OF CONTENTS ...16
OUTLINE OF THE DISSERTATION ...18
1 INTRODUCTION ...20
1.1 MOTIVATION ... 20
1.2INTRODUCTION TO THE STRAIT OF MESSINA (STRETTO DI MESSINA) ... 23
1.2.1 Hydrology ... 24
1.2.2 Tectonic Settings of the Messina Strait ... 28
1.2.3 Turbidity Currents in the Messina Strait... 36
1.3PREVIOUS RESEARCH ON ACTIVE TECTONIC STRUCTURES IN THE MESSINA STRAIT ... 37
1.4PREVIOUS RESEARCH ON THE SOURCE OF THE 1908MESSINA EARTHQUAKE AND TSUNAMI ... 38
1.4.1 Possible Source Models for the 1908 Messina Earthquake ... 39
1.4.2 Possible Sources for the 1908 Messina Tsunami ... 40
2 OBJECTIVES ...42
3 DATA AND METHODOLOGY ...43
3.1ACQUISITION AND PROCESSING OF SEISMIC AND HYDRO-ACOUSTIC DATA... 43
3.1.1 Bathymetric Multi-Beam Echo Sounding Data ... 44
3.1.2 Sediment Echo Sounding Data ... 44
3.1.3 High-Resolution 2D Reflection Seismic Data ... 45
3.1.4 Special Processing of the Hydro-Acoustic Data ... 46
3.2METHODS FOR DATA INTERPRETATIONS... 50
3.3CROSS-SECTION RESTORATION ... 51
3.4NUMERICAL TSUNAMI MODELING ... 52
4 MANUSCRIPT I ...53
ABSTRACT ... 54
1INTRODUCTION ... 55
2 TECTONIC SETTING... 59
3DATA AND METHOD ... 61
4RESULTS ... 63
4.1 Multi-beam swath bathymetry ... 63
4.2 High-resolution 2D multi-channel seismic data ... 65
5DISCUSSION ... 76
5.1 General seafloor morphology of the Messina Strait ... 76
5.2 Characterization of tectonic features and their structural relevance to the tectonic framework of the Messina Strait ... 77
Page | 17
5.3 The graben structure of the Messina Strait ... 79
5.4 The Taormina Fault ... 79
6CONCLUSIONS ... 81
5 MANUSCRIPT II ...82
ABSTRACT ... 83
1INTRODUCTION ... 84
2TECTONIC SETTINGS ... 87
2.1 The inner Calabrian Arc and the Siculo-Calabrian Rift Zone ... 87
2.2 The STEP faults ... 88
3DATA AND METHOD ... 90
4RESULTS ... 91
4.1 Seafloor morphology ... 91
4.2 Fault pattern in the outer Messina Strait ... 93
5DISCUSSION ... 98
5.1 The characteristics of the Fiumefreddo - Melito di Porto Salvo Fault Zone (F-MPS_FZ) in the outer Messina Strait ... 98
5.2 How do the newly-discovered Fiumefreddo - Melito di Porto Salvo Fault Zone (F-MPS_FZ) in the outer Messina Strait fit to the regional tectonic framework? ... 99
6CONCLUSIONS ... 103
6 MANUSCRIPT III ... 104
ABSTRACT ... 105
1INTRODUCTION ... 106
2TECTONIC SETTINGS ... 108
3DATA AND METHOD ... 109
4RESULTS ... 111
4.1 Fault pattern in the outer Messina Strait ... 111
4.2 Reconstructions of fault activities in the outer Messina Strait ... 115
4.3 Numerical modelling of tsunami ... 122
5DISCUSSION ... 125
5.1 Quality of the fault reconstruction ... 125
5.2 Evolution of the newly-discovered Fiumefreddo - Melito di Porto Salvo Fault Zone in the outer Messina Strait 125 5.3 Implications from tsunami modelling ... 126
5.4 Do submarine landslides tsunami triggers exist in the outer Messina Strait?... 127
6CONCLUSIONS ... 129
7 FINAL CONCLUSIONS AND OUTLOOK... 130
7.1CONCLUSIONS ... 130
7.2OUTLOOK ... 133
APPENDIXES ... 134
BIBLIOGRAPHY ... 136
ACKNOWLEDGEMENTS ... 147
CURRICULUM VITAE ... 149
Page | 18
OUTLINE OF THE DISSERTATION
Chapter 1 introduces the survey area – the Messina Strait. General information on the geographic and tectonic characteristics of the Strait are presented. Previous research on the tectonics and submarine hazards of the Messina Strait are also included.
Chapter 2 presents the objectives of this thesis.
Chapter 3 summarizes the used data and methodology. It briefly introduces the parameters used during acoustic data acquisition and interpretation. Methods and parameters of cross-section restoration and numerical tsunami modelling are also presented.
Chapter 4 Manuscript I
Assessing the fault pattern of the inner Messina Strait, Southern Italy, by means of high-resolution 2D reflection seismics
This chapter presents a map of the near-surface fault pattern of the inner Messina Strait based on the new high-resolution 2D reflection seismic data. The general fault pattern is analysed and discussed in the overall tectonic framework of the survey area.
Chapter 5 Manuscript II
An active transtensional fault zone between two STEP faults in the outer Messina Strait, Southern Italy
This chapter focusses on a newly-discovered near-surface fault zone in the outer Messina Strait, namely the Fiumefreddo - Melito di Porto Salvo Fault Zone (F-MPS_FZ). This fault zone is interpreted as a transtensional fault zone connecting two Subduction-Transform Edge Propagator (STEP) faults in the outer Messina Strait. When analysing the relationship between the new fault zone and the regional tectonic framework of the outer Strait, two models for this new fault zone will be discussed: the pull- apart basin style and the fault-termination basin style.
Chapter 6 Manuscript III
Tsunami potential for Southern Italy related to a newly-discovered active fault zone in the outer Messina Strait, based on fault activity reconstructions and tsunami modelling.
Page | 19 The reconstructions of the activity of the newly-discovered Fiumefreddo - Melito di Porto Salvo Fault Zone will be presented in this chapter. Numerical tsunami modelling based on derived fault parameters will also be presented.
Chapter 7 will present some final conclusions and give a short outlook for the work.
Page | 20
1 INTRODUCTION
1.1 Motivation
Submarine hazards, such as earthquakes, submarine slope failures, and resulting tsunamis on the continental margins is a current focus of scientific research. These hazards pose great threats to coastal communities, which are homes to over sixty percent of humankind and locations of most major industrial installations, including increasingly offshore installations. Once these hazards strike the coastline, lives and properties in the coastal areas may experience severe damage. The 1908 Messina earthquake and tsunami is a typical event of this kind.
Page | 21 Figure 1 (a) Source models for the 1908 Messina earthquake and tsunami. Modified after BILLI et al. [2008]; FAVALLI et al.
[2009a]; PINO et al. [2009b]. DSS, dominated scarp-like structure. The stars are epicentres proposed for the earthquake.
The coloured straight lines together with the black rectangles show the possible seismogenic faults of the earthquake. The coloured straight lines indicate the intersections of the fault planes and the earth surface (cut-off lines). The black rectangles represent the surface projections of the fault planes. The dashed segments of the fault planes show the uncertain parts of those faults. The straight lines connected to the ellipses indicate the moving directions of landslides. The blue bars perpendicular to the frame of the figure represent the tsunami run-up heights of some cities. The numbers beside these bars are the values of the run-up heights in metres. (b) Overview of the Messina Strait. MS, Messina Strait.
Page | 22 On December 28th, 1908, a devastating earthquake, Mw=7.1 [PINO et al. 2000; CPTIWORKINGGROUP. 2004], occurred in the Messina Strait (Fig. 1). Many cities located in the coastal areas of the Strait were badly destroyed, especially Messina and Reggio di Calabria (Fig. 1a). The earthquake was accompanied by a tsunami [PLATANIA 1909] (Fig. 1a). About 80,000 [BARATTA 1910] to 100,000 [MERCALLI 1909]
people were killed, making the event the deadliest one in Europe since then.
Intensive investigations have been carried out by many researchers [OMORI 1910; DENATALE and PINGUE 1991; ANZIDEI et al. 1998; AMORUSO et al. 2002a; GERARDI et al. 2008; GUARNIERI and PIRROTTA 2008; ARGNANI et al. 2009a], based on various data sets, such as seismological data, geodetic measurement data (levelling surveys and GPS velocity analyses), tide gauge data, data from geological surveys, and macroseismic observations including P-wave polarities [BOTTARI et al. 1989b; DENATALE
and PINGUE 1991; TORTORICI et al. 1995; ANZIDEI et al. 1998; MONACO and TORTORICI 2000a], as well as the tsunami run-up heights (Fig. 1a) and arrival times [TINTI et al. 1999a; BILLI et al. 2008].
So far, various seismogenic fault models have been proposed for the 1908 Messina event. They vary from a central position in the Strait to the coasts, dipping toward the west or east to southeast (Fig. 1a).
Although a NNW-SSE-trending, E-dipping normal fault, which is located in the northern central part of the Strait, was approved to be the seismogenic fault by many authors, no general agreement has been archived on the seismogenic fault of the 1908 Messina earthquake [AMORUSO et al. 2002b; TINTI and ARMIGLIATO 2003b; ARGNANI et al. 2009a].
The 1908 Messina tsunami occurred following the earthquake hit the entire coastline of the Messina Strait. Field surveys were conducted immediately after the event. The records in the harbour of Naples showed that this tsunami has been the largest one ever recorded in Italy in historical time, both in terms of run-up height (>10 m) [PLATANIA 1909] (Fig. 1a) and impacted area. The run-up heights in the southern part of the Messina Strait (5 - 10 m) were significantly higher than those in the north (1 - 3 m) (Fig. 1a). The extreme values exceed 11 m (Fig. 1a).
Since the 1908 Messina tsunami was assumed to be triggered by seismic activity, tsunami modellers [TINTI et al. 1999b; TINTI and ARMIGLIATO 2003a; FAVALLI et al. 2009b] constructed numerical models on some most common fault solutions, but no one came up with a consistent explanation for both earthquake and tsunami [TINTI et al. 1999b; GERARDI et al. 2008]. Hence, BILLI et al. [2008] postulated that the 1908 Messina tsunami was caused by a submarine landslide. They used triangulation methods to determine a possible source area, which is located in the western Ionian Basin, offshore to the southwest of the southwestern tip of Calabria and to the east of Giardini Naxos city (Sicily) (Fig. 1a).
Page | 23 However, several authors [ARGNANI et al. 2009b; GROSS et al. 2014] doubt the interpretation of BILLI
et al. [2008] , as no ~100 yr old landslide deposits can be identified on high-resolution bathymetric and seismic data in this area. Additionally, modelling results presented by GERARDI et al. [2008] conflict with the landslide-generated tsunami hypothesis. The length of the inundated coast seems to be the key factor in discriminating the tsunami source. Tsunamis caused by dislocation propagated over a wider area with respect to those caused by submarine landslides [TINTI et al. 2007].
What are the main reasons for the existence of these disputes? The unclear neo-tectonic setting of the Messina Strait is probably the most important aspect. This shortcoming is mainly based on the lack of high-resolution and high-quality seismic data, leading to an insufficient and biased knowledge on the tectonics of the Messina Strait. Hence, the main objective of this thesis is to map and analyse neo- tectonic features in the Messina Strait based on a newly-collected high-resolution acoustic and seismic data set. Special emphasis will be drawn on the general fault patterns, its relationship to the overall tectonic setting of Southern Italy, and the tsunami hazard related to selected fault patterns.
1.2 Introduction to the Strait of Messina (Stretto Di Messina)
The Messina Strait is a NNE-SSW striking channel, located in the central Mediterranean Sea (Fig. 1), between latitude 37°40’N to 38°20’N and longitude 15°20’E to 15°50’E. It separates the Italian Peninsula (Calabria) (east) and Sicily (west) and links the Tyrrhenian Sea (north) and the Ionian Sea (south) (Fig. 1). The Strait is a fan-shaped channel (Fig. 1). It is ~40 km long, ~3 km wide in the north, and ~16 km wide in the south.
Page | 24
1.2.1 Hydrology
1.2.1.2 Tide and current
Figure 2 Distribution of tidal height, amplitude and phase, and the tidal current speed through the Messina Strait. Computed by DEFANT [1940].
The Messina Strait is characterised by irregular hydrodynamic conditions. Tyrrhenian and Ionian tides are practically opposite in phase, so that sea level oscillations are almost null in the Strait, while currents are very high (Fig. 2). On the sill, currents as high as 2.00 m/s were measured. From the harmonic analysis, the K1 (Lunar diurnal constituent) and M2 (Principal lunar semidiurnal constituent) components turned out to be the most significant. The former ranged roughly between 0.10 and 0.35 m/s, the latter between 0.40 and 1.40 m/s. Direction of such velocities varied slightly with depth and location, but was predominantly aligned with the Strait’s axis.
Page | 25 Figure 3 Schematic representation of the longitudinal distribution of currents at the sill of the Messina Strait, during a tidal period, from DEFANT [1940]. Water mass in green is the Levantine Intermediate Water. Water mass in orange is the Tyrrhenian Surface Water.
Page | 26 Two water masses, the Tyrrhenian Surface Water and the colder and saltier Levantine Intermediate Water, encounter at the sill in the narrowest part of the Strait (Fig. 3). During the maximum tidal flow, the heavier Levantine Intermediate Water crosses the sill from the Ionian Sea to the Tyrrhenian Sea (3h to 5h in Fig. 3). The pycnocline is thus lifted at the sill and then depressed north of the sill. The depression generates a southward and a northward propagating bore. The northward propagating bore keeps propagating in the Tyrrhenian Sea; the southward bore is stopped by the sill. When the semi- diurnal tide reverses to the maximum tidal flow from the Tyrrhenian Sea to the Ionia Sea, the southward propagating bore undergoes a hydraulic jump over the sill and into the south of the sill and propagates away from the sill [CASAGRANDE et al. 2009] (7h to 9h in Fig. 3).
The wind causes both strong drift currents at the surface and upwelling of the waters from the Ionian Sea or from the Tyrrhenian Sea [SANTORO et al. 2002]. Moreover, the presence and the variable width of the sill result in a nonhomogeneous hydrodynamic regime along the Strait’s axis in terms of current strength and direction [SANTORO et al. 2002].
Page | 27 1.2.1.3 Internal wave
Figure 4 SAR image for the Internal Wave in the Messina Strait. Data from RADARSAT1 satellite with a clear internal solitary waves train signature seen on 21 October 2006, 16:48 UTC. Taken from CASAGRANDE et al. [2009].
Strong barotropic tidal flow, steep bathymetry, and stable stratified environment are the three required ingredients for internal wave generation [ZEILON 1912]. In the Messina Strait, when the southward propagating bore (chapter 1.2.1.3), propagates away from the sill, its leading edge will be steepen, because of the nonlinear effects, until disintegrating into a “train” of interfacial nonlinear short internal waves (Fig. 4), due to frequency and amplitude dispersions [WARN-VARNAS et al. 2007]. A well pronounced wave train may consists of 4 - 10 internal solitary waves with periods of 8 to 30 min.
Propagation speed of the internal waves varies between 0.80 and 1.15 m/s [ALPERS and SALUSTI 1983;
CASAGRANDE et al. 2010].
Page | 28
1.2.2 Tectonic Settings of the Messina Strait
1.2.2.1 Evolution of the African-Eurasian plate convergence zone over the last 35 Ma
Figure 5 Evolution of the African-Eurasian plate convergence zone over the last 35 Ma. Image was taken and modified from FACCENNA et al. [2004] and FACCENNA et al. [2001].
Page | 29 The evolution of the African-Eurasian plate boundary zone can be dated back to 35 Ma to the Late Oligocene [GUEGUEN et al. 1998; FACCENNA et al. 2001; FACCENNA et al. 2003; FACCENNA et al. 2004;
GOES et al. 2004; GUARNIERI and PIRROTTA 2008] (Fig. 5a). Since then, the western Mediterranean Sea progressively opened from its initial location at the Ibero-European margin toward the southeast as a result of the trench retreat and slab roll-back [GUEGUEN et al. 1998; FACCENNA et al. 2001; FACCENNA
et al. 2003; FACCENNA et al. 2004; GOES et al. 2004]. The trench retreat and slab roll-back process was probably initiated by a gravitational pull of the subducted slab [GOES et al. 2004], which was generated by an adequate amount of lithospheric material subducted at the Ibero-European margin since ~80 Ma [GUEGUEN et al. 1998; FACCENNA et al. 2001]. As a result, a system of slow African-Europe convergence, and fast subduction was developed [GUEGUEN et al. 1998; GOES et al. 2004].
During the southeastward trench retreat and slab roll-back, the overriding plate was lengthened, accompanied by strong extensional forces [GOES et al. 2004], leading to the opening of the Liguro- Provencal and the Tyrrhenian back-arc basins [FACCENNA et al. 2003]. Oceanic spreading started [GUEGUEN et al. 1998; FACCENNA et al. 2001]. The subducted slab, which was previously characterised by a shallow dip, became continuously steeper with the evolution of the plate boundary zone [FACCENNA
et al. 2001; FACCENNA et al. 2003; FACCENNA et al. 2004].
From ~10 Ma (Late Miocene) onwards, the trench retreat was strongly enhanced (Fig. 5b). With the opening of the Tyrrhenian Sea [MONACO et al. 1996; GOES et al. 2004], the Calabro-Peloritani block, which builds up the present Calabrian Arc, moved away from the Sardinia-Corsica block toward its present position [GUEGUEN et al. 1998; FACCENNA et al. 2001; GOES et al. 2004]. As a part of the overriding plate, compressional and extensional forces already affected the Calabro-Peloritani block [MONACO et al. 1996; GOES et al. 2004].
Between ~5 Ma to ~2 Ma (Pliocene) (Fig. 5c-d), the trench migrated rapidly [GOES et al. 2004]. The thrust process already shifted to the Ionian offshore [MONACO et al. 1996].
Page | 30 1.2.2.2 Recent tectonic reorganization
Figure 6 Sketch of the consequences of the recent tectonic change on the Sicily–Calabrian area. Lines and fills are explained in the legend. Taken from GOES et al. [2004].
During the last phase (1 – 0.5 Ma) of trench migration, tectonics of the south-central Mediterranean changed [GOES et al. 2004] (Fig. 6). To the north of Sicily, Africa–Europe convergence has transferred to a back thrust, in response to the arrival of African continental lithosphere at the trench. When Calabria docked between Apulia and Sicily, Calabrian trench migration and accompanying Tyrrhenian back-arc extension essentially almost stalled. A northeastward divergence between the Ionian section and the rest of the African plate -- manifesting itself as extension in eastern Sicily and the Sicily Channel -- may control the current eastward motions of Calabria and Apulia relative to Africa, now that large roll- back displacements have ceased. Very strong deformation is recorded in the region between Europe, Africa, and Calabria, as plate boundaries are readjusting [GOES et al. 2004].
Page | 31 Figure 7 Overall tectonic setting of the Messina Strait, Southern Italy. The red box in (b) shows the range of (a). Modified from [ARGNANI and BONAZZI 2005; GUARNIERI 2006; CATALANO et al. 2008; ARGNANI et al. 2009a; POLONIA et al. 2011a;
VITI et al. 2011a; DOGLIONI et al. 2012; GALLAIS et al. 2013]. MS, Messina Strait. SL, Sangineto line; TL, Tindari-Letojanni faults/Taormina Line. RIF, Rosolini–Ispica faults; AF, Avola fault; WF, Western Ionian Fault; EF, Eastern Ionian Fault;
ASF, Acireale–S. Alfio faults; PF, Piedimonte fault; TF, Taormina fault; RCF, Reggio Calabria fault; ARF, Armo fault; SF, Scilla faults; SEF, S. Eufemia fault; CF, Cittanova fault; SRF, Serre fault; VF, Vibo fault; CVF, Capo Vaticano fault. SCF, Southern Calabria fault; FA, fault discovered by ARGNANI et al. [2009a]; MSF, Messina Straits fault.
Page | 32 Figure 8 (a) 3D sketch of the Sicilian-Ionian Sea transition zone, where the Etna volcano is emplaced along the dextral transtensional fault due to differential slab roll-back. (b) 2D view from above on the plate boundary zone. The differential trench migration, as well as the measured dips of the subducted slabs is displayed, showing a gentler dip west of the Malta escarpment and a steeper dip east of it. Images from DOGLIONI et al. [2001].
The segment of the plate convergence zone, which is between the Hyblean Plateau (Sicily) and Apulia, moved further southeast compared to the other parts (Figs. 6, 7a, 8). This displacement has been assumed to be a result of a differential plate motion [DOGLIONI et al. 2001; GOES et al. 2004], which is a consequence of the development of a variable dip of the subducted slab caused by a different composition of the subducted lithosphere [DOGLIONI et al. 2001; D'AGOSTINO and SELVAGGI 2004]
(Figs. 6, 7a, 8). This differential plate motion is supposed to be regulated by the Malta Escarpment (Figs. 7a, 8), an old, re-activated and N-S oriented Mesozoic passive margin [DOGLIONI et al. 2001], and by the Tindari-Letojanni faulting system (Fig. 7a), a dextral transtensional zone formed across northeastern Sicily, to accommodate the differential motion between Sicily (Africa) and Calabria (Fig.
7a). Motion along this zone decouples Sicily’s Peloritani corner from the Calabrian block, with which it has migrated across the Tyrrhenian basin (Fig. 7a).
FACCENNA et al. [2001] and GUEGUEN et al. [1998] estimated a total amount of up to ~780 km lengthening/extension of the overriding plate, due to the trench migration in the last 35 Ma. They also calculated an average migration rate of 2.6 cm/a, with a maximum rate exceeding 5.6 cm/a during the last phase of the trench retreat and slab roll-back [FACCENNA et al. 2004].
This young and changing tectonics seems to be associated with diffuse, strongly time-dependent and sometimes devastating seismicity, but details are not well understood due to the lack of the information concerning the comprehensive tectonic framework.
![Figure 12 Frequency adjustment before migration. [Upper] migrated profile with an OBPF low cut frequency of 10/20 Hz before migration](https://thumb-eu.123doks.com/thumbv2/1library_info/5505232.1685913/48.892.198.730.265.818/figure-frequency-adjustment-migration-migrated-profile-frequency-migration.webp)

![Figure MI- 2 Bathymetry (slope gradient) of the inner Messina Strait. MC, Messina Canyon [C OLANTONI 1987]; SCC, South Calabria Canyon [R IDENTE et al](https://thumb-eu.123doks.com/thumbv2/1library_info/5505232.1685913/63.892.106.821.264.828/figure-bathymetry-gradient-messina-strait-messina-olantoni-calabria.webp)
