Histone deacetylase inhibitors for the epigenetic therapy of proximal spinal muscular atrophy
Inaugural-Dissertation zur
Erlangung des Doktorgrades
der Mathematisch-Naturwissenschaftlichen Fakultät der Universität zu Köln
vorgelegt von Lutz Garbes
aus Köln
Köln 2010
Genetics and Centre for Molecular Medicine Cologne (CMMC) of the University of Cologne from November 2006 to 2010.
Berichterstatter/in: Prof. Dr. rer. nat. Brunhilde Wirth Prof. Dr. rer. nat. Thomas Wiehe
Tag der letzten mündlichen Prüfung: 22.11.2010
Für meine Eltern
First, I would like to thank my supervisor Brunhilde Wirth for giving me the opportunity to work on various interesting and challenging projects, for sharing her scientific knowledge and enthusiasm, and for allowing me to work independently. Furthermore, I woud like to thank her for motivating discussions and encouragement, for her generous support to attend scientific meetings, and for bringing me in touch with various scientist all over the world. I greatly appreciate her dedication.
I thank my examiners Prof. Dr. Thomas Wiehe and Prof. Dr. Günter Schwarz.
Of course a big “Thanks!” to all past and present members of the SMA group, and the whole Institute of Human Genetics in Cologne. A very big “extra thank you” to Irmgard Hölker for her excellent technical support during the last years, for countless triplicates and for staying at my side during the VPA odyssey. I thank the Markus Rießland for good advice whenever needed, valuable discussions about science, all the world and his wife and all the interesting news out there. Furthermore, I like to thank Bastian Ackermann and Sandra Kröber for keeping a hilarious atmosphere in our lab and all those funny Fridays. In the end, I salute the navigator for leading the quarterhorse cowboys on the right track.
Moreover, I thank Miriam Jakubik and Ylva Mende for “introducing me to the mice”, and how to put syringes in mice without making kebap. Of course, I thank all the people, who carefully went through this manuscript, for their helpful suggestions and stamina: Markus (the big one), Julia (always positive – I merely bought it), Basti, Sabrina and Markus (the small one). Furthermore, I thank also thank Karin Boß reading the draft, sharing her English skills and donating me some extra commas.
I thank Eric Hahnen helpful discussions (400nM!!) and for bringing me in touch with his buddies in Erlangen and Bonn. I would to thank Ingmar Blümcke and Roland Coras for the NSCs and OHSCs and Christian Tränkle for the HDAC inhibition assay.
I thank Carsten Müller and Tim Bauer for the coffee meetings and their help and patience with the LC-MS/MS. Especially, I think Tim Bauer for his willingness to shorten his weekends for some additional sample measurements. I would like to thank Jürgen-Christoph von Kleist-Retzow for his help with polarography experiments.
I thank my parents for their constant support and motivation, their confidence and everything they taught me. This work wouldn´t have been possible without you!!
Furthermore, I give props to Maurits and Niklas for distraction whenever needed .
Finally, this list wouldn´t be complete without Sabrina Rosenbaum: Thank you for just being you - you are more than beautiful.
Table of contents
LIST OF ABBREVIATIONS ... VI
1. INTRODUCTION ... 1
1.1 AUTOSOMAL RECESSIVE PROXIMAL SPINAL MUSCULAR ATROPHY (SMA) ... 1
1.1.1 Clinical diagnosis ... 1
1.1.2 Classification of proximal SMA ... 3
1.1.2.1 SMA type I (Werdnig-Hoffmann disease), MIM #25330 ... 3
1.1.2.2 SMA type II, MIM #253550 ... 4
1.1.2.3 SMA type III (Kugelberg-Welander disease), MIM #253400 ... 4
1.1.2.4 SMA type IV (adult SMA), MIM #271150 ... 4
1.2 THE MOLECULAR BASIS OF SMA ... 4
1.2.1 SMN1 and SMN2 ... 5
1.2.2 SMN splicing ... 6
1.3 THE SMN PROTEIN... 9
1.3.1 The SMN complex ... 10
1.3.2 Functions of SMN ... 10
1.3.2.1 Housekeeping functions ... 10
1.3.2.2 Neuron-specific functions ... 12
1.3.2.3 Muscle-specific functions ... 13
1.4 ANIMAL MODELS OF SMA ... 13
1.4.1 Non-vertebrate SMA models ... 13
1.4.2 Vertebrate SMA models ... 14
1.5 SMA:WHY DO SPECIFICALLY MOTOR NEURONS DIE? ... 17
1.6 THERAPEUTIC APPROACHES IN SMA ... 18
1.6.1 Epigenetic therapy targeting SMN2 expression ... 19
1.6.1.1 The concept of epigenetic therapy ... 19
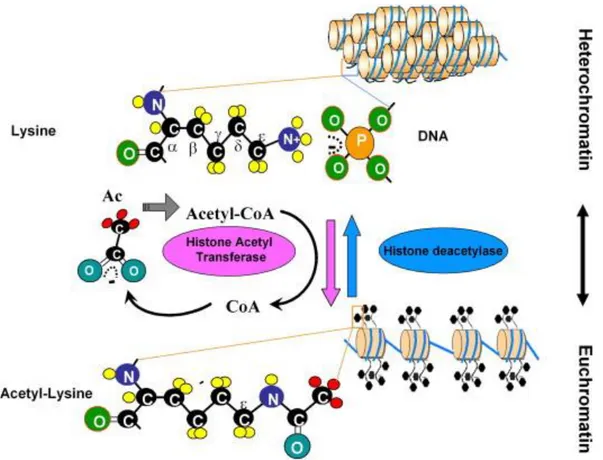
1.6.1.2 Histone Acetyl Transferases (HAT) ... 22
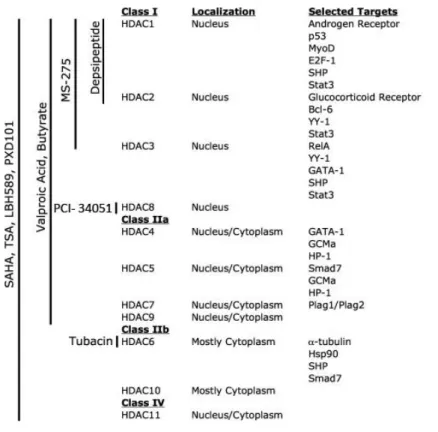
1.6.1.3 Histone Deacetylases (HDAC) ... 23
1.6.1.3.1 Class I HDACs ... 23
1.6.1.3.2 Class II HDACs ... 23
1.6.1.3.3 Class III HDACs (sirtuins) ... 24
1.6.1.3.4 Class IV HDACs ... 24
1.6.1.4 HDAC inhibitors ... 24
1.6.1.5 Epigenetic SMA therapy with HDACi ... 27
1.6.1.6 VPA in SMA therapy ... 27
1.6.2 Further therapies targeting SMN2... 28
1.6.2.1 RNA-based therapy ... 28
1.6.2.2 Gene therapy ... 29
1.6.2.3 Drug therapy ... 29
1.6.3 SMN2-independent therapies ... 30
1.6.3.1 Neurotrophic agents ... 30
1.6.3.2 Stem cell therapy ... 31
2. STUDY AIMS ... 33
3. MATERIAL AND METHODS ... 34
3.1 CELL LINES ... 34
3.2 MOUSE INBRED STRAINS ... 34
3.3 EQUIPMENT AND CHEMICALS ... 36
3.3.1 Equipment ... 36
3.3.2 Chemicals ... 37
3.3.3 Frequently used kits ... 37
3.3.4 Reagents used for molecular biology ... 38
3.3.5 Reagents and supplies for cell culture ... 39
3.3.6 Reagents for HPLC-MS/MS ... 39
3.3.7 Enzymes ... 39
3.3.8 Purchased vectors ... 40
3.4 ANTIBODIES ... 40
3.4.1 Primary antibodies... 40
3.5 SOLUTIONS AND MEDIA ... 41
3.5.1 Media for eukaryotic cell culture ... 41
3.5.2 Frequently used buffers and solutions ... 41
3.5.2.1 Buffers used in combination with the Mini Protean 3 cell... 42
3.5.2.2 Buffers used with Protean II xi cell and Trans Blot electrophoresis cell ... 42
3.6 PRIMERS AND SIRNAS ... 43
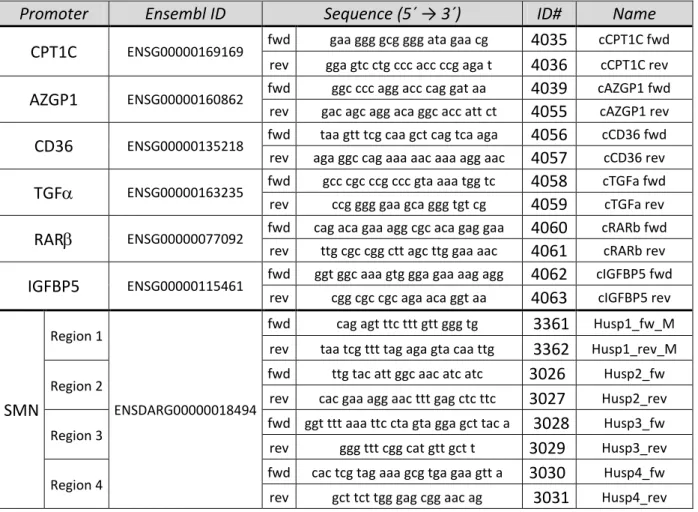
3.6.1 Primers ... 43
3.6.2 siRNAs (small interfering RNAs) ... 47
3.7 SOFTWARE, INTERNET PROGRAMS AND DATABASES ... 47
3.8 CELL CULTURE PROCEDURES ... 48
3.8.1 Cell culture of eukaryotic cells ... 48
3.8.1.1 Treatment of cells with different compounds ... 48
3.8.1.2 Transient transfection of primary human fibroblasts ... 49
3.8.1.3 Cytotoxicity and cellviability assays ... 50
3.8.1.3.1 MTT assay ... 50
3.8.1.3.2 LDH assay ... 51
3.8.2 Immunofluorescent staining of primary human fibroblasts ... 51
3.9 MOLECULAR BIOLOGY METHODS ... 52
3.9.1 Working with DNA ... 52
3.9.1.1 Genomic DNA isolation ... 52
3.9.1.2 Determination of DNA concentration ... 52
3.9.2 Working with RNA ... 52
3.9.2.1 RNA isolation ... 52
3.9.2.1.1 RNA isolation from eukaryotic cells ... 52
3.9.2.1.2 RNA isolation from organ tissues ... 53
3.9.2.2 Determination of RNA concentration ... 53
3.9.2.3 mRNA-stability assay using Actinomycin D ... 53
3.9.2.4 cDNA synthesis ... 53
3.9.3 Polymerase chain reaction (PCR) ... 54
3.9.3.1 Standard PCR ... 54
3.9.3.2 Agarose gel electrophoresis/Gel-Purification of PCR-Products ... 54
3.9.3.3 Quantitative real-time PCR (qRT-PCR) ... 55
3.9.3.3.1 qRT-PCR using the LightCycler 1.5 ... 55
3.9.3.3.2 qRT-PCR using the ABI 7500 Realtime PCR machine ... 55
3.9.4 Sanger-sequencing ... 56
3.9.5 Transcriptome-wide expression analysis using µ-arrays ... 56
3.9.6 Working with bacteria ... 57
3.9.6.1 TOPO TA cloning ... 57
3.9.6.2 Identification of correct clones using colony PCR and sequencing ... 58
3.9.6.3 Maxi-Preparation of plasmids ... 58
3.10 PROTEINBIOCHEMICAL AND IMMUNOLOGICAL METHODS ... 59
3.10.1 Working with proteins ... 59
3.10.1.1 Protein extraction ... 59
3.10.1.1.1 Extraction of proteins from eukaryotic cells ... 59
3.10.1.1.2 Extraction of proteins from organ tissues ... 59
3.10.1.1.3 Determination of protein concentration according to Bradford ... 59
3.10.1.1.4 Determination of protein concentration using BCA ... 59
3.10.1.2 Discontinuous denaturing PAA gel electrophoresis (SDS-PAGE) ... 60
3.10.1.3 Coomassie staining of SDS Gels ... 61
3.10.1.4 Transfer of proteins onto nitrocellulose membranes ... 61
3.10.1.5 Ponceau staining of nitrocellulose membranes ... 61
3.10.1.6 Immunostaining of nitrocellulose-membranes using antibodies ... 61
3.10.2 Precipitation/Purification of proteins and chromatin ... 62
3.10.2.1 Chromatin Immunoprecipitation (ChIP) ... 62
3.10.2.2 Precipitation of ubiquitinylated proteins ... 63
3.10.3 Determination of enzymatic activity ... 63
3.10.3.1 Determintation of proteasomal activity ... 63
3.10.3.2 Inhibition of proteasomal protein degradation by MG-132 ... 64
3.10.3.3 Determination of PKA-activity ... 64
3.10.3.4 Determination of fatty acid uptake via BODIPY-FA ... 66
3.10.4 Enzyme-linked immunosorbent assay (ELISA) ... 66
3.10.4.1 Quantification of intracellular cAMP-content ... 66
3.10.4.2 Quantification of global histone H3 acetylation ... 67
3.10.5 Determination of SMN2 promoter activity ... 68
3.10.6 Mass-spectroscopic determination of intracellular VPA content ... 68
3.10.6.1 Derivatization of VPA/4-en VPA ... 69
3.10.6.2 Determination of intracellular VPA content without derivatization ... 70
3.11 WORKING WITH MICE ... 70
3.11.1 Animal breeding ... 70
3.11.2 Determination of weight progression of mice ... 71
3.11.3 Subcutaneous injection of mice ... 71
3.11.4 Preparation of mouse organs ... 71
4. RESULTS... 72
4.1 SMA THERAPY WITH VPA:WHY DO WE HAVE NON- AND POS-RESPONDERS? ... 73
4.1.1 In vitro treatment of fibroblasts derived from SMA patients and carriers with valproic acid 73 4.1.1.1 Classification of fibroblasts into Non- and Pos-Responder ... 74
4.1.1.2 Generation of an unrelated control group ... 78
4.1.2 Search for the molecular basis of VPA Non-Responders ... 81
4.1.3 Transcriptome-wide comparison of Non- and Pos-Responders ... 84
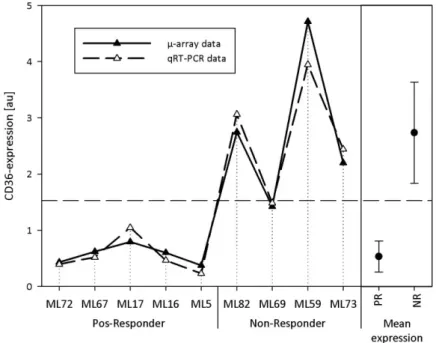
4.1.3.1 Cluster of differentiation 36 (CD36), MIM ID: 173510 ... 87
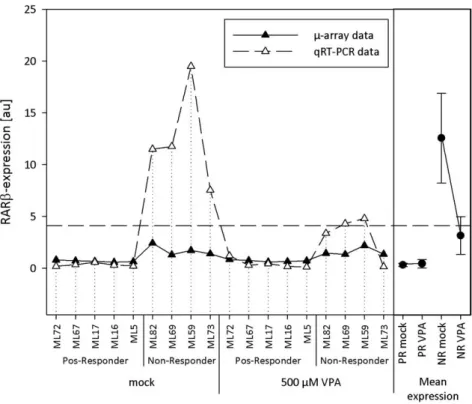
4.1.3.2 Retinoic acid receptor (RAR), MIM ID: 180220 ... 89
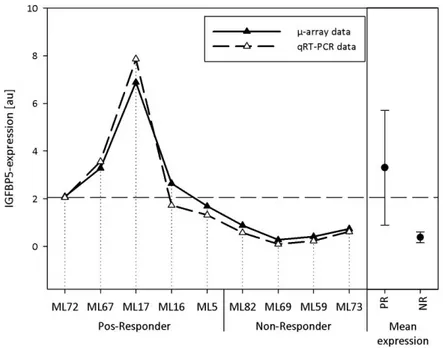
4.1.3.3 Insulin-like growth factor binding protein 5 (IGFBP5), MIM ID: 146734 ... 92
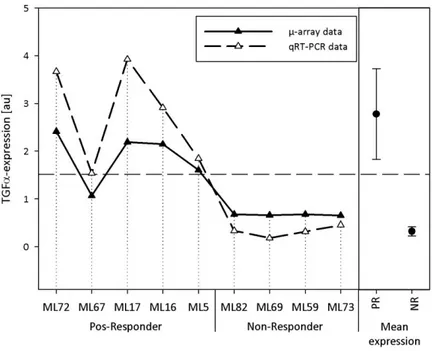
4.1.3.4 Transforming growth factor (TGF), MIM ID: 190170 ... 95
4.1.3.5 Validation of candidate genes on protein level ... 97
4.1.3.6 Confirmation of candidate genes in blood from VPA-treated SMA patients ... 98
4.1.4 Analysis of differences in the expression of candidate genes ... 101
4.1.5 Identification of a putative candidate gene network ... 104
4.1.5.1 Knockdown and overexpression studies ... 105
4.1.5.2 Determination of the intracellular cAMP content ... 109
4.1.5.3 Can a Non-Responder be converted into a Pos-Responder? ... 110
4.1.6 Analysis of CD36 as a putative VPA transporter ... 112
4.1.6.1 Characterization of VPA uptake in treated fibroblasts by HPLC-MS/MS ... 112
4.1.6.2 Analysis of CD36-mediated VPA import... 115
4.1.6.3 Comparison of VPA metabolism in Pos- and Non-Responders ... 117
4.1.6.4 Analysis of general fatty acid transport in Non- and Pos-Responders ... 120
4.2 IDENTIFICATION AND CHARACTERIZATION OF THE PUTATIVE SMA DRUG LBH589 ... 125
4.2.1 Impact of LBH589 on SMN levels in SMA fibroblasts ... 126
4.2.2 Analysis of the impact of LBH589 on gems ... 127
4.2.3 Comparison of the effects of VPA and LBH589 ... 129
4.2.4 Assessment of LBH589 cytotoxicity ... 130
4.2.5 Confirmation of LBH589 potential in other systems ... 131
4.2.6 Impact of LBH589 on SMN2 mRNA levels and the SMN2 promoter ... 134
4.2.6.1 Analysis of SMN2 splicing ... 134
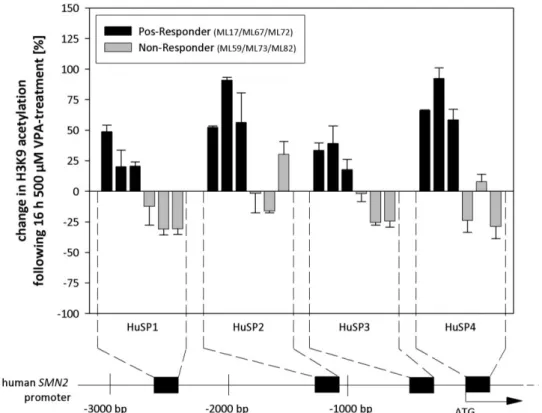
4.2.6.2 Analysis of the SMN2 promoter ... 138
4.2.7 Characterization of LBH589-induced SMN protein increase ... 139
4.2.7.1 Analysis of SMN mRNA turnover in treated fibroblasts ... 140
4.2.7.2 Analysis of SMN protein turnover in treated fibroblasts ... 140
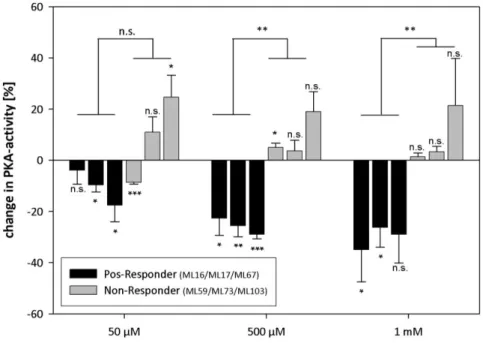
4.2.7.3 Analysis of PKA activity in LBH589-treated fibroblasts ... 143
4.3 IDENTIFICATION OF BORTEZOMIB (VELCADE) AS A PUTATIVE SMA DRUG... 145
4.4 IDENTIFICATION OF JNJ-26481585 AS A POTENTIAL SMA DRUG ... 147
4.5 CHARACTERIZATION OF AN INTERMEDIATE SMA-LIKE MOUSE MODEL ... 152
5. DISCUSSION ... 155
5.1 SMA-THERAPY WITH VPA ... 155
5.1.1 Fibroblasts and blood: Is the response to VPA the same? ... 156
5.1.2 Candidate genes for non-responsiveness to VPA: Network or conincidence? ... 158
5.1.3 VPA treatment of Non-Responders: Resistent against HDACi? ... 162
5.1.4 HPLC-MS/MS: Any differences in VPA uptake or metabolism? ... 164
5.1.5 VPA-therapy: Can a Non-Responder be turned into a Pos-Responder? ... 166
5.1.6 Future aspects: Tackling VPA Non-Responder ... 167
5.2 IDENTIFICATION OF LBH589 AS A POTENTIAL SMA DRUG ... 169
5.2.1 LBH589: A feasible drug to up-regulate SMN? ... 169
5.2.2 SMN2 mRNA: Promoter induction, splicing or both? ... 171
5.2.3 SMN protein: More or less breakdown? ... 173
5.2.4 Future aspects: LBH589, JnJ-26481585 or even Bortezomib? ... 174
6. SUMMARY ... 177
7. ZUSAMMENFASSUNG ... 180
8. PULICATION, LECTURES AND SCHOLARSHIPS ... 183
9. REFERENCES ... 185
10. APPENDIX ... IX
11. ERKLÄRUNG ... XXIX
List of abbreviations
A adenine ACN Acetonitrol amu atomic mass unit approx. approximately
APS ammonium persulfate bp base pair
BODIPY boron-dipyrromethene BSA bovine serum albumin C cytosine
cAMP cyclic-AMP
CD cluster of differentiation cDNA complementary DNA ChIP Chromatin Immunoprecipi-
tation
CK creatine kinase cM centimorgan cm centimeter
CNS central nervous system dA 2´,5-dideoxyadenosin DEPC diethylpyrocarbonate D-MEM Dulbecco’s modified Eagle
medium
DMSO dimethylsulfoxide DNA deoxyribonucleic acid dNTP deoxynucleotriphosphate EC50 half maximal effective
concentration
EDTA ethylenediaminetetraacetic
acid
EGTA ethylene glycol tetraacetic
acid
e.g. exempli gratia EMG electromyography ESE exonic splicing enhancer ESS exonic splicing silencer et al. et alii
FCS fetal calf serum
FDA Food & Drug Administration FITC fluorescein isothiocyanate FL full length
G guanine
g gravitational force h hours
HAT histone acetyltransferase HDAC histone deacetylase HMT histone methyltransferase HPLC High-performance liquid
chromatography IBMX 3-isobutyl-1-methyl-
xanthine
ISS intronic splicing silencer kb kilobases
kDa kilodalton l liter
IC50 half maximal inhibitory concentration
M molar m milli- Mb megabases
MDa megadalton min minutes
MIM Mendelian inheritance in Men
ml milliliter mm millimeter mM millimolar mRNA messenger RNA MS Mass spectrometry NCV nerve conduction velocity n.d. not determined
ng nanogram nm nanometer nM nanomolar nmol nanomol n.s. not significant OA Oleic acid PND postnatal day P probability PAA polyacrylamide
PAGE PAA gel electrophoresis PBS phosphate-buffered saline PCR polymerase chain reaction pH power of hydrogen
PKA cAMP-dependent protein kinase A
RNA ribonucleic acid RNAi RNA interference rpm revolutions per minute RT reverse transcription
SAHA suberoylanilide hydroxamide acid s.c. subcutaneous SD standard deviation SDS sodium dodecyl sulfate SEM standard error of the mean siRNA small interfering RNA SNP single nucleotide poly-
morphism
SMA autosomal recessive spinal muscular atrophy
SMN survival motor neuron SSO sulfo-N-succinimidyl ester T thymidine
TEA Triethylamine
TEMED N,N,N’,N’-tetramethylethy- lenediamine
UV ultraviolet VPA valproic acid μ micro-
μg microgram
μl microliter μM micromolar μm micrometer
1. Introduction
A wide spectrum of diseases primarly affecting the motor neurons has been described in humanes. Among these, the spinal muscular atrophies represent a large group. Common to all of them is the progressive loss of lower motor neurons in the spinal cord, leading to a preferential denervation of the voluntary muscles. Hence, main symptoms are muscle weakness and atrophy, which can be present either proximally or distally as well symmetrically or asymmetrically. Moreover, the individual mode of inheritance ranges from sporadic cases to X-linked as well as recessive or dominant forms. The most common spinal muscular atrophy is autosomal proximal spinal muscular atrophy, which will therefore simply be termed SMA in the following. Other well-described spinal muscular atrophies include X- linked SMA (XL-SMA), spinal and bulbar muscular atrophy (Kennedy´s disease) and spinal muscular atrophy with respiratory distress (SMARD).
1.1 Autosomal recessive proximal spinal muscular atrophy (SMA)
In the Western European population, SMA is the second most frequent autosomal recessive disorder in humans after cystic fibrosis. Nowadays, it is the leading genetic cause of early infant death. The incidence of SMA is 1 in 10,000 to 1 in 6,000 live births in Western Europe (Emery 1991; Pearn 1978). In Germany. the carrier frequency has been estimated to be between 1:25 to 1:35 (Anhuf et al. 2003; Emery 1991; Feldkotter et al. 2002; Pearn 1978).
SMA is caused by the progressive degeneration of -motor neurons in the anterior horns of the spinal cord. This leads to a steadily increasing hypotonia and weakness of the voluntary muscles, ultimately resulting in their atrophy. Typically, muscle weakness occurs first in the voluntary muscles of proximal limbs. While the atrophy is more pronounced in the lower extremities, hands and feet are usually spared in the early stages of SMA (Markowitz et al.
2004). Further symptoms include a weak cough and cry, difficulties to suck and swallow, bladder weakness, tremor of the hands, areflexia and an increased susceptibility to respiratory tract infections (Rudnik-Schoneborn et al. 1994). In contrast, facial and oculomotor nerves are typically unaffected and also cognitive skills are not impaired.
1.1.1 Clinical diagnosis
The classical main diagnostic tool for SMA diagnosis is recording of electric pulses controlling voluntary muscle movement by electromyography (EMG). These pulses originate in the motor cortex and are transmitted by the motor neurons to the respective muscles.
EMG technique allows determining of both transmission current and velocity. In SMA patients, EMG demonstrates spontaneous muscle activity with fibrillations and fasciculations of single muscle fibers as well as an increased mean duration and amplitude of action potentials. Nerve conduction velocity (NCV) is normal or mildly reduced, while the number
of motor units decreases during disease progression (Swoboda et al. 2005; Zerres and Davies 1999).
The progess made in molecular diagnostics dramatically improved SMA diagnosis.
15 years ago the SMA determining gene, termed survival of motor neuron 1 (SMN1), was identified on chromosome 5q (Lefebvre et al. 1995). Its identification allowed confirmation of clinical SMA diagnosis by screening the SMN1 gene for specific mutations, deletions or gene conversions. This eventually led to the modification of the originally forwarded diagnostic criteria from the International SMA Consortium in 1992 (Munsat and Davies 1992) by Zerres and Davies (Zerres and Davies 1999).
In order to distinguish SMA from other motor neuron diseases, exclusion criteria such as CNS dysfunction or arthrogryposis have been defined (Munsat and Davies 1992).
Furthermore, serum levels of creatine kinase (CK) can be used to rule out SMA in unclear cases. CK levels are a common clinical marker for muscle membrane permeability. Typical serum levels are around 140 to 170 U/l, but can moderately be elevated by a variety of neuromuscular disorders, after external injury or even after excessive physical activity.
However, highly increased CK levels (>10 fold) are a feature of conditions that cause severe muscle damage like myocardial infarction or Duchenne Muscular Dystrophy (DMD). In contrast to that, few mildly-affected SMA patients exhibit modestly increased serum levels (Rudnik-Schoneborn et al. 1998). In very rare cases, SMA was found to be accompanied by arthrogryposis, CNS dysfunction, increased CK levels or congenital heart defects. However, the question remains open whether these “SMA plus” cases are coincidental or indeed associated (Guillot et al. 2008; Rudnik-Schöneborn et al. 1996; Rudnik-Schoneborn et al.
2008).
In the past, clinical diagnosis has further been corroborated by histological inspection of a muscle biopsy. Muscles contain two types of fibers: Reddish type I fibers using triglycerides as storage fuel and white type II fibers, which generate energy from glycogen. While type I fibers are suited for endurance, type II fibers are effective for short bursts of muscle contraction. In contrast to healthy individuals, SMA patients exhibit groups of both atrophic type I and II fibers as well as hypertrophic type I fibers. Typically, muscle spindles are not affected (Lunn and Wang 2008) and myopathic features such as necrosis and lipid accumulation are absent with the exclusion of long-standing SMA patients (Munsat and Davies 1992).
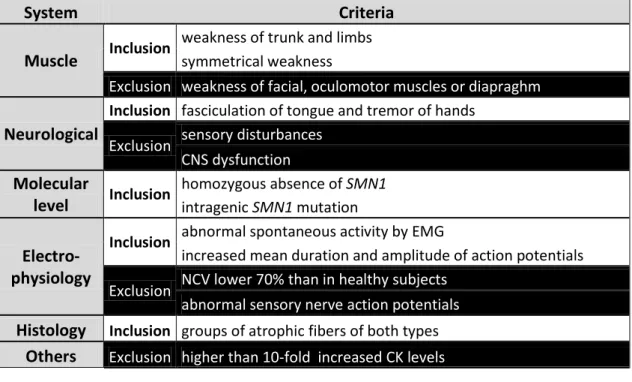
A summary of the most commonly used inclusion and exclusion critera for SMA is given in Table 1. Based on these guidelines, a diagnostic algorithm has been proposed which combines all the above described diagnostic criteria (Lunn and Wang 2008).
System Criteria Muscle Inclusion
weakness of trunk and limbs symmetrical weakness
Exclusion weakness of facial, oculomotor muscles or diapraghm Neurological
Inclusion fasciculation of tongue and tremor of hands
Exclusion sensory disturbances CNS dysfunction Molecular
level Inclusion
homozygous absence of SMN1 intragenic SMN1 mutation
Electro- physiology
Inclusion abnormal spontaneous activity by EMG
increased mean duration and amplitude of action potentials
Exclusion NCV lower 70% than in healthy subjects abnormal sensory nerve action potentials Histology Inclusion groups of atrophic fibers of both types
Others Exclusion higher than 10-fold increased CK levels
Table 1 Inclusion and exclusion criteria for the diagnosis of SMA (Zerres and Davies 1999).
1.1.2 Classification of proximal SMA
The phenotype of proximal SMA is highly variable. It ranges from the prenatal appearance of symptoms to first manifestations occuring during adulthood in the mildest forms. The severest form of SMA was first described more than 100 years ago by the Austrian neurologist Guido Werdnig (Werdnig 1891), whereas milder forms were reported for the first time in the 1950´s (Kugelberg and Welander 1956). Nowadays, SMA is classified into four types (type I-IV) based on the age of onset and disease severity (Munsat and Davies 1992; Zerres and Rudnik-Schoneborn 1995).
1.1.2.1 SMA type I (Werdnig-Hoffmann disease), MIM #25330
Werdnig-Hoffmann disease is the most common form of SMA and accounts for about 50% of SMA cases (Markowitz et al. 2004). It is the most severe form and is often referred to as SMA type I or acute SMA. Onset of the disease is typically before the age of six months - in very rare cases already in the third trimester of pregnancy - and death occurs within the first two years of life (Cobben et al. 2008; Fidzianska and Rafalowska 2002; Markowitz et al.
2004). Mean survival has been estimated to be approx. seven months (Rudnik-Schoneborn et al. 2009). SMA type I children suffer from generalized muscle weakness, hypotonia and are never able to sit unassisted (“floppy infants”). Furthermore, patients exhibit symmetrical paralysis and cannot control head movement. Bulbar denervation results in characteristic fasciculation of the tongue thus leading to problems with sucking and swallowing. Due to a spared diaphragm and weakened intercostals muscles, the chest is typically deformed and bell-shaped. In severe cases, also arthrogryposis multiplex congenita may occur (Falsaperla
et al. 2001; Guillot et al. 2008). Furthermore, it has been reported that in some cases SMA type I patients also suffer from congenital heart defects (Finsterer and Stollberger 1999;
Rudnik-Schoneborn et al. 2008) or necrosis of fingers and toes (Araujo Ade et al. 2009;
Rudnik-Schoneborn et al. 2010).
1.1.2.2 SMA type II, MIM #253550
SMA type II is an intermediate SMA type and often called chronic SMA. Disease onset of SMA type II is between the 6th and 18th month of life. Affected children are able to sit indepently, but never learn to walk and require assistance to stand. Life expectancy is reduced, but more than 70% of patients reach an age of 20 years or older (Russman et al.
1996; Zerres et al. 1997). Frequent symptoms are tremors of the hands, paraparesis and problems with tracheal secretions as well as coughing due to weak intercostal muscles (Iannaccone 1998). Often surgical intervention is needed to correct developing scoliosis (Bertini et al. 2005). The most frequent cause of death of SMA type II patients is respiratory insufficieny during adolescence.
1.1.2.3 SMA type III (Kugelberg-Welander disease), MIM #253400
SMA type III was described for the first time in 1956 (Kugelberg and Welander 1956).
Characteristic for this juvenile form of SMA, which is often confused with limb girdle muscular dystrophy, is the appearance of disease manifestations after the 18th month of life.
Depending on the actual age of onset, SMA type III is divided into two subtypes. If first symptoms occur before the age of three years the disease is classified as type IIIa, whereas in SMA type IIIb the diseases occurs after an age of three years (Zerres and Rudnik- Schoneborn 1995). Symptoms of SMA type III include a waddling gait and overall thin appearance as well as scoliosis (Iannaccone 1998). However, the overall clinical picture of SMA type III is very heterogenous. Some individuals may need wheelchair assistance, while others may be able to walk throughout their life.
1.1.2.4 SMA type IV (adult SMA), MIM #271150
SMA type IV is the mildest form of SMA. Typically, first disease manifestations occur after the third decade of life (Wirth 2002). Symptoms are typically very mild and patients have a normal life expectancy. However, only a very low percentage of these patients are linked to mutations in the SMN1 gene, while for the majority an underlying molecular cause is still unknown.
1.2 The molecular basis of SMA
In order to identify the critical SMA locus, researches started linkage analysis. In 1990 finally, three independent groups mapped SMA to a 10 cM region on the long arm of chromosome 5 (5q11.2-13.3) (Brzustowicz et al. 1990; Gilliam et al. 1990; Melki et al. 1990).
Progress in the development of highly polymorphic markers allowed narrowing down the SMA locus to an interval less than 750 kb between the markers A31 and 95/23-CA (DiDonato et al. 1994; Melki et al. 1993; Melki et al. 1994; Soares et al. 1993; Wirth et al. 1995; Wirth et al. 1994). Subsequent studies identified an inverted duplication of a 500 kb element within this region, of which each of the duplicates can be present in zero to four copies (Lefebvre et al. 1995; Wirth et al. 2006a). This complex genomic organization severely hampered the construction of a uniform physical map of the region surrounding the SMA determining gene (Melki et al. 1994; Roy et al. 1995a; Roy et al. 1995b; Thompson et al. 1993). However, in 95% of healthy controls, a newly identified 20 kb gene was present in both the centromeric and telomeric 500 kb copy, whereas the telomeric one was either lacking or interrupted in the vast majority of patients. This suggested that the identified telomoric gene copy is indeed the SMA determing gene. Since SMA is characterized by the degeneration of motor neurons, the gene was termed survival motor neuron (SMN) (Lefebvre et al. 1995). Besides SMN, another four genes have been shown to be included in the duplicated 500 kb segment:
BIRC1 (baculoviral IAP repeat-containing protein 1) which is also known as NAIP (neuronal apoptosis inhibitory protein), SERF1 (small EDRK-rich factor 1), also termed H4F5, GTF2H2 (general transcription factor IIH) or p44, and OCLN (occludin) (Lefebvre et al. 1995; Schmutz et al. 2004). Proximally, this highly polymorphic region is flanked by RAD17, whereas the distally adjacent gene is BDP1 (Figure 1) (Deimling von et al. 1999; Kelter et al. 2000)
Figure 1 Schematic overview of the “SMA region” on chromosome 5q13. Arrow heads indicated reading direction. (SMNc = centromeric SMN, SMNt = telomeric SMN)
1.2.1 SMN1 and SMN2
Within the SMA region, two copies of SMN have been identified each spanning 28 kb on genomic level (Chen et al. 1998). Both genes consist of nine exons (1, 2a, 2b, 3-8) with an open reading frame of 882 bp (294 codons) encoding for a 38 kDa protein (Lefebvre et al.
1995). The 1.5 kb SMN transcript is expressed in all somatic tissues, in which the expression is ~50- to 100-fold higher in the spinal cord compared to other tissues (Coovert et al. 1997;
Lefebvre et al. 1997). The telomeric SMN copy, termed SMN1, has been identified as the SMA determining gene (Lefebvre et al. 1995). Over 96% of SMA patients have homozygous deletions or gene conversion from SMN1 into SMN2 (Lefebvre et al. 1995; Wirth 2000). The latter case is predominantly found in type II or III patients who have multiple SMN2 copies (Wirth et al. 1997). Besides homozygous deletion of SMN1 in approx. 4% of SMA patients intragenic SMN1 mutations are observed, which interfere with normal gene function or lead
to Nonsense-mediated-mRNA-decay (NMD). These patients are typically compound heterozygous, with a deletion of one SMN1 allele and a mutation in the other allele (Brichta et al. 2008; Lefebvre et al. 1995; Sun et al. 2005; Wirth 2000).
All SMA patients retain at least one copy of SMN2. Although SMN2 produces 90%
truncated protein due to alternative splicing (presented in detail in 1.2.2), the remaining 10%
full-length protein substantially influence the SMA phenotype: The more SMN2 copies are present, the less severe is the phenotype. Most of SMA type I patients have two SMN2 copies, whereas e.g the majority of SMA type II cases possess three copies (Lefebvre et al.
1995; Wirth 2000).
Recently, a positive modifier of the SMA phenotype has been identified within SMN2. At position +25 in exon 7, a single base substitution (c.859G>C) was identified, leading to a less severe SMA phenotype than expected from the SMN2 copy number (Prior et al. 2009; Vezain et al. 2010). However, the SMA phenotype is also influenced by other genes. For example in very rare cases, high expression levels of PLS3 have been found to fully protect women from developing SMA (Oprea et al. 2008).
The finding that deletion of SMN1 causes SMA, whereas SMN2 only modifies the actual phenotype, was of particular interest since both genes are almost identical except for 5 nucleotide exchanges in the 3´-end of SMN2 (Burglen et al. 1996; Lefebvre et al. 1995):
Intron 6 nt position 27092 G>A
Exon 7 nt position 27141 c.840C>T, codon 280 (TTC>TTT, Phe>Phe)
Intron 7 nt position 27289 A>G nt position 27404 A>G
Exon 8 nt position 27869 G>A (untranslated region)
Nowadays, several other gene variants have been described, but these occur in both SMN1 and SMN2 (Brahe et al. 1996; Hahnen and Wirth 1996; Monani et al. 1999).
Phylogenetic analysis showed that the SMN protein is highly conserved from yeast to man (Miguel-Aliaga et al. 1999; Paushkin et al. 2000; Schrank et al. 1997). The gene duplication event occurred for the first time in primates roughly five million years ago.
However, also in man´s closest relative Pan troglodytes, only two to seven copies of SMN1 are present whereas the SMN2 gene is unique to humans (Rochette et al. 2001)
1.2.2 SMN splicing
Although SMN1 and SMN2 differ by 5 nucleotides, both genes encode for the identical protein since these nucleotide exchanges are either intronic, in 3´-UTR or translationally silent (Burglen et al. 1996; Lefebvre et al. 1995). However, on mRNA level both SMN genes exhibit clear differences. SMN1 produces almost exclusively full-length transcripts, whereas
90% of SMN2 transcripts are alternatively spliced and lack exon 7 (SMN27). Merely 10% of SMN2 pre-mRNAs are correctly spliced and are processed to full-length transcripts (FL- SMN2) (Gennarelli et al. 1995; Lefebvre et al. 1995; Lorson et al. 1999). The lack of SMN exon 7 dramatically influences SMN protein production, since it encodes the C-terminal 16 aa and contains the first stop codon of full-length SMN transcripts (position +49 to +51). If exon 7 is included in the mature mRNA, it is translated into full-length SMN protein consisting of 294 aa. However, if exon 7 is skipped, an alternative stop codon at position 13 of exon 8 is used, resulting in a truncated 282 aa protein (Figure 2) (Gennarelli et al. 1995;
Lorson et al. 1998). Recently, it has been shown that this altered C-terminus creates a degron, which leads to a more rapid degradation of the 7-protein compared to the full- length protein (Burnett et al. 2009; Cho and Dreyfuss 2010; Lorson and Androphy 2000).
Furthermore, the truncated protein also exhibits a reduced oligomerization capacity (Lorson et al. 1998). From both SMN genes, also three other transcripts are produced, namely SMN5 lacking exon 5, SMN3 deficient of exon 3 as well as SMN57 in which both exons 5 and 7 are skipped (Chang et al. 2001; Gennarelli et al. 1995; Singh 2007; Sossi et al. 2001).
Self-evidently, research has focused on why SMN2 exon 7 is spliced in a different way than SMN1 exon 7. SMN exon 7 is a relatively short exon, spanning only 54 nucleotides. It is characterized by a weak 3` splice site due to a suboptimal polypyrimidine tract, making it prone to alternative splicing (Lim and Hertel 2001). Nowadays, two different hypotheses have been proposed to explain the differences in exon 7 splicing. Fundamental to both is the C to T transition in SMN2 at position +6 of exon 7. On the one hand, researchers argue that this particular nucleotide exchange destroys an exonic splicing enhancer (ESE) located at the beginning of exon 7 (Lorson and Androphy 2000; Lorson et al. 1999). This heptameric motif is typically recognized by the splice factor SF2/ASF, which favors exon inclusion. In the case of SMN2, SF2/ASF is not able to bind this ESE thus exon 7 is skipped (Figure 2) (Cartegni et al.
2006; Cartegni and Krainer 2002). A concurring hypothesis suggests that the C to T transition leads to a formation of a novel exonic splicing silencer (ESS), which in turn recruits the splice factor hnRNP A1 leading to exon 7 skipping (Kashima and Manley 2003; Kashima et al.
2007a; Singh et al. 2004). Furthermore, it has been shown that Sam68 also binds to the putative ESS and interacts with hnRNP A1 to cooperatively promote exon 7 skipping (Pedrotti et al. 2010). However, both hypotheses can also be combined in such a way that the C to T transition destroys an ESE and creates an ESS instead (Figure 2).
In addition to SF2/ASF, hnRNP A1 and Sam68, a plethora of additional other factors is involved in the splicing of SMN2-pre-mRNA . Among these, the SR-like splice factor hTRA2-1 (SFRS10, Serine/Arginine rich splice factor 10) has an exceptional role since its overexpression reverses the SMN2 splicing to 80% full-length FL-SMN2 (Hofmann et al.
2000). hTRA2-1 binds to GA-rich second ESE in the central region of SMN exon 7 and acts as an platform for the binding of other splice factors, such as SRp30, hnRNP-G or TDP-43. All three of them have been demonstrated to favour SMN exon 7 inclusion by direct binding to
hTRA2-1 (Figure 2) (Bose et al. 2008; Helmken and Wirth 2000; Hofmann and Wirth 2002;
Young et al. 2002).
Adjacent to SMN exon 7, several regulatory elements have been identified (Figure 2).
Among these, two positively acting intronic elements termed I7-1 and I7-2 have been identified in intron 7. It has clearly been demonstrated that I7-1 acts as an intronic splicing enhancer (ISE), which favors exon 7 inclusion (Gladman and Chandler 2009). In addition, several potent negatively acting elements have been detected, such as element 1 (E1) in intron 6 which is bound by PTB and FUSE (Baughan et al. 2009; Miyajima et al. 2002).
Moreover, in intron 7 the stem-loop forming element 2 (E2) (Miyaso et al. 2003) as well as ISS-N1, which is recognized by hnRNP-A1, have both been identified to promote exon 7 skipping (Kashima et al. 2007b; Singh et al. 2006).
Figure 2 Proposed molecular mechanism for SMN exon 7 inclusion and exclusion. In the case of SMN1 depicted in the upper part, SF2/ASF binds to the ESE at the beginning of exon 7.
SF2/ASF interacts via U2AF with the U2 snRNP to facilitate the removal of intron 6.
Additional splice factors such as hTRA2-1 or hnRNP-G act positively on exon 7 inclusion. In the case of SMN2 depicted in the lower part binding of hnRNP-A1 and Sam68 abolishs binding of SF2/ASF (potentially also of the U2 snRNP) thereby promoting exon 7 exclusion.
Several cis-acting elements like E1, ISSN1 or I7-1 individually act on exon 7 inclusion or exclusion. (Modified from (Lorson et al. 2010))
Furthermore, a positive acting element within SMN2 in exon 7 has recently been identified in several SMA patients, showing a much milder phenotype than expected from the SMN2 copy number. Downstream of the putative ESE/ESS at position +25 a single base
substitution (c.859G>C) was located, which creates another putative SF2/ASF binding motif (Prior et al. 2009; Vezain et al. 2010).
Although SMN2 splicing is quite complex, several therapeutic approaches have been undertaken which either directly or indirectly target SMN2 splicing. Though, these will be presented in 1.6.
1.3 The SMN protein
The human SMN protein is expressed in virtually all tissues, with highest levels present in the CNS and liver (Carvalho et al. 1999; Young et al. 2001; Young et al. 2000). Since SMN abundance markedly declines after birth, it is thought that elevated SMN levels may play an important role throughout prenatal development (Burlet et al. 1998). Similarly to that, also the rodent Smn is present at the highest levels before birth, but its abundance decreases soon thereafter by Smn promoter hypoacetylation (Battaglia et al. 1997; Jablonka et al.
2000; Kernochan et al. 2005; Liu et al. 2010).
SMN has a molecular weight of 38 kDa and consists of 294 aa (Lefebvre et al. 1995). Like the majority of cytoplasmatic proteins, SMN is degraded via the ubiquitin-proteasome- system (UPS) (Burnett et al. 2009; Chang et al. 2004). Very recently, the ubiquitin-ligase UCHL1 has been identified to transfer activated ubiquitin onto SMN, thus regulating its degradation (Hsu et al. 2010). Within the SMN protein, several functional domains have been identified during the last years. N-terminally, Exon 2b and the beginning of exon three encode for RNA-binding-domain (RBD) (Bertrandy et al. 1999), whereas the major part of exon 3 is spanned by a Tudor-domain facilitating Sm protein binding during U snRNP biogenesis (Selenko et al. 2001). In exons 4 and 5 a proline-rich stretch was identified, mediating interaction with Profilins (Bowerman et al. 2009; Bowerman et al. 2007;
Giesemann et al. 1999). Furthermore, it has been shown that the YG-box, encoded by exon 6 in conjunction with exon 2b, is required for SMN self-oligomerization (Lorson et al. 1998).
Inside the cell, SMN is present in both the cytoplasm and the nucleus. While in the cytoplasm it is diffusely distributed, distinct SMN foci are observed inside the nucleus. These foci are most often found in close proximity or even overlapping with coiled bodies (also known as Cajal bodies). Based on these observations, the nuclear SMN foci were termed Gemini of coiled bodies or gems (Burlet et al. 1998; Coovert et al. 1997; Liu and Dreyfuss 1996; Liu et al. 1997). In addition to the 38 kDa SMN protein, another shortened isoform has been identified which is selectively expressed in the axons of developing motor neurons (aSMN). This isoform includes exons 1 to 3 and a retained part of intron 3 (Setola et al.
2007).
1.3.1 The SMN complex
SMN is the major constituent of a large multi-subunit protein complex weighing approx.
1 MDa, termed the SMN complex. The further core components Gemins2 to -8 are stably associated with the SMN complex and present in a stoichiometric manner (Carissimi et al.
2006a; Carissimi et al. 2006b; Pellizzoni et al. 2001a; Pellizzoni et al. 2002). In addition, several transient interaction partners have been identified, which are mainly involved in snRNP-biogenesis. However, it is believed that SMN and Gemin2 represent the ancestral core of the SMN complex to which the other Gemins were added blockwise during evolution (Kroiss et al. 2008). From a structural point of view, SMN functions as modular backbone of the SMN complex since its ability to self-oligomerize allows binding of a multitude of partners (Figure 3) (Pellizzoni 2007). Furthermore, it has been shown that complexation markedly increases SMN protein half-life from approx. 4.3 hrs to around 15 hrs (Burnett et al. 2009).
Figure 3 Schematic overview of the SMN complex. Stable binding partners are Gemin2, -3, -5, -7 and -8 whereas Gemin4 and -6 are associated via other Gemins (taken from (Pellizzoni 2007)).
1.3.2 Functions of SMN
Since SMN is involved in a vast number of cellular processes, these were subdivided into ubiquitous housekeeping ones and functions which are specific to either neurons or muscles.
1.3.2.1 Housekeeping functions
Biogenesis of snRNPs
Small nuclear ribonucleoproteins (snRNP) are of vital importance for the splice process in every cell since they identify and subsequently remove the introns from pre-mRNAs. snRNPs are constituented of a major proteinous part and a small nuclear RNA (snRNA) of 100 to 300 bp transcribed by RNA-Polymerases II. It has been shown that the SMN complex facilitates
addition of the Sm proteins D1, D2, E, F, G and D3, B (Smith antigen) onto the respective snRNA and catalyzes Sm ring closing (Lorson et al. 1998; Meister and Fischer 2002; Pellizzoni et al. 1999). While the SMN complex directly recruits the respective snRNA, the Sm proteins are handed over by the assembly chaperone pICln (Chari et al. 2008). Following assembly, the SMN-snRNP-complex shuttles into the nucleus and is typically stored in gems until further usage. Once the snRNP is released, the SMN complex is translocated out of the nucleus and enters another round of snRNP assembly (Chari et al. 2009).
However, several point mutations in SMN1 have been shown to impair binding of SMN to the Sm proteins, thus leading to generalized splicing defects (Gabanella et al. 2007; Lorson et al. 1998; Pellizzoni 2007; Sun et al. 2005; Zhang et al. 2008).
Stress response
Exposure of a cell to stress factors such as heat or UV irradiation triggers wide-spread alterations in expression as well as distribution of cellular constituents. Studies showed that specific stress-induced genes e.g. the heat-shock-proteins (HSPs), which mostly fullfil chaperoning functions, are actively expressed upon stress stimulus while most other genes are silenced (Buchan and Parker 2009). The key factor in this process is the phosphorylation of eukaryotic initiation factor 2 (eIF2), leading to reduced global translation (Underhill et al. 2005). More than 50% of total mRNA transcripts are actively recruited into stress granules (SG) to protect them from degradation or denaturation (Buchan and Parker 2009). Stress granules are formed by shuttling of the RNA binding proteins TIA-1(T-cell internal antigen-1) and TIA-R (TIA1-related protein) from the nucleus into the cytoplasm where these proteins self-aggregate (Kedersha et al. 1999). However, it has been shown that SMN interacts with TIA-1/R as well as Rpp20, which accumulate in stress granules (Hua and Zhou 2004a, b).
Nevertheless, since SMN accumulation precedes that of TIA-1/R, it has been suggested that SMN serves as a facilitator of SG formation (Hua and Zhou 2004b).
Regulation of transcription
Transcription is opposingly regulated by the so-called co-activator and co-respressor complexes, which consist and recruit enzymes involved in chromatin remodelling or translational initiaton (Rosenfeld et al. 2006). Several years ago, it was shown that SMN interacts via its YG-box with mSin3A (Zou et al. 2004), which interacts with the corepressors SMRT and N-CoR (Nagy et al. 1997). Since both, SMN and mSin3A, are involved in formation of a >40 MDa complex, it has been suggested that SMN may also be involved in the regulation of transcriptional repression (Zou et al. 2004). Further evidence came from the observations that SMN associates with RNA polymerase II (Pellizzoni et al. 2001b) and dp103, a putative RNA helicase (Campbell et al. 2000).
Regulation of translation
Based on the finding that SMN is transporting mRNA along axons (1.3.2.2), it has been suggested that SMN may also be involved in translational regulation. Furter evidence pointing into this direction came from the observation that the C-terminal YG-box of SMN interacts with FMRP (Fragile X Mental Retardation Protein) (Piazzon et al. 2008). FMRP is involved in nuclear export and transport of yet unknown target mRNAs and is often detected near polysomes (Bardoni et al. 2001). However, debate is still ongoing whether the SMN complex is involved in the assembly of FRMP-containing mRNPs or whether SMN alone is transiently interacting with mRNPs during their transport.
1.3.2.2 Neuron-specific functions
Axonal mRNA transport
It has been observed that neurons of SMA-like mice exhibit reduced levels of -Actin mRNA at the axonal growth cones, which suggested that SMN is involved in mRNA transport along axons. This is in line with the finding that SMN interacts with hnRNP-R (heterogenus nuclear ribonucleoportein-R), which controls -actin localization (Rossoll et al. 2003). Furthermore, it has been demonstrated that SMN complexes traffic along neuronal processes to the growth cones of motor neurons (Zhang et al. 2006) and that SMN, Gemin2 and Gemin3 associate with -Actin mRNA in the cytoplasm of neuronal cells (Todd et al. 2010). Based on these findings, it was suggested that SMN or the SMN complex is actively involved in the transport of axonal mRNAs such as -Actin. However, it has been shown that also other cytoskeletal mRNAs like tubulin, peripherin and vimentin are transported along axons, but it has not yet been reported whether SMN is involved in their transport (Willis et al. 2007).
Neurite outgrowth
Several in vitro as well as in vivo studies in zebrafish and mice showed that SMN depletion strongly reduces neurite outgrowth, a process depending on actin remodelling (Bowerman et al. 2009; Fan and Simard 2002; McWhorter et al. 2003; Oprea et al. 2008). Since knockdown of SMN alters the G-/F-actin ratio, it has been proposed that SMN may be involved in microfilament metabolism (van Bergeijk et al. 2007). In line with this, the protective SMA modifier PLS3 is an actin-bundling protein presumably restoring disturbed G-/F-actin ratios in SMA patients (Oprea et al. 2008). Furthermore, SMN depletion alters Profillin II expression, thus impairing the RhoA/ROCK actin remodelling pathway (Bowerman et al. 2007).
Neuromuscular junction formation
Neuromuscular junctions (NMJ) are the connecting pieces between the axon terminal of a motor neuron and the respective muscle. Histological inspection of SMA-like mice revealed that the maturation of NMJs was severely reduced and AChR (Acetylcholine Receptor)