Molecular genetic investigations of histone deacetylase inhibitors as potential neurotherapeutics
for autosomal recessive proximal spinal muscular atrophy (SMA)
I n a u g u r a l - D i s s e r t a t i o n zur
Erlangung des Doktorgrades
der Mathematisch-Naturwissenschaftlichen Fakultät der Universität zu Köln
vorgelegt von Lars Brichta aus Lutherstadt Eisleben
2006
Berichterstatter/in: Prof. Dr. rer. nat. Brunhilde Wirth Prof. Dr. med. Jens Brüning
Tag der letzten mündlichen Prüfung: 24. Oktober 2006
Für meine Eltern
Acknowledgements
The studies presented in this thesis were carried out at the Institute of Human Genetics, University of Cologne, the Institute of Human Genetics, University of Bonn, and in part at the Institute of Neuropathology, University Erlangen-Nuremberg.
I wish to express my sincere gratitude to:
Professor Brunhilde Wirth, my supervisor, for giving me the opportunity to prepare this thesis and to work on a highly interesting project, for opening ways into the international world of science, for sharing scientific knowledge and curiosity, for generous support and various opportunities to attend scientific congresses, and for leaving room for me to work independently.
Professor Ingmar Blümcke and Dr. Ilker Y. Eyüpoglu for collaborating on the ex vivo experiments with valproic acid in organotypic hippocampal rat brain slices.
All past and present members of the “SMA group” for being good workmates, especially Irmgard Hölker for contributing with skillful technical assistance (!), Claudia Helmken for reading the draft and for sending her unique and refreshing weekly e-mails maintaining a consistent atmosphere of good humor, Markus Rießland and Frank Schönen for stimulating and helpful discussions, Jutta Becker for sharing her expertise on real-time PCR, Yvonne Hofmann for introducing me into the field of SMA, Heidrun Raschke for introducing me into cell culture techniques and help with the EBV cell cultures, and Susanne Räder for providing technical assistance on the LightCycler machine.
Inga Ebermann and Axel Hillmer for sharing their knowledge and valuable discussions.
Serjoscha Blick and Katharina Zimmermann for always being available to give technical support.
Constanze Pagenstecher and Hanno Bolz for their ever-present willingness to draw blood from control subjects.
Marlies Sengteller for good advice and friendship.
Waltraud Friedl for working in the room next door late at night, preventing me from being lonely.
Karin Boß for sharing her excellent English skills.
My parents for their everlasting support, their confidence in me, for being my friends, and for everything they taught me, it is an excellent foundation for life.
Table of contents
Table of contents ... I List of abbreviations ... VI
1 Introduction ... 1
1.1 Diagnostic criteria and clinical picture of proximal SMA... 2
1.1.1 Diagnostic criteria... 2
1.1.2 Clinical picture and classification of proximal SMA ... 3
1.2 Molecular basis of proximal SMA... 4
1.2.1 Mapping of the SMA region... 4
1.2.2 Survival motor neuron (SMN), the SMA determining gene in humans ... 5
1.2.3 Alternative splicing of SMN transcripts... 6
1.2.4 Splicing regulation of SMN exon 7 ... 7
1.2.5 The SMN protein ... 10
1.3 Animal models of proximal SMA... 15
1.4 Biology of motor neuron degeneration in proximal SMA ... 17
1.5 State-of-the-art of SMA treatment and therapeutic prospects... 18
1.6 Chromatin structure and epigenetic regulation... 20
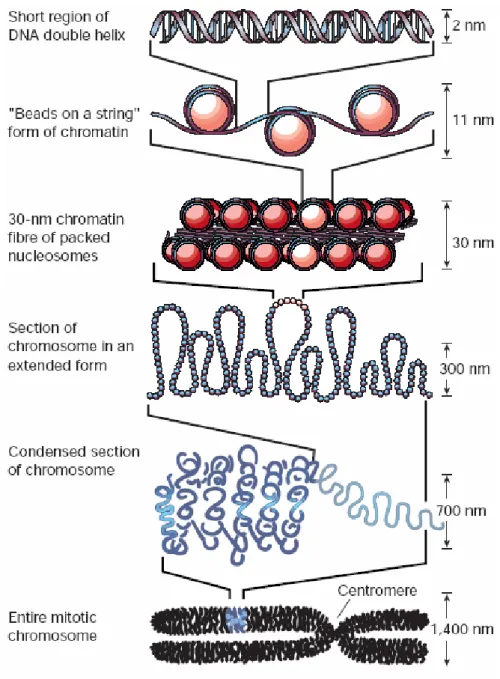
1.6.1 DNA packaging in the eukaryotic nucleus... 20
1.6.2 Epigenetic modification of DNA and histone proteins ... 22
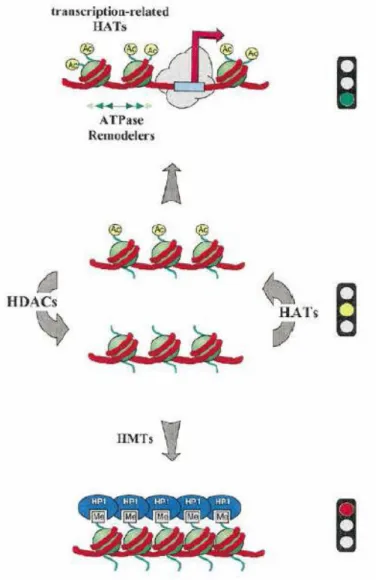
1.6.3 Histone deacetylases (HDACs) and histone acetyltransferases (HATs) ... 24
1.6.4 Chemical substances that inhibit the activity of HDACs ... 26
2 Aims ... 29
3 Subjects, Materials, and Methods ... 30
3.1 Human material derived from control subjects, SMA carriers, and SMA patients... 30
3.1.1 Cell lines derived from SMA patients ... 30
3.1.2 Blood samples derived from untreated controls, SMA carriers, and SMA patients .... 30
3.1.3 Blood samples derived from SMA carriers treated with valproic acid... 30
3.1.4 Blood samples derived from SMA patients treated with valproic acid ... 30
3.1.5 Human Blood Fractions MTC Panel... 31
3.2 Organotypic hippocampal slices prepared from rats... 31
3.3 Equipment and Chemicals ... 31
3.3.1 Equipment... 31
3.3.2 Chemicals ... 32
3.4 Solutions and Media ... 33
3.4.1 Frequently used buffers and solutions... 33
3.4.2 Media for eukaryotic cell and tissue culture procedures ... 37
3.5 Primers and siRNAs ... 39
3.6 Software, internet programs, and databases... 41
3.7 Cell culture and tissue culture procedures... 41
3.7.1 Cell culture of primary fibroblasts derived from SMA patients ... 42
3.7.2 Stimulation of primary fibroblast cell lines with chemical substances ... 42
3.7.3 Cell culture of EBV-transformed lymphoblastoid lines derived from SMA patients... 43
3.7.4 Stimulation of lymphoblastoid cell lines with chemical substances... 43
3.7.5 MTT assay ... 43
3.7.6 Transient transfection of primary human fibroblasts ... 44
3.7.7 Tissue culture of organotypic hippocampal slices from rat... 46
3.7.8 Stimulation of rat hippocampal slices with chemical substances ... 46
3.8 Molecular biology methods... 46
3.8.1 Isolation of genomic DNA from whole blood ... 46
3.8.2 Determination of the DNA concentration ... 47
3.8.3 Isolation of total RNA from primary fibroblast cell cultures... 47
3.8.4 Isolation of total RNA from organotypic hippocampal slice cultures (OHSCs) from rat ... 48
3.8.5 Isolation of total RNA from peripheral whole blood ... 48
3.8.6 Isolation of mRNA from peripheral blood mononuclear cells (PBMCs)... 48
3.8.7 Determination of the RNA concentration ... 48
3.8.7.1 Photometric RNA concentration analysis ... 49
3.8.7.2 Fluorimetric RNA concentration analysis with RiboGreen® dye ... 49
3.8.8 Reverse transcription (cDNA synthesis)... 50
3.8.9 Polymerase chain reaction (PCR) ... 50
3.8.9.1 Analysis of gene expression by semi-quantitative multiplex PCR ... 50
3.8.9.2 Analysis of the number of genomic SMN1 and SMN2 copies by quantitative real-time PCR... 51
3.8.9.3 Analysis of gene expression by quantitative real-time PCR... 53
3.8.9.4 Analysis of gene expression by one-step reverse transcription - quantitative real-time PCR... 54
3.8.10 Gel electrophoresis for separation of DNA fragments... 54
3.8.10.1 Agarose gel electrophoresis ... 55
3.8.10.2 Polyacrylamide (PAA) gel electrophoresis ... 55
3.8.11 Densitometric analysis of DNA bands ... 56
3.8.12 Extraction of DNA from agarose gels ... 56
3.8.13 Automatic, non-radioactive sequencing of DNA (Sanger 1977) ... 56
3.9 Proteinbiochemical and immunological methods ... 56
3.9.1 Extraction of proteins from primary fibroblast cell cultures ... 56
3.9.2 Extraction of proteins from organotypic hippocampal slice cultures (OHSCs) from rat ... 57
3.9.3 Extraction of proteins from peripheral blood mononuclear cells (PBMCs) ... 57
3.9.4 Protein contents determined according to the Bradford method... 57
3.9.5 Discontinuous denaturing polyacrylamide gel electrophoresis (SDS-PAGE) ... 58
3.9.6 Transfer of proteins to nitrocellulose membrane by wet blotting (western blot)... 58
3.9.7 Ponceau staining of proteins on nitrocellulose membranes... 59
3.9.8 Immunostaining of membranes with antibodies and detection of signals withchemiluminescence reagent ... 59
3.9.9 Separation of monocytes and lymphocytes from peripheral whole blood by magnetic cell sorting (MACS) ... 60
3.9.10 Immunohistochemistry staining of peripheral blood mononuclear cells (PBMCs) ... 60
3.9.11 Analysis of peripheral blood mononuclear cells (PBMCs) by flow cytometry ... 61
3.9.12 Analysis of pmaxGFP-transfected fibroblasts by flow cytometry ... 61
3.10 Specific methods applied to evaluate the in vivo effect of valproic acid in human subjects ... 62
3.10.1 Pilot trial with SMA carriers ... 62
3.10.1.1 Recruitment of probands ... 62
3.10.1.2 Design of the pilot trial... 62
3.10.1.3 Blood sampling... 63
3.10.2 Individual experimental curative approaches in SMA patients... 63
3.10.2.1 Patient collective ... 63
3.10.2.2 Blood sampling... 63
3.11 Statistical methods... 64
4 Results ... 65
4.1 In vitro experiments with histone deacetylase (HDAC) inhibitors in cell lines derived from SMA patients... 65
4.1.1 Treatment of EBV-transformed lymphoblastoid cell cultures with valproic acid ... 65
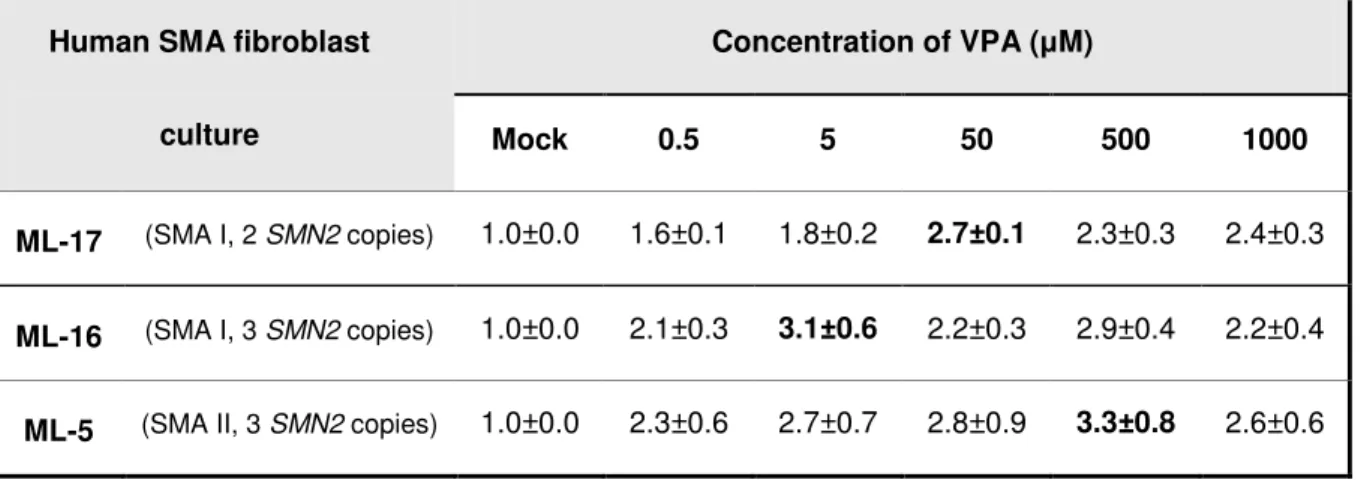
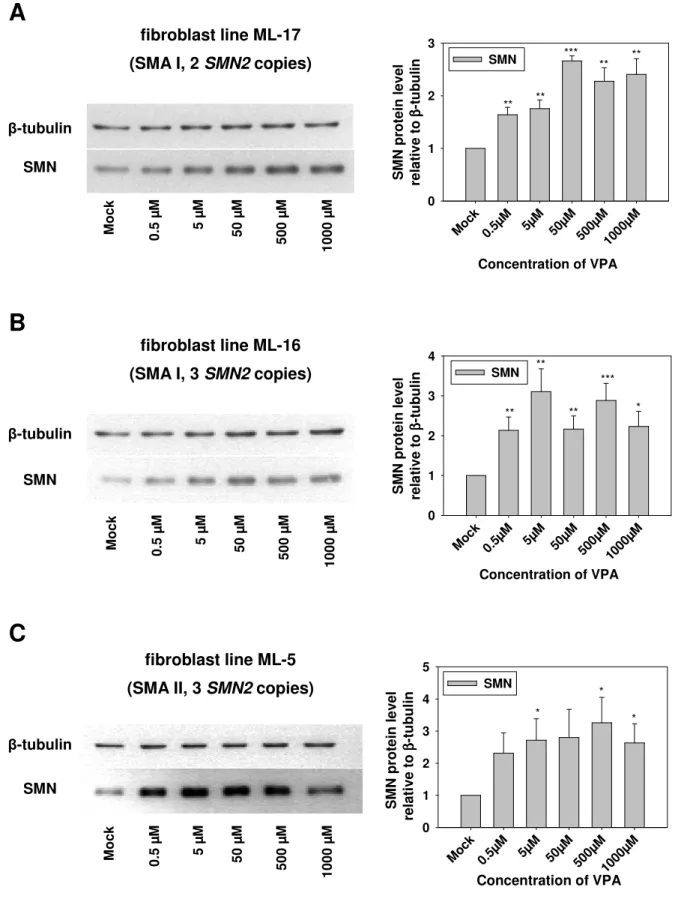
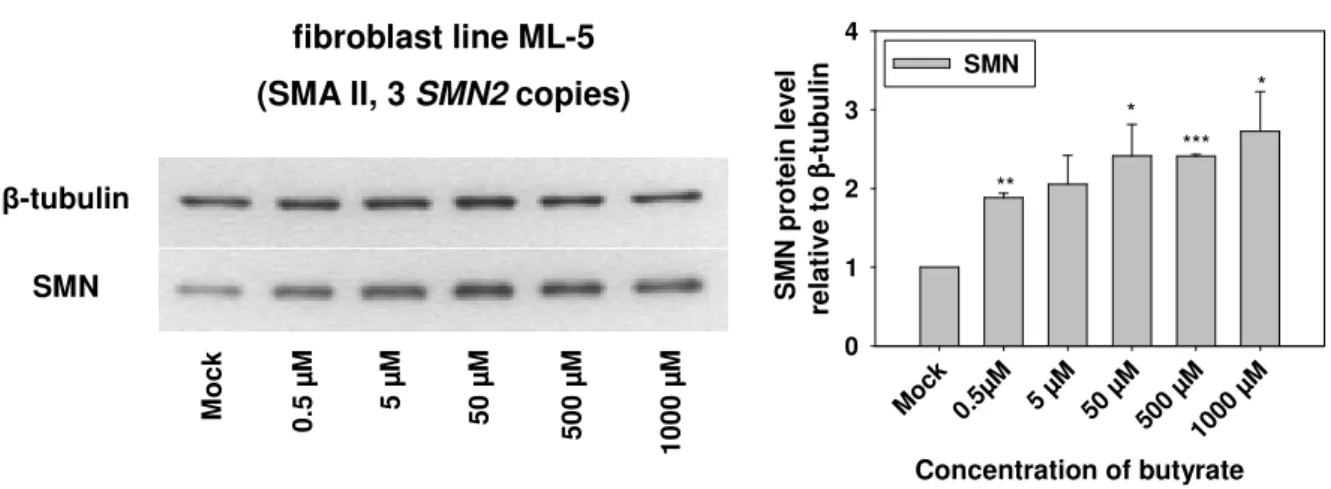
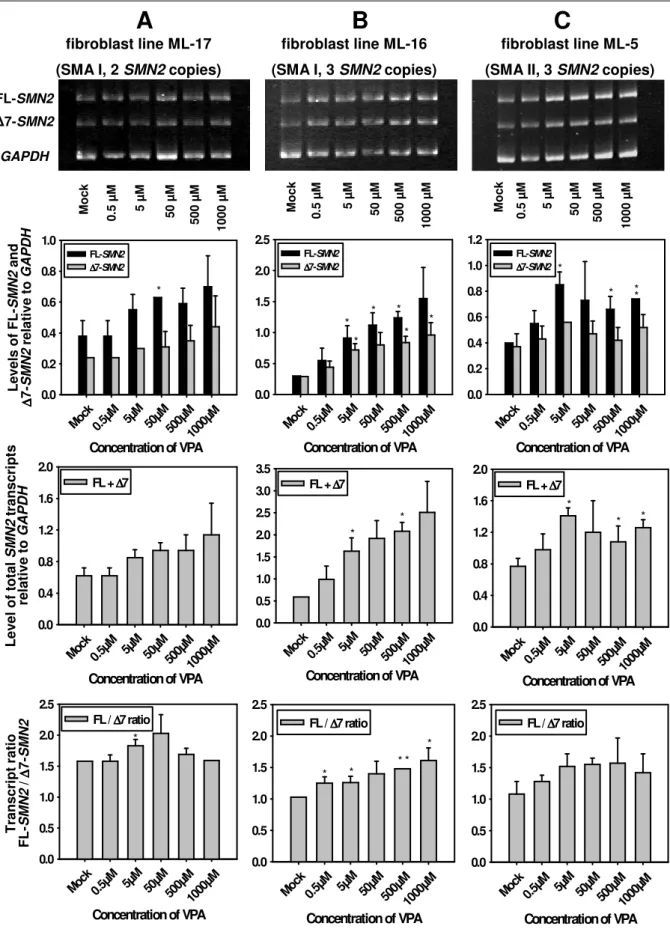
4.1.2 Treatment of SMA fibroblast cultures with valproic acid ... 66
4.1.2.1 Impact of valproic acid on SMN2 protein levels ... 66
4.1.2.2 SMN2 RNA expression under valproic acid treatment... 70
4.1.2.3 Effect of valproic acid on the level of SR and SR-like splicing factors... 71
4.1.2.4 Cytotoxicity of valproic acid in SMA fibroblast cultures... 78
4.1.2.5 Knock-down of Htra2-β1 in primary SMA fibroblast cells... 79
4.1.3 Treatment of SMA fibroblast cultures with SAHA... 85
4.1.3.1 Impact of SAHA on SMN2 protein levels... 85
4.1.3.2 SMN2 RNA levels under SAHA treatment ... 87
4.1.3.3 Levels of the splicing factor Htra2-β1 under SAHA treatment... 88
4.1.3.4 Cytotoxicity of SAHA in SMA fibroblast cultures ... 90
4.1.4 Treatment of SMA fibroblast cultures with MS-275 ... 91
4.1.4.1 Impact of MS-275 on SMN2 protein levels... 91
4.1.4.2 SMN2 RNA expression under MS-275 treatment ... 92
4.1.4.3 Levels of the splicing factor Htra2-β1 under MS-275 treatment... 94
4.1.4.4 Cytotoxicity of MS-275 in SMA fibroblast cultures... 95
4.2 Ex vivo experiments with valproic acid in organotypic hippocampal slice cultures (OHSCs) from rat... 96
4.2.1 Treatment of OHSCs with valproic acid ... 96
4.2.1.1 Transcriptional activity of rSmn under valproic acid treatment... 96
4.2.1.2 Impact of valproic acid on rSmn protein levels... 98
4.2.1.3 Effect of valproic acid on the level of the splicing factors Tra2-β1 and SF2/ASF in OHSCs ... 99
4.3 In vivo effect of valproic acid on SMN gene expression in SMA carriers and SMA patients... 100
4.3.1 Screening for a suitable endogenous control: Expression analysis of selected (housekeeping) genes in blood ... 100
4.3.1.1 Applicability of CTLA1 transcript levels for the normalization of SMN transcripts in peripheral blood ... 101
4.3.1.2 Natural expression variation of the housekeeping genes RPLP0, B2M, PPIB, and GUSB in peripheral whole blood ... 102
4.3.1.3 Comparison of the expression levels of PPIB, GUSB, FL-SMN, and ∆7-SMN in monocytes and lymphocytes... 103
4.3.1.4 Impact of valproic acid on the expression of PPIB and GUSB in peripheral whole blood... 105
4.3.2 Normalization of SMN target transcripts as copy number per total RNA amount used for reverse transcription ... 106
4.3.3 Flow cytometric analysis of SMN protein levels in peripheral blood mononuclear cells (PBMCs) ... 107
4.3.4 Comparison of baseline SMN transcript levels in peripheral whole blood from controls, SMA carriers, and SMA patients... 112
4.3.5 Pilot trial with valproic acid in SMA carriers... 114
4.3.5.1 Impact of valproic acid on SMN mRNA levels in peripheral whole blood from SMA carriers... 114
4.3.5.2 Impact of valproic acid on SMN protein levels in peripheral whole blood from SMA carriers... 117
4.3.6 Analysis of SMN2 mRNA levels in peripheral whole blood from patients
with type I, II, and III SMA treated with valproic acid... 118
5 Discussion ... 122
5.1 In vitro and ex vivo investigations of the first-generation HDAC inhibitor valproic acid... 122
5.2 In vitro investigations of the second-generation HDAC inhibitors SAHA and MS-275... 132
5.3 In vivo effect of valproic acid on SMN gene expression in SMA carriers and SMA patients... 136
5.4 Future directions ... 142
6 Summary... 144
7 Zusammenfassung... 146
8 Publications, lectures, poster contributions, and awards... 148
8.1 Original publications ... 148
8.2 Reviews and book chapters... 148
8.3 Printed lecture contributions ... 149
8.4 Printed poster contributions... 150
8.5 Awards ... 151
9 References... 152
Appendix ... IX
Erklärung Lebenslauf
List of abbreviations
A adenine
APS ammonium persulfate
bp base pair
BSA bovine serum albumin
C cytosine
CD cluster of differentiation
cDNA complementary DNA
cen centromeric
CK creatine kinase
cM centimorgan
cm centimeter
CNS central nervous system
CPDA-1 citrate, phosphate, dextrose-adenine (solution)
DEPC diethylpyrocarbonate
D-MEM Dulbecco’s modified Eagle medium
DMSO dimethylsulfoxide
DNA deoxyribonucleic acid
EBV Epstein-Barr virus
EDTA ethylenediaminetetraacetic acid
e.g. exempli gratia
EMG electromyography
ESE exonic splicing enhancer
ESS exonic splicing silencer
et al. et alii
FCS fetal calf serum
FDA Food and Drug Administration
FITC fluorescein isothiocyanate
FL full length
G guanine
g acceleration due to gravity
GGT gamma-glutamyltransferase
GPT glutamic-pyruvic transaminase
h hours
HAT histone acetyltransferase
HBSS Hanks’ balanced salt solution
HDAC histone deacetylase
HMT histone methyltransferase
i.e. id est
ISS intronic splicing silencer
kb kilobases
kDa kilodalton
l liter
LAT lysine acetyltransferase
LLN lower limit of normal
M molar
m milli-
Mb megabases
MDa megadalton
min minutes
ml milliliter
mm millimeter
mM millimolar
mRNA messenger RNA
NCV nerve conduction velocity
n.d. not determined
ng nanogram
nm nanometer
nmol nanomol
OHSC organotypic hippocampal slice culture OMIM Online Mendelian Inheritance in Man
PAA polyacrylamide
PAGE polyacrylamide gel electrophoresis PBMC peripheral blood mononuclear cells
PBS phosphate-buffered saline
PCR polymerase chain reaction
pH power of hydrogen
PI propidium iodide
pmol picomol
RNA ribonucleic acid
RNAi RNA interference
rpm revolutions per minute
RT reverse transcription
SAHA suberoylanilide hydroxamid acid
SD standard deviation
SDS sodium dodecyl sulfate
SEM standard error of the mean
siRNA small interfering RNA
SMA autosomal recessive spinal muscular atrophy
SMN survival motor neuron
T thymidine
TEMED N,N,N’,N’-tetramethylethylenediamine
ter telomeric
UV ultraviolet
VPA valproic acid
µ micro-
µg microgram
µl microliter
µM micromolar
µm micrometer
# number
1 Introduction
The spinal muscular atrophies constitute a genetically and clinically heterogeneous group of neuromuscular disorders in humans sharing the common pathological feature of degeneration of lower motor neurons in the anterior horns of the spinal cord. Other neurologic systems (including brain and sensory nerves) or other organs are rarely involved. Intelligence of affected individuals is normal. In all spinal muscular atrophy patients, the progressive loss of innervating α-motor neurons causes denervation especially of voluntary muscles, leading to weakness and muscle atrophy as central disease symptoms. The different forms of lower motor neuron diseases covered by the term ‘spinal muscular atrophies’ are classified according to clinical features (including age of onset, disease severity and distribution of muscle weakness) and on their modes of inheritance (autosomal or X- linked, recessive or dominant). However, the majority of patients (80-90%) demonstrate autosomal recessive inheritance with proximal manifestation of muscle weakness and atrophy of limbs and trunk, which is defined as autosomal recessive proximal spinal muscular atrophy (SMA).
With an incidence of approximately 1 in 6,000-10,000 live births and a heterozygosity frequency of 1 in 35 among Europeans, proximal SMA is the second most common autosomal recessive disorder after cystic fibrosis. Worldwide, it represents the leading genetic cause of death in childhood and early youth. In order to analyze the molecular genetic basis and the pathophysiological mechanisms of SMA, research focused on the identification of the disease determining gene. In 1990, the application of positional cloning strategies and segregation analyses revealed mapping of proximal SMA to a candidate region on the long arm of human chromosome 5 (5q11.2-13.3). There was a major breakthrough in the understanding of the disease in 1995, when a gene was identified which was found to be homozygously deleted in most SMA patients. According to the typical degeneration of α- motor neurons in SMA, this gene was named survival of motor neuron gene (SMN). There are two nearly identical gene copies of SMN located within the ~750 kb SMA region on chromosome 5q13:
one telomeric copy termed SMN1, and a second copy of the gene closer to the centromer termed SMN2. While homozygous deletion or mutation of SMN1 has been determined to cause SMA, each patient retains at least one SMN2 copy. SMN2 is the result of duplication events in the human genome and differs from SMN1 by five nucleotides, only one of which is located in the translated region. This nucleotide exchange in exon 7 has been characterized as a silent mutation without impact on the amino acid sequence. Consequently, SMN1 and SMN2 encode identical proteins. However, in contrast to SMN1, which exclusively produces full-length mRNA transcripts, SMN2 undergoes alternative splicing and mainly generates transcripts lacking exon 7. The latter encode an unstable, only partially functional protein. Hence, SMN2 is not able to fully compensate for the loss of SMN1 in SMA patients. Insufficient amounts of functional SMN protein lead to α-motor neuron degeneration.
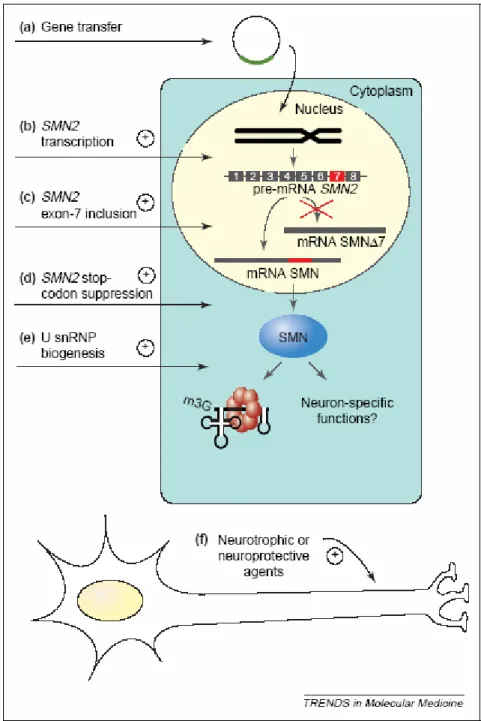
To date, a causal therapy for SMA is not available. SMN2 is the only SMA modifying gene known so far. Milder disease phenotypes correlate with increased SMN2 copy numbers. Since SMN2 is present in each patient, ubiquitously expressed in all tissues and encodes the same protein like SMN1, it has been identified as major target for a potential SMA therapy.
1.1 Diagnostic criteria and clinical picture of proximal SMA
1.1.1 Diagnostic criteria
The diagnosis of SMA is carried out by the help of clinical, biochemical, electrophysiological, histopathological and molecular genetic criteria (Munsat and Davies 1992; Zerres and Davies 1999).
The key symptom of proximal SMA is a symmetrical and progressive muscle weakness and atrophy affecting the limbs positioned closer to the body, such as upper arms and legs, rather than more distant body parts such as hands, feet, fingers, or toes. The weakness in the legs occurs earlier and is generally greater than the weakness in the arms. Muscle groups in the face and eyes are not involved.
Serum creatine kinase (CK) activity is a sensitive marker of increased muscle membrane permeability for large molecules. CK is a “leakage enzyme” present in high concentrations in the cytoplasm of myocytes and is the most widely used enzyme to diagnose and follow muscle disease. In neuromuscular disorders like proximal SMA, serum CK values are only mildly to moderately elevated.
The CK test is used to exclude primary dystrophic processes of the muscle which may lead to extensively increased CK values of 10x normal and above. An elevated serum CK activity above 10x normal indicates a muscle disorder and is an exclusion criterion for proximal SMA.
One of the main diagnostic tools is electromyography (EMG). Contraction of the voluntary muscles is controlled by electrical impulses. They originate from the brain and pass down the motor neurons to the connecting muscles, where the contraction is triggered. The EMG records this electrical impulse and determines whether the electric current and the speed at which the electric impulse passes down the motor neuron are the same as in normal individuals. In SMA patients, EMG demonstrates characteristic spontaneous muscle activity with fibrillations and fasciculations of single muscle fibers and motor units. Nerve conduction velocity (NCV) in SMA patients is normal or mildly reduced, but not lower than 70% compared to age-matched control individuals. A secure diagnosis of proximal SMA always includes an adequate muscle biopsy specimen processed with histochemical stains. Typical histologic and histochemical features allow separation of SMA from other denervating disorders. The vast majority of fibers are atrophic and of both fiber types, with pathologic fiber type grouping the rule.
An additional distinctive feature is the presence of a small number of scattered hypertrophic type 1 fibers presumably resulting from physiologic hypertrophy. Normal-appearing fibers may be present.
Important in histologic diagnosis is the absence of significant necrosis, degeneration, regeneration, lipid accumulation, or connective tissue proliferation. However, older patients with long-standing SMA may demonstrate some of these features, suggesting a secondary myopathic process.
Since 1995, the clinical diagnosis of SMA can be confirmed by molecular genetic testing. Therefore, the SMN1 gene on chromosome 5q is screened for specific mutations (deletions/gene conversions of exon 7 or exon 7 and 8). In addition, this molecular investigation is applied in prenatal diagnosis and carrier testing, making it a highly important diagnostic tool.
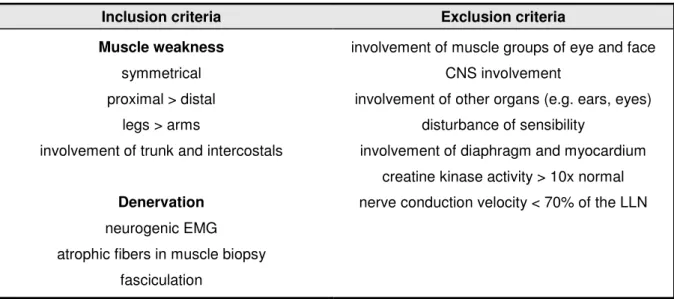
In 1992, the International SMA Consortium defined diagnostic criteria which allow the secure separation of proximal SMA from other disorders (Munsat and Davies 1992). Due to the gain of knowledge regarding SMA, these criteria were modified in 1999 (Zerres and Davies 1999). The most important inclusion and exclusion criteria for proximal SMA are summarized in table 1.
Table 1: Diagnostic inclusion and exclusion criteria for proximal SMA (Munsat and Davies 1992), modified by the International SMA Consortium in 1999 (Zerres and Davies 1999). “LLN” is the abbreviation for
“lower limit of normal”.
Inclusion criteria Exclusion criteria
Muscle weakness symmetrical proximal > distal
legs > arms
involvement of trunk and intercostals
Denervation neurogenic EMG atrophic fibers in muscle biopsy
fasciculation
involvement of muscle groups of eye and face CNS involvement
involvement of other organs (e.g. ears, eyes) disturbance of sensibility
involvement of diaphragm and myocardium creatine kinase activity > 10x normal nerve conduction velocity < 70% of the LLN
1.1.2 Clinical picture and classification of proximal SMA
The clinical picture of severe infantile proximal SMA was described for the first time by Werdnig in 1891 (Werdnig 1891) and Hoffmann in 1893 (Hoffmann 1893). Many years later, in 1956, Kugelberg and Welander reported a less severe form of SMA.The phenotype of proximal SMA is highly variable.
In acute cases, first disease symptoms may occur as early as prenatally, whereas milder forms are characterized by manifestation in adulthood. Depending on the age of onset and disease severity, the International SMA Consortium defined a classification into four types (type I-IV) which is presented in table 2 (Munsat and Davies 1992; Zerres and Rudnik-Schoneborn 1995).
Type I SMA patients (acute infantile SMA, Werdnig-Hoffmann disease; OMIM #253300) are most severely affected with generalized muscle weakness and hypotonia (“floppy infants”). Manifestation already occurs by decreased fetal movements in the last trimester of pregnancy in about one third of cases. However, onset is always noted within six months after birth. Affected infants never achieve the ability to sit or walk and normally die before two years of age due to respiratory failure or infection.
Type II SMA patients (intermediate form, chronic infantile SMA; OMIM #253550) show first clinical signs after six months but before 18 months of age. They are able to sit independently but never learn to walk. Life expectancy is reduced, the survival rate is about 70% at age 20.
Type III SMA patients (Kugelberg-Welander disease, juvenile SMA, OMIM #253400) present a disease onset after 18 months of age and the symptoms can begin to develop as late as adulthood.
They are able to sit and walk but often become wheelchair-bound in the course of disease progression. Patients with an age of onset before three years are sub-classified as IIIa, those with an
age of onset after three years as IIIb (Zerres and Rudnik-Schoneborn 1995; Wirth et al. 2006). Life expectancy is almost normal.
Type IV SMA patients (adult form of SMA, OMIM #271150) are very rare and characterized by an age of onset >30 years and only very mild signs of muscle weakness. So far, only very few patients with type IV have been identified with homozygous absence of SMN1 (Brahe et al. 1995; Clermont et al.
1995; Wirth et al. 2006), while the majority of SMA type IV patients do not show any detectable deletions in this gene (Zerres et al. 1995). The life expectancy of SMA type IV patients is not reduced.
Table 2: Proximal SMA is a clinically heterogenous disorder.
SMA type Age of onset Motor milestone achievements Life expectancy I
(Werdnig-Hoffmann) ≤ 6 months never able to sit or walk < 2 years II
(intermediate form) ≤ 18 months able to sit but never learn to walk youth to adulthood III
(Kugelberg-Welander) > 18 months able to sit and walk at one time slightly reduced IV
(adult form) > 30 years normal development normal
Due to the ongoing degeneration of α-motor neurons, motor milestones which have been achieved by a patient at one time may be lost again in the course of disease progression. In particular in SMA type I and II patients, weakness of the muscles involved in breathing and coughing increases the susceptibility for respiratory infections. Thus, respiratory insufficiency is the most frequent cause of death.
Although the clinical spectrum of onset and severity is broad, all autosomal-recessively inherited forms of proximal SMA are genetically homogenous (Gilliam et al. 1990). Siblings affected with SMA present identical courses of disease progression and are assigned to the same SMA type. The finding of siblings with discordant phenotypes is a very rare exception (Brahe et al. 1993; Rudnik-Schöneborn et al. 1994; Cobben et al. 1995; Hahnen et al. 1995; Wang et al. 1996; Helmken et al. 2003).
1.2 Molecular basis of proximal SMA
1.2.1 Mapping of the SMA region
In 1990, SMA types I, II and III were mapped by linkage analysis to one single region of about 10 cM on chromosome 5q (5q11.2-13.3) (Brzustowicz et al. 1990; Gilliam et al. 1990; Melki et al. 1990). The development of many new highly polymorphic markers during the following five years allowed the critical SMA locus to be refined to a size less than 1 Mb (Melki et al. 1993; Soares et al. 1993;
DiDonato et al. 1994; Melki et al. 1994; Wirth et al. 1994; Wirth et al. 1995). This region was shown to contain a highly complex genomic structure consisting of a duplicated and inverted DNA segment of about 500 kb (Lefebvre et al. 1995), which considerably hampered the construction of a uniform
TFNR GTF2H2c
BIRC1c
SMN2 SMN1
BIRC1t
GTF2H2t
5q13 cen 5q13 ter
SERF1B SERF1A HRAD17
centromeric telomeric
OCLNc OCLNt
physical map (Thompson et al. 1993; Melki et al. 1994; Lefebvre et al. 1995; Roy et al. 1995b). As we know nowadays, the SMA region is prone to de novo genomic rearrangements including unequal crossing-over, inter- and intrachromosomal rearrangements and gene conversions (Melki et al. 1994;
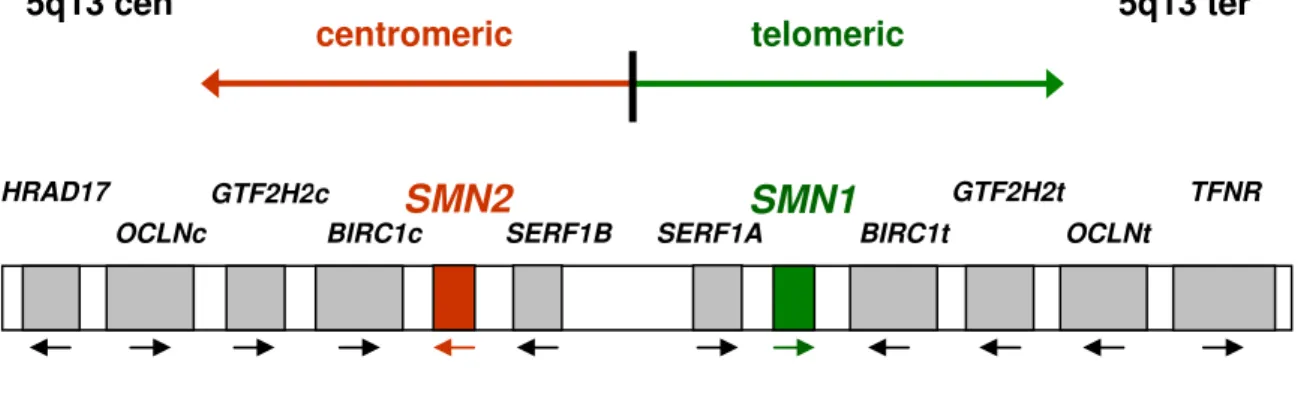
Wirth et al. 1997; Schmutz et al. 2004). Each of the two 500 kb segments can be present in 0 to 4 copies per chromosome and contains five genes which were assumed to be candidates for determination of SMA (figure 1): the survival motor neuron gene [SMN, (Lefebvre et al. 1995)], the baculoviral IAP repeat-containing protein 1 gene (BIRC1), also known as neuronal apoptosis inhibitory protein gene [NAIP, (Roy et al. 1995a)], the small EDRK-rich factor 1 gene [SERF1, (Scharf et al.
1998)], also known as H4F5, the general transcription factor IIH or p44 gene (GTF2H2) which encodes a subunit of the transcription factor TFIIH (Burglen et al. 1997; Carter et al. 1997), and the occludin gene [OCLN, (Lefebvre et al. 1995; Schmutz et al. 2004)]. The polymorphic region which contains the duplicated and inverted five candidate genes is proximally flanked by the unique gene RAD17 (Deimling von et al. 1999) and distally flanked by TFNR (Kelter et al. 2000).
Figure 1: Schematic of the duplicated and inverted SMA region on chromosome 5q13.
1.2.2 Survival motor neuron (SMN), the SMA determining gene in humans
In 1995, Lefebvre and colleagues identified the survival motor neuron gene 1 (SMN1) as the SMA determining gene (Lefebvre et al. 1995). Although each of the genes that are located in the SMA region may be deleted in SMA patients (Roy et al. 1995a; Burglen et al. 1997; Scharf et al. 1998), it has been conclusively demonstrated that only homozygous mutation of the telomeric SMN1 is causative for SMA. The ultimate proof was given by the identification of subtle (and in particular missense) mutations located in the SMN1 gene [reviewed in (Wirth 2000)]. The number of centromeric SMN2 copies modifies the disease severity (Lefebvre et al. 1995; Burghes 1997; Wirth et al. 1999;
Brahe 2000; Wirth 2000; Feldkötter et al. 2002; Mailman et al. 2002; Wirth et al. 2006).
On genomic level, each SMN copy spans a region of about 28 kb (Chen et al. 1998) and consists of nine exons (1-2a, 2b-8) with an open reading frame of 882 bp (294 codons). SMN1 and SMN2 are almost identical except for five nucleotide differences at their 3’ ends (figure 2): one in exon 7, one in exon 8, one in intron 6 and another two in intron 7, respectively (Lefebvre et al. 1995; Burglen et al.
1996; Chen et al. 1998; Monani et al. 1999a). Applying a PCR-based assay followed by restriction digestion or direct sequencing, the genomic differences allow molecular genetic diagnosics of SMA
(Lefebvre et al. 1995; van der Steege et al. 1995; Wirth et al. 1999). The vast majority of SMA type I-III patients (96%) show homozygous absence of SMN1 exon 7 and 8 or exon 7 only (Wirth 2000). This phenomenon is due to two mechanisms: deletions of SMN1 or gene conversion of SMN1 into SMN2 (Wirth et al. 1997). Deletions are typically observed in type I SMA patients. Conversions of SMN1 into SMN2 which result in an increased number of SMN2 genes are predominantly found in type II and III SMA patients. Gene conversion is a common mutational mechanism in the SMA region (Lefebvre et al. 1995; Hahnen et al. 1996; van der Steege et al. 1996). It may also cause the conversion of SMN2 into SMN1. In rare cases, it has been described as a de novo event (Raclin et al. 1997; Wirth et al.
1997; Wirth et al. 1999) and can affect the complete SMN gene as well as only a part of it. Besides homozygous absence of SMN1, a minority of SMA patients (~4%) exhibit intragenic SMN1 mutations which result in a disturbed gene function. Typically, these patients are compound heterozygotes with a deletion on one and a subtle mutation on the other chromosome 5 (Bussaglia et al. 1995; Lefebvre et al. 1995; Rodrigues et al. 1995; Hahnen et al. 1997; Simard et al. 1997; Wirth et al. 1999; Wirth 2000;
Ogino and Wilson 2002; Clermont et al. 2004; Sun et al. 2005). The presence of at least one fully functional SMN1 gene is sufficient to protect from SMA. Homozygous absence of SMN2, a genotype found in about 3-5% of control individuals, has no apparent phenotypical consequences (Lefebvre et al. 1995).
None of the five nucleotides which allows SMN1 and SMN2 to be distinguished on genomic level leads to an amino acid exchange on protein level. While the C to T transition in exon 7 is a silent mutation, the nucleotide exchange in exon 8 is located in the 3’ untranslated region of the SMN mRNA.
1.2.3 Alternative splicing of SMN transcripts
The roughly 1.5 kb SMN1 and SMN2 transcripts are ubiquitously expressed (Lefebvre et al. 1995).
However, subsequent processing of SMN1 and SMN2 pre-mRNA is markedly different (Gennarelli et al. 1995; Lefebvre et al. 1995) (figure 2). The disease determining SMN1 gene almost exclusively produces full-length transcripts (FL-SMN1) that contain each single exon (1-2a, 2b-8), whereas SMN2 undergoes alternative splicing and generates only 10% of FL transcripts (FL-SMN2) but 90% of transcripts that lack exon 7 (∆7-SMN2). In the FL transcripts, the translation termination codon is located at the end of exon 7. FL-SMN1 transcripts and FL-SMN2 transcripts code for an identical FL- SMN protein composed of 294 amino acids. The ∆7-SMN2 transcripts lack exon 7 and therefore encode a truncated SMN protein of only 282 amino acids. Skipping of exon 7 forces the translation machinery to use an alternative stop codon located in exon 8. Thus, a protein is generated with a C- terminus that lacks the 16 amino acids encoded by exon 7 but contains four amino acids encoded by exon 8. This truncated protein is biochemically unstable and shows a reduced oligomerization capacity which is essential for proper SMN function (Lorson et al. 1998; Lorson and Androphy 2000).
Additionally, both SMN genes produce very low amounts of alternatively spliced transcripts lacking exon 5 (∆5-SMN) or exon 3 (∆3-SMN) or exons 5 and 7 (∆5,7-SMN) (Gennarelli et al. 1995; Chang et al. 2001; Singh et al. 2006). Skipping of these exons leads to the synthesis of an SMN protein which is truncated but in frame. The loss of exon 3 is of particular interest, since the corresponding protein
SMN1
100% FL transcript
SMN2
10% FLtranscript 90% ∆7 transcript
Exon 1, 2a, 2b, 3- 6 Intron 6 Exon 7 Intron 7 Exon 8
C
T g
a
a a
g g
G
A
sequence contains a so-called Tudor domain that is essential for the interaction with Sm (Smith antigen) proteins (see chapter 1.2.5). Absence of the Tudor domain or the presence of missense mutations within the encoding genomic region either abolishes or reduces the ability of SMN to interact with Sm proteins (Buhler et al. 1999; Mohaghegh et al. 1999; Sun et al. 2005).
Figure 2: The genomic sequences of SMN1 and SMN2 are almost identical except for five nucleotide variants: one in intron 6 (44 bp upstream of exon 7: c.835-44G>A), one in exon 7 (bp number 6: c.840C>T), two in intron 7 (100 bp downstream of exon 7: c.888+100A>G, and 214 bp downstream of exon 7:
c.888+214A>G), and one in the 3’ untranslated region in exon 8 (bp 234: c.1121G>A). In contrast to SMN1 which mainly produces FL transcripts, SMN2 undergoes alternative splicing of exon 7 and generates only minor amounts of a FL transcript, but large numbers of truncated ∆7 transcripts.
1.2.4 Splicing regulation of SMN exon 7
SMN exon 7 spans 54 nucleotides and harbors a translation termination codon at positions 49 to 51.
The last nucleotide at the exon/intron border is an adenosine residue, which places exon 7 into the minor group of internal exons lacking a guanosine residue at the 3’-end (Burge et al. 1999). Exon 7 is characterized by a weak 3’ splice site due to a suboptimal polypyrimidine tract (Lim and Hertel 2001).
Correct splicing of exon 7 depends on a number of cis-acting elements (splicing enhancers and silencers) that are localized within exon 7 itself and the adjacent introns 6 and 7. They are recognized by various trans-acting splicing factors which belong to the family of serine(S)–arginine(R)–rich proteins (SR and SR-like proteins) as well as to the family of heterogeneous nuclear ribonucleoproteins (hnRNPs) (Lorson et al. 1999; Hofmann et al. 2000; Lorson and Androphy 2000;
Cartegni and Krainer 2002; Hofmann and Wirth 2002; Miyajima et al. 2002; Young et al. 2002b;
Kashima and Manley 2003; Miyaso et al. 2003). Most of these elements seem to be highly conserved and also play a role in processing of the murine Smn pre-mRNA (DiDonato et al. 2001).
In 1999, it was demonstrated that only the C to T transition in SMN2 exon 7 is responsible for skipping of this exon in the majority of SMN2 transcripts, regardless of the cell type or tissue that was
investigated (Lorson et al. 1999). Subsequent studies by Cartegni et al. revealed that the C to T exchange disrupts the conserved heptamer motif of an exonic splicing enhancer (ESE). In SMN1 transcripts, this ESE is recognized directly by the SR-rich splicing factor SF2/ASF. Binding of SF2/ASF to SMN1 exon 7 facilitates the generation of FL transcripts. However, the altered ESE sequence in SMN2 derived transcripts fails to recruit SF2/ASF leading to inefficient exon 7 inclusion (Cartegni and Krainer 2002). In contrast to these findings, Kashima et al. demonstrated that the C to T exchange in SMN2 creates a new exonic splicing silencer (ESS) for the repressor protein hnRNP A1 rather than disrupting an ESE for SF2/ASF (Kashima and Manley 2003). Binding of hnRNP A1 to the ESS in SMN2 exon 7 results in skipping of this exon. It was shown that the reduction of hnRNP A1 by RNA interference in HeLa cells promotes exon 7 inclusion into SMN2 RNA. Moreover, by using in vitro UV cross-linking, hnRNP A1 was found to bind exon 7 of SMN2 but not of SMN1. In 2006, results obtained from further extensive testing of the enhancer-loss and the silencer-gain models were presented by Cartegni et al. (Cartegni et al. 2006). They support the hypothesis of the enhancer-loss model and confirm that SMN2 exon 7 skipping primarily results from the loss of the SF2/ASF- dependent ESE. It was found that hnRNP A1 indeed has a strong inhibitory effect on exon 7 inclusion, but this observation is independent of the C to T transition and, therefore, an indirect event not specific to SMN2. The finding that SF2/ASF and hnRNP A1 antagonize each other is well known (Eperon et al.
2000; Zhu et al. 2001; Black 2003) and may cause tissue-specific differences in the extent of exon 7 inclusion based on the relative concentration of these two proteins.
Furthermore, an investigation of the first 16 nucleotides of SMN2 exon 7 revealed that the 5’ end of this exon contains a so-called extended inhibitory context (Singh et al. 2004a; Singh et al. 2004b).
This context covers a larger sequence than the disrupted SF2/ASF-ESE and hnRNP A1-ESS. The abrogation of this inhibitory context promotes exon 7 inclusion even in the absence of the SF2/ASF binding motif as well as the presence of the hnRNP A1 binding site. Another inhibitory tract consisting of seven nucleotides was found near the 3’ end of exon 7 (Singh et al. 2004b).
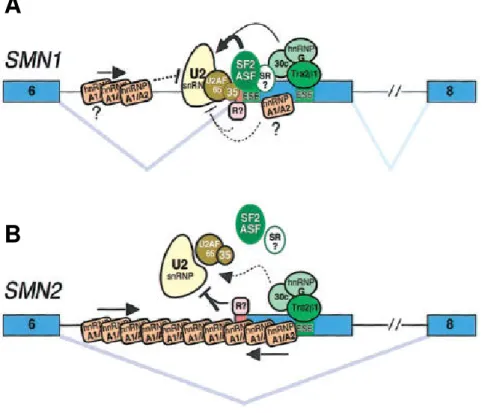
In addition to the 5’ end ESE and ESS, another GA-rich ESE is localized in the center of exon 7 of SMN1 and SMN2 (Lorson and Androphy 2000). This ESE binds the SR-like splicing factor Htra2-β1, the ortholog of Drosophila melanogaster transformer-2 (Tra2) (Hofmann et al. 2000). In Drosophila, Tra2 is essential for the regulation of sex-differentiation by alternative splicing (Baker 1989). Mutations in the ESE in the center of exon 7 abolish the capacity of SMN1 to produce correctly spliced transcripts (Lorson and Androphy 2000). In addition, the SR protein SRp30c as well as hnRNP G and RBM (belonging to the group of hnRNPs) directly bind Htra2-β1 and further enhance the inclusion of exon 7 (Hofmann and Wirth 2002; Young et al. 2002b). This network of splicing factors binding to the central ESE in exon 7 is most likely responsible for the 10-15% of FL mRNA generated by SMN2. Over-expression of these splicing factors either separate or in combination restores the splicing capacity of SMN2 minigenes up to 80% and substantially increases endogenous SMN protein levels (Hofmann et al. 2000; Hofmann and Wirth 2002; Young et al. 2002b). In consideration of the regulatory proteins known so far, figure 3 displays two models which summarize the splicing of exon 7 in SMN1 and SMN2 pre-mRNA.
Alternative splicing of SMN2 exon 7 is furthermore regulated by an intronic splicing silencer localized in intron 6 (element 1; 112 to 68 bp upstream of exon 7) and by an intronic splicing enhancer localized in intron 7 (element 2; 59 to 72 bp downstream of exon 7) (Miyajima et al. 2002; Miyaso et al. 2003).
However, deletion or mutation of these elements does not affect the correct splicing of wild-type SMN1 pre-mRNA, suggesting that their function depends on the presence of the C to T transition in SMN2 exon 7. A 33 kDa protein has been shown to interact with element 1 of SMN2 but not of SMN1. Element 2 in intron 7 possesses a characteristic stem-loop structure, in which correct matching of the nucleotides within the stem is essential. Data base analysis revealed matching of the nucleotide sequence of the stem-loop structure to intronic sequences of several other genes, however, the experimental proof for a role in the regulation of splicing still has to be given.
Figure 3: Model for the impact of the SMN2 C to T transition on splicing of exon 7 in SMN pre-mRNA (Cartegni et al. 2006). (A) In SMN1, binding of U2 snRNP and efficient splicing of exon 7 is due to binding of SF2/ASF to the ESE at the 5’ end of the exon which contains the C at position +6. Further splicing factors (Htra2-β1, SRp30c, hnRNP G, and yet unknown proteins termed “SR?”) binding to enhancer motifs localized downstream additionally promote exon 7 inclusion and the generation of FL transcripts.
This network of splicing proteins prevents an inhibitory action of hnRNP A1 and/or additional repressor proteins (“R?”) on SMN1 exon 7 splicing. (B) In contrast to the SMN1 context, the C to T nucleotide exchange and abrogation of the ESE for SF2/ASF in SMN2 allows a markedly increased inhibitory effect of hnRNP A1 and/or further suppressors termed “R?”. Thus, exon 7 is skipped in the majority of SMN2 transcripts. This inhibitory effect can not be overcome by the remaining positive elements which are still able to bind downstream in exon 7, except they are over-expressed.
Very recently, another inhibitory element was discovered in intron 7 (Singh et al. 2006). The element was called intronic splicing silencer N1 (ISS-N1) and is located 10 to 24 bp downstream of exon 7.
ISS-N1 is not present in mouse Smn and therefore evolutionary nonconserved. Deletion or mutation of ISS-N1 resulted in the correction of the pathologic SMN2 splicing such that substantially increased amounts of FL transcript and a splicing pattern similar to that of SMN1 were obtained.
A
B
The existence of different SMN genes that are differently spliced is specific for humans. Mice and rats carry only one Smn gene and primates have several SMN gene copies, however, non of these genes is subject to alternative splicing and therefore they represent orthologs of the human SMN1 (DiDonato et al. 1997; Rochette et al. 2001).
1.2.5 The SMN protein
The SMN protein consists of 294 amino acids, is ubiquitously expressed and has a molecular weight of 38 kDa. Investigations of adult human tissue revealed high SMN protein levels in spinal cord, kidney, liver and brain, whereas skeletal and cardiac muscle tissues, fibroblasts and lymphocytes presented lower expression levels (Coovert et al. 1997; Lefebvre et al. 1997). A comparison of SMN expression in various human fetal and postnatal tissues reveaIed that protein levels markedly decrease during the postnatal period, suggesting a requirement of high SMN levels during embryo- fetal development (Burlet et al. 1998). A similar expression pattern and developmental regulation of Smn, the counterpart to human SMN, was observed in rats and mice (Battaglia et al. 1997; Bergin et al. 1997; La Bella et al. 1998; Jablonka et al. 2000). Postnatal down-regulation of the murine Smn protein has recently been attributed to a decreased acetylation of histone proteins associated with the Smn promoter which in part results in silencing of Smn expression (Kernochan et al. 2005).
The SMN protein localizes both in the nucleus and the cytoplasm. Immunostaining of various cell types demonstrated that cytoplasmic distribution of SMN is diffuse, whereas it is found in prominent dot-like structures in the nucleus (Liu and Dreyfuss 1996; Coovert et al. 1997; Burlet et al. 1998).
These SMN-containing structures are often observed in close proximity to or completely overlapping with the coiled bodies [also Cajal bodies; nuclear domains that are enriched in spliceosomal U snRNPs (Fakan et al. 1984)], and therefore are termed gemini of coiled bodies (gems) (Liu and Dreyfuss 1996; Liu et al. 1997; Young et al. 2000).
FL-SMN1 and FL-SMN2 transcripts encode an identical SMN protein. Thus, both genes SMN1 and SMN2 contribute to the amount of functional SMN protein present in each cell (Coovert et al. 1997;
Lefebvre et al. 1997). However, due to the skipping of exon 7 during pre-mRNA splicing, SMN2 produces only minor amounts of FL-SMN protein but predominantly generates a truncated, unstable
∆7-SMN2 protein (Lorson et al. 1998; Lorson and Androphy 2000). Consequently, SMN2 is unable to compensate for the homozygous loss of SMN1 in SMA patients, resulting in a lack of functionable SMN protein. This has been confirmed by several studies which demonstrated that SMA patients show substantially lower SMN levels in lymphoblastoid cell lines, fibroblasts, liver, muscle and spinal cord than control individuals (Coovert et al. 1997; Lefebvre et al. 1997; Helmken et al. 2003).
Moreover, the number of gems was found to be decreased in subjects affected by SMA.
SMN forms large multi-subunit macromolecular complexes of ~1MDa that contain numerous SMN- interacting proteins. The components of the SMN complex are divided into two subgroups. A set of at least seven proteins associate with the SMN complex in a stable and stoichiometric manner. They are termed ‘core components’. Because they colocalize with SMN in the gems in the nucleus, they are also called ‘Gemins2-8’. In addition to these core components, another set of interacting partners associates transiently or in a substoichiometric manner with the SMN complex including the Sm
proteins which form part of the U snRNPs that are involved in pre-mRNA splicing. A comprehensive overview of the SMN complex components known so far is given in table 3. In figure 4, a model for the complex of SMN and the core components is presented. In addition to the ability of SMN to bind other proteins, it is also known that SMN binds nucleic acids (Lorson and Androphy 1998; Bertrandy et al.
1999).
Figure 4: The SMN protein forms a functional entity termed SMN complex. The major protein components have been grouped as Gemins2-8, and a factor termed unrip. SMN binds directly to Gemin2, Gemin3, Gemin5, and Gemin7. The interactions of Gemin3 with Gemin4 and of Gemin7 with Gemin6 mediate the close association of these two proteins with the SMN complex. Gemin8 and unrip are bound to the complex via direct interaction with the Gemin6-Gemin7 heterodimer. The precise stoichiometry of the SMN complex components is not known so far, and with regard to this aspect figure 4 remains a model.
The SMN protein is involved in several essential cellular processes. There are seven main functions of the protein known so far:
1. The SMN complex catalyzes the assembly of spliceosomal U snRNPs (uridine-rich small nuclear ribonucleoprotein particles). U snRNPs are composed of one (U1, U2, and U5) or two (U4 and U6) uridine-rich RNAs and characteristic sets of proteins (Will and Luhrmann 2001).
Together with other non-snRNP proteins (Jurica and Moore 2003), the U snRNPs form the subunits of the spliceosome, which is the macromolecular machinery that promotes and controls the splicing of pre-mRNAs. During the splicing process, U snRNPs are responsible for the recognition and activation of intronic sites for splicing (Blencowe 2000). The core structure of the U snRNPs is formed by the transfer of seven Sm proteins, which are common to all spliceosomal U snRNPs, onto the U snRNA molecule. In several studies, it has been demonstrated that this process requires the assistance of the SMN complex in vivo (Meister et al. 2001; Meister and Fischer 2002; Pellizzoni et al. 2002). Moreover, the SMN complex is also able to promote the maturation of other snRNPs such as U7 snRNP which is involved in histone-mRNA processing rather than pre-mRNA splicing, assigning the SMN complex with the potential role of ‘master RNP assembler’ (Terns and Terns 2001; Pillai et al. 2003).
2. Several studies suggest that SMN has a crucial function as recycling factor that regenerates U snRNPs after splicing catalysis and thus maintains the U snRNPs in an active form (Pellizzoni et al. 1998; Meister et al. 2000; Mourelatos et al. 2001).
Gemin6 Gemin7
Gemin2
Gemin2 Gemin2
SMN SMN SMN Gemin3
Gemin4
Gemin5
unrip Gemin8
Gemin6 Gemin6 Gemin7 Gemin7
Gemin2 Gemin2
Gemin2
Gemin2 Gemin2Gemin2