T-plastin, a cytoskeletal protein with important function in axonal growth, acts as a modifier of spinal muscular atrophy
Inaugural-Dissertation zur
Erlangung des Doktorgrades
der Mathematisch-Naturwissenschaftlischen Fakultät der Universität zu Köln
vorgelegt von Gabriela-Elena Oprea,
geborene Bordeianu aus Bukarest
2007
Doctoral Thesis "Identification of T-plastin as Gene Modifier in SMA Discordant Families" was performed primarily at the Institute of Human Genetics, University of Bonn from september 2002 to march 2004 and at the Institute of Human Genetics, University of Cologne from march 2004 to 2007.
The microarray analysis was performed at the Institute of Genetics and Centre for Molecular Medicine Cologne, and the genome scan analysis as well as all pyrosequences, were performed at the Cologne Centre for Genomics (CCG). The confocal imaging was performed at the Institute for Biochemistry I, University of Cologne and at the Centre for Molecular Medicine University of Cologne (CMMC).
Berichterstatter/in Prof. Dr. rer.nat. Brunhilde Wirth Prof. Dr. rer. nat. Diethard Tautz
Tag der letzten mündlichen Prüfung: 5 Juni 2007
For my dear husband, Costy .
ACKNOWLEDGEMENTS
There are lots of people I would like to thank for a huge variety of reasons.
Firstly, I would like to thank my Supervisor, Prof. Dr. Brunhilde Wirth for giving me the opportunity to work in her group and for her encouragement all through my doctoral studies. I could not have imagined having a better advisor and mentor for my PhD.
Thank-you to my examiners, Prof. Dr. Diethard Tautz and Prof. Dr. Helmut Klein.
I hearthly thank Prof. Dr. Peter Nürnberg and Gudrun Nürnberg for the wonderful collaboration and help on the genome-wide scan analysis; to Prof. Dr. J. L. Schultze and Dr. Svenia Debey with the excellent help on microarray analysis and data interpretation.
I would like to deeply thank to all past and present members of the “SMA group”, especially to Sandra Kröber for her brilliant technical assistance, Frank Schönen for his kind help whenever asked, Heidrun Raschke for introducing me into the cell culture “world” and for her friendship, Markus Riessland for helpful and stimulating discussions and comments on the draft, Maike Warnstedt for critical reading the draft and for the huge help with German language whenever needed, to Irmgard Hölker for her friendship, good advice and encouragement, specially in hard moments.
I especially thank to Mohammad Reza Tolliat for his excellent assistance with pyrosequencing.
I am grateful to Dr. Francisco Rivero-Crespo for his advice in immunofluorescent experiments and for his kind help in handling the confocal microscope.
I would like to say a big “thank-you” to Dr. Ramirez Alfredo for his help in establishing the setup for measuring axons length and whenever a question concerning fluorescence microscopy asked.
I especially thank Nina Dalibor and Oddette Mukabayire-Kramer for their friendship, good advice and encouragement.
I also warmly thank to all Romanian friends for their great support, encouragements, help, for wonderful holidays and for remanding me how active and full of surprises Romanian people are. I’ve missed you a lot, gays.
The heartiest gratitude goes to my family for wonderful support and encouragements.
On a different note, I would like to thank the coffee producers for keeping me thinking and for making me feel okay about drinking so much coffee.
Finally, I owe my warmest thanks to my “male team” at home, my husband Costy, for his encouragement, throughout the whole course of my work, for his help to keep my foot always firmly on the ground. I will always love you.
Thank you, and Be Well and Happy!
TABLE OF CONTENTS
I
TABLE OF CONTENTS
TABLE OF CONTENTS
LIST OF ABBREVIATIONS
1. INTRODUCTION.………..1
1.1. Clinical and pathological features of spinal muscular atrophy………2
1.2. Survival motor neuron (SMN) gene.……….3
1.3. Gene conversion, deletion and de novo mutations……….6
1.4. Survival motor neuron transcripts....………...7
1.5. The SMN protein and its functions……….10
1.5.1. SMN complex………13
1.5.2. Motor neuron specific functions of the SMN protein………...19
1.5.3. Regulation of the SMN protein during development and cellular differentiation………….25
1.6. Animal models of SMA………..26
1.7. Therapeutic prospects of SMA………27
1.8. SMA discordant families………...30
2. AIMS……….35
3. SUBJECTS AND MATERIALS………36
3.1. Patients samples……….36
3.2. Biological samples……….37
3.3. Equipment………37
3.4. Chemicals……….39
3.5. Kits………..39
3.6. Reagents, enzymes and additional supplies for cell culture procedures…40 3.7. Primary antibodies………..41
3.8. Secondary antibodies………41
3.9. Solutions and media………...41
3.9.1. Frequently used buffers and solutions………..41
TABLE OF CONTENTS
II
3.9.2. Media for eukaryotic and tissue culture procedures……….46
3.9.3. Media for prokaryotic cells………47
3.10. Software and databases………..47
3.11. Primers and siRNAs………..48
4. METHODS………57
4.1. Prokaryotic cells………..57
4.1.1. Bacteriology………...57
4.1.2. Transformation of bacteria by heat-shock……….57
4.2. Eukaryotic cells………58
4.2.1. Cell culture……….58
4.2.1.1. EBV transformation of peripheral blood lymphocytes………..58
4.2.1.2. EBV-transformed lymphoblastoid cell culture………58
4.2.1.3. Human fibroblasts cell culture………..59
4.2.1.4. HEK293 cell culture………59
4.2.1.5. PC12 cell culture……….59
4.2.1.6. PC12 differentiation: treatment of PC12 cells with NGF………..60
4.2.1.7. Cell harvesting and freezing……….60
4.2.1.8. Cell thawing and recovering………...60
4.3. DNA techniques………61
4.3.1. Plasmid preparation (Mini prep) using Quantum Prep® Plasmid MiniPrep Kit (Bio-Rad)……….61
4.3.2. DNA isolation from fresh blood………61
4.3.3. DNA isolation from cell culture……….……62
4.3.4. DNA electrophoresis……….62
4.3.4.1. Agarose gel……….62
4.3.4.2. Sequencing gel………...62
4.3.5. Construction of gene constructs and DNA cloning………..63
4.3.6. Sequencing………64
4.3.6.1. Big-Dye sequencing………..64
4.3.6.2. Clean-up of dye-terminator sequencing reactions………64
4.3.6.3. Pyrosequencing………..65
4.3.7. DNA modification: bisulfite treatment……….66
4.3.8. DNA amplification………..67
TABLE OF CONTENTS
III
4.3.8.1. Polymerase chain reaction (PCR)………67
4.3.8.2. Reverse-transcription PCR (RT-PCR)……….68
4.3.8.3. Multiplex PCR………..68
4.3.8.4. Nested PCR……….68
4.3.8.5. PCR of bisulfite treated DNA………69
4.3.8.6. PCR for genotyping………70
4.3.9. PCR products purification……….70
4.3.10. DNA quantification by spectrophotometry……….70
4.3.11. DNA extraction from agarose gels……… 71
4.3.12. DNA-protein interaction……….71
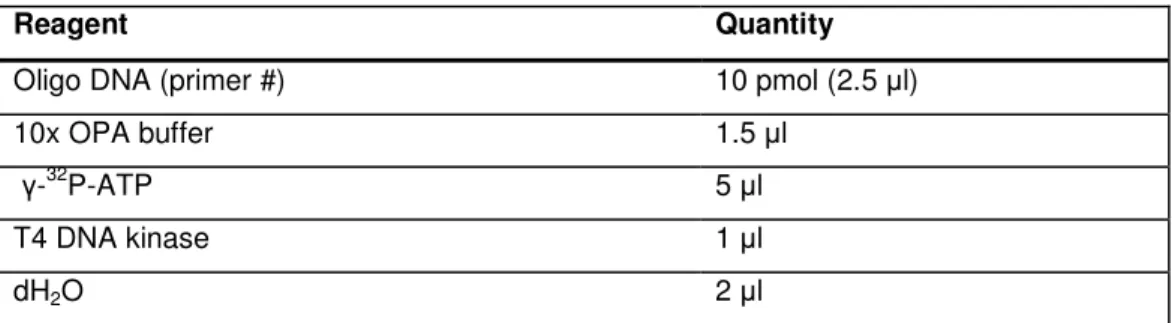
4.3.12.1. 32P labelling of oligonucleotide probe………71
4.3.12.2. In vivo footprinting………72
4.3.12.2.1. Genomic DNA isolation………...72
4.3.12.2.2. Piperidine cleavage………..73
4.3.12.2.3. Ligation-mediated PCR (LM-PCR)………73
4.4. RNA techniques………75
4.4.1. RNA isolation………..75
4.4.1.1. RNA isolation from fresh blood……….75
4.4.1.2. TRIzol method for RNA isolation from cell culture……….75
4.5. Autoradiography………..76
4.6. Protein biochemistry………..76
4.6.1. Protein isolation, expression and purification………..76
4.6.1.1. Bacterial overexpression: expression and purification of SMN-GST fusion protein……….76
4.6.1.2. Expression of T-plastin protein in the TNT® T7 Quick Coupled Transcription/Translation Reaction (Promega)……….77
4.6.1.3. Protein isolation from fresh blood………78
4.6.1.4. Protein isolation from cell culture using RIPA buffer (fibroblasts, EBV-transformed lymphoblastoid cell lines, HEK293 cells, PC12 cells)………..78
4.6.1.5. Protein isolation from cell culture using IP buffer (HEK293 cells, PC12 cells)…..…..78
4.6.2. Protein quantification by spectrophotometry (Bradford assay)………..78
4.6.3. Generation of polyclonal antibody against T-plastin………79
4.6.4. Protein analysis……….79
4.6.4.1. SDS-PAGE electrophoresis……….79
4.6.4.2. Antibodies………80
TABLE OF CONTENTS
IV
4.6.4.3. Protein transfer………81
4.6.4.4. Western blot……….82
4.6.5. Protein-protein interaction………82
4.6.5.1. Co-immunoprecipitation……….82
4.6.5.2. Magne GSTTM Pull-Down assay………...82
4.7. Cell transfection………...83
4.7.1. Transient transfection of T-plastin-V5-tagged plasmid in HEK293 and PC12 cells………83
4.7.2. Transient transfection of T-plastin siRNA oligos into PC12 cells………..84
4.7.3. Co-transfection of T-plastin-V5-tagged plasmid DNA and SMN siRNA oligos into PC12 cells………...84
4.8. Cell imaging………..85
4.8.1. Immunocytochemistry (ICC)……….85
4.8.2. Confocal scanning fluorescence microscopy………....86
4.8.3. Non-confocal fluorescence microscopy……….86
4.8.4. Measurement of neurite outgrowth……….86
4.9. Microarray analysis……….86
4.9.1. RNA Cleanup with RNeasy MinElute Cleanup Kit (Qiagen)………...87
4.9.2. Quantification and analysis of purity of RNA……….87
4.9.3. Synthesis of double stranded cDNA from total RNA………88
4.9.3.1. First strand cDNA synthesis……….88
4.9.3.2. Second strand cDNA synthesis………88
4.9.3.3. Clean-up of double stranded cDNA with Sample Cleanup Module (Affymetrix)……..88
4.9.4. Synthesis and purification of biotin labelled cRNA………...89
4.9.4.1. Synthesis of biotin labelled cRNA………89
4.9.4.2. cRNA cleanup with Sample Cleanup Module (Affymetrix)………..89
4.9.4.3. Quantifying the cRNA (IVT: in vitro transcription-product)………..90
4.9.4.4. Checking unfragmented samples on gel electrophoresis………90
4.9.5. Fragmenting cRNA for target preparation……….90
4.9.6. Target hybridization………..90
4.9.7. Microarrays……….91
4.9.8. Fluidic station set up and experimental procedure………..91
4.9.8.1. Preparing fluid station………92
4.9.8.2. SAPE staining solution………..92
4.9.8.3. Antibody solution mix……….92
TABLE OF CONTENTS
V
4.9.8.4. Scanning the microarray………93
4.9.9. Array profile……….93
4.9.9.1. Instrument / software requirements……….93
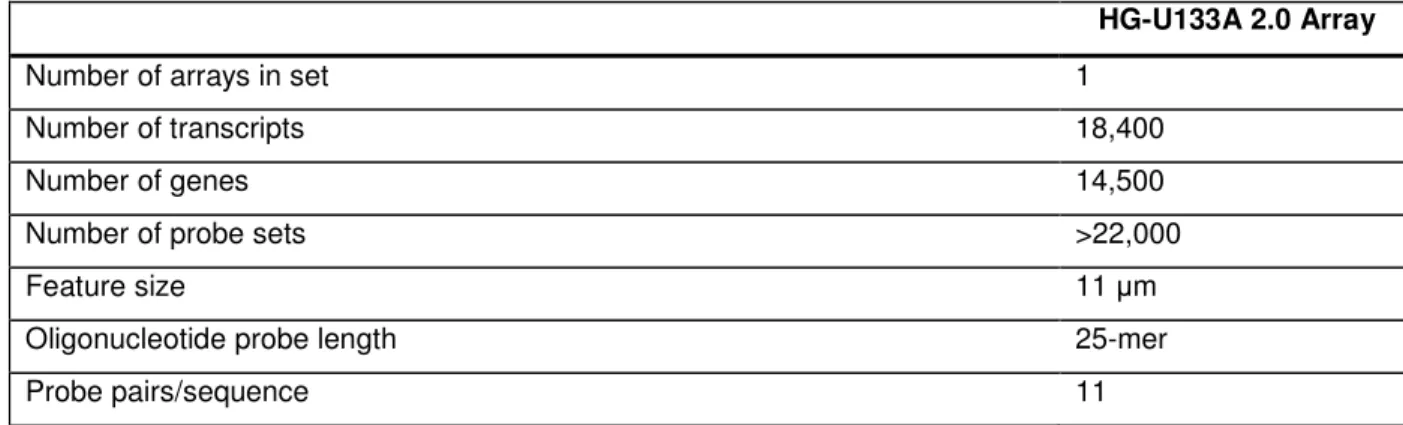
4.9.9.2. Critical specification for HG-U133A 2.0 array………93
4.9.10. Probe array image inspection………..94
4.9.11. Average background and noise values………..94
4.9.12. B2 oligo performance………94
4.9.13. Poly-A controls: dap, lys, phe, thr, trp……….94
4.9.14. Hybridization controls: bioB, bioC, bioD and cre………..95
4.9.15. Internal controls genes………..95
4.9.16. Percent genes present………..95
4.9.17. Scaling and normalization factors………...95
4.9.18. Single array analysis……….95
4.9.18.1. Detection algorithm………..96
4.9.18.2. Detection p-value……….96
4.9.18.3. Detection call………96
4.9.18.4. Signal algorithm………96
4.9.19. Comparison analysis (experiment vs. baseline arrays)………...97
4.9.19.1. Change algorithm……….97
4.9.19.2. Change p-value………98
4.9.19.3. Change call………98
4.9.19.4. Signal Log Ratio algorithm………..98
4.9.19.5. The logic of logs………98
4.9.19.6. Basic data interpretation……….99
4.9.19.7. Interpretation of metrics………..99
4.9.20. Online informatics resource………...100
4.9.21. Data analysis and software………100
4.10. Genome scan analysis………..100
4.10.1. Arrays………100
4.10.2. Statistical analysis………...101
4.10.2.1. Non-parametric linkage analysis using MERLIN software………..101
4.10.2.2. Parametric linkage analysis ……….101
4.11. Additional statistical methods……….102
TABLE OF CONTENTS
VI
5. RESULTS………..103
5.1. Search for SMA modifying factor(s) by candidate gene approach……….103
5.1.1. Selection of candidate genes………103
5.1.2. Selection of ZNF265 gene………103
5.1.3. Molecular analysis of ZNF265 gene in SMA discordant families………104
5.1.4. Selection of hnRNP-R gene………..105
5.1.5. Molecular analysis of hnRNP-R at DNA and RNA level………163
5.1.6. Selection of HDAC6 gene………..173
5.1.7. Testing of DNA polymorphism in HDAC6 gene………..108
5.2. Search for SMA modifying genes by differential expression using Affymetrix microarray technology………108
5.2.1. The microarray screen for EBV-transformed lymphoblastoid cell RNAs revealed up- and down-regulated genes in asymptomatic vs. symptomatic sibs in SMA discordant families………...109
5.2.2. Gene selection……….111
5.2.3. Confirmation of microarray data by semi-quantitative RT-PCR ………..113
5.2.4. Validation of microarray-based results in another four SMA discordant families ……….114
5.2.5. Description of NR1I3 candidate……….115
5.2.6. Description of T-plastin candidate……….116
5.3. T-plastin, a potential gene modifier in SMA discordant families…………..121
5.3.1. T-plastin and SMN transcripts are expressed at high level in spinal cord and muscles ……….121
5.3.2. Characterization of T-plastin antibody ……….123
5.3.3. T-plastin is expressed in both EBV-transformed lymphoblastoid cells and fresh blood belonging to unaffected sibs SMN1-deleted………...124
5.3.4. T-plastin is expressed in 6.5 % in the control population ………..……..125
5.3.5. Validation of the significant difference of T-plastin expression between unaffected and affected sibs at protein level………...127
5.3.6. Functional analysis of T-plastin protein………127
5.3.6.1. SMN and T-plastin associate together in vivo, but do not interact directly………….127
5.3.6.2. Endogenous SMN co-localizes with V5-tagged T-plastin in the perinuclear area of HEK293 cells………130
5.3.6.3. T-plastin and SMN levels increase under NGF stimulation in PC12 cells…………..131
5.3.6.4. The affinity of T-plastin for SMN increases during neurite outgrowth………..133 5.3.6.5. Endogenous T-plastin and SMN co-localize along neurites and at the
TABLE OF CONTENTS
VII
growth cone level in PC12 cells-derived neurons………134
5.3.6.6. T-plastin-depleted PC12 cells exhibit a significant reduction in neurite length……..137
5.3.6.7. T-plastin overexpression in PC12 cells leads to an increase in size of the neurites………138
5.3.6.8. T-plastin overexpression is able to rescue partially the neurite length in SMN-depleted PC12 cells………...142
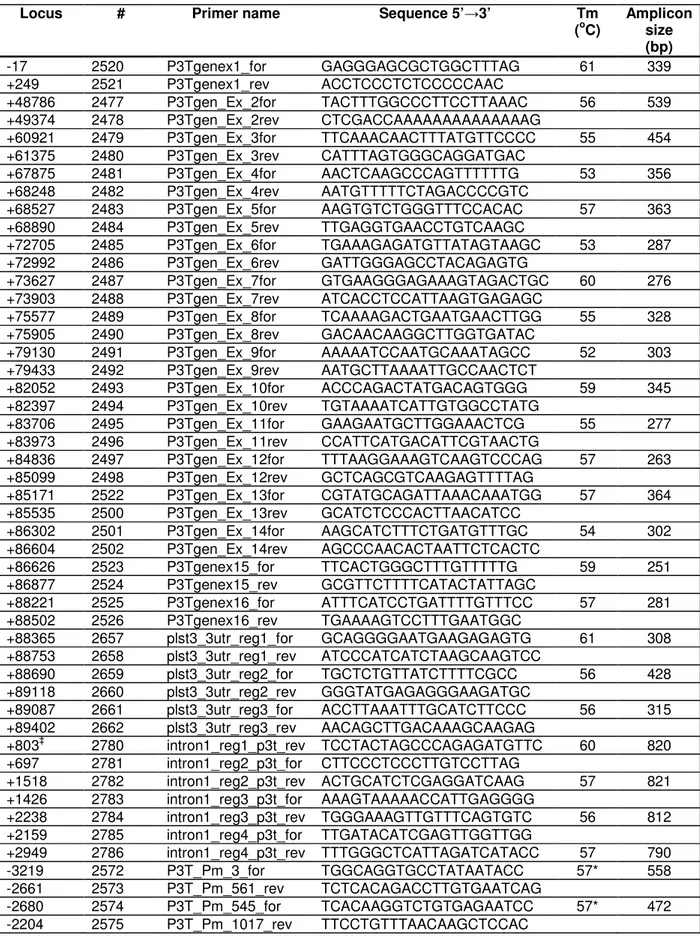
5.3.6.9. Molecular analysis of T-plastin coding region, promoter, 3’UTR and intron 1...…….144
5.3.7. Expression analysis of T-plastin gene………..144
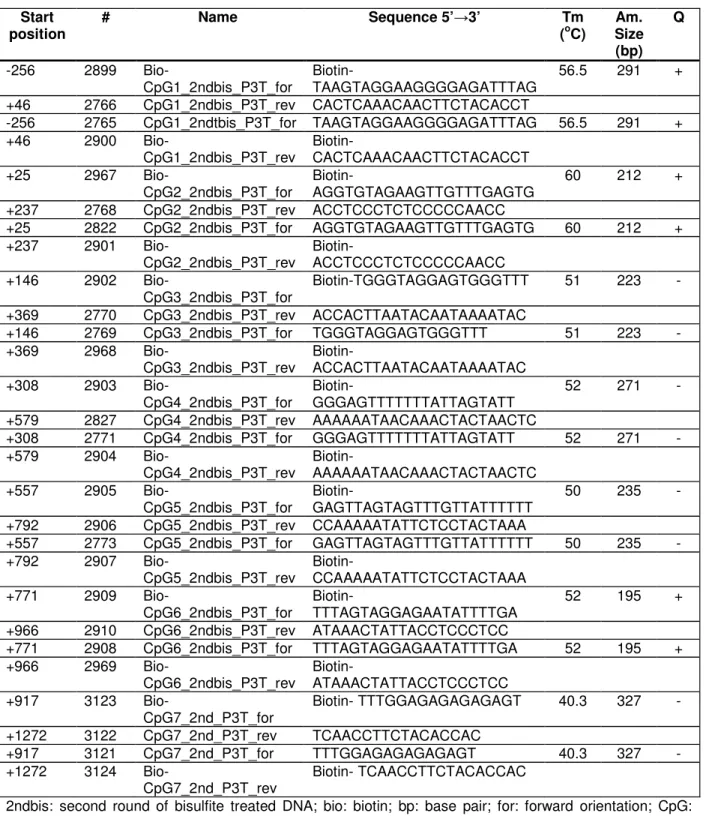
5.3.7.1. T-plastin CpG island: quantitative evaluation of methylation levels using pyrosequencing………....145
5.3.7.2. In vivo footprinting of T-plastin enhancer in EBV-transformed lymphoblastoid cells of SMA discordant families……….147
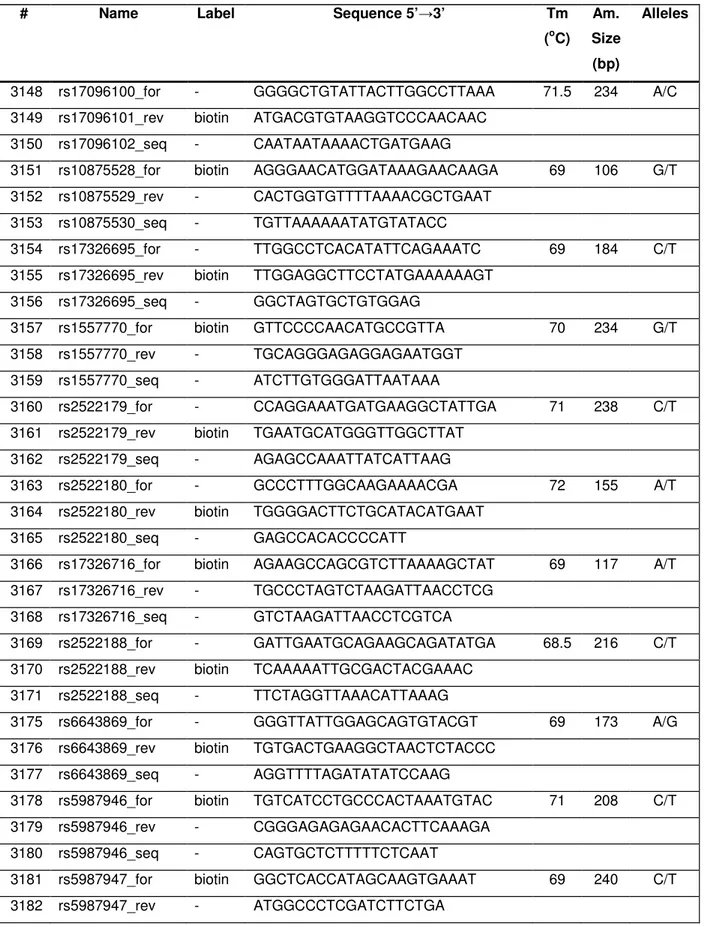
5.3.7.3. Haplotype analysis of the T-plastin genomic region revealed a trans-acting mechanism to regulate its expression………...…149
5.4. Search for modifying genes by genome-wide scan analysis………153
5.4.1. Power simulation of the genome scan analysis………..………153
5.4.2. Non-parametric linkage data interpretation……….154
5.4.3. Parametric linkage data interpretation……….155
5.4.4. Gene organization into categories according to their molecular function………...156
6. DISCUSSION……….158
6.1. ZNF265, hnRNP-R and HDAC6 are not responsible for the phenotypic variability of the SMA discordant sibs……….158
6.2. T-plastin, a novel candidate gene detected by expression Profiling analysis………..156
6.3. T-plastin is expressed in all unaffected sibs that carry SMN1 deletion/mutation and in 6.5 % of the control population………..162
6.4. T-plastin in activated by a trans-acting factor………...163
6.5. T-plastin might play an important role during NMJ formation………..164
6.6. T-plastin and SMN form a novel axon-specific complex………164
6.7. T-plastin is involved in neurite-like extension formation in differentiated PC12 cells………..167
6.8. Genome-wide scan in SMA discordant families revealed
the evidence for new susceptibility loci………..168
TABLE OF CONTENTS
VIII
6.9. Future directions………171
7. SUMMARY……….173 8. ZUSAMMENFASSUNG………...175 9. PUBLICATIONS, LECTURES AND POSTER CONTRIBUTIONS…..177
9.1. ORIGINAL PUBLICATIONS
9.2. PRINTED LECTURE CONTRIBUTIONS 9.3. PRINTED POSTER CONTRIBUTIONS
10. REFERENCES……….178
APPENDIX
Figures:
I. F1 Pedigrees of the SMA discordant families II. F2 pcDNA 3.1_T-plastin_V5 vector map III. F3 Human T-plastin transcript
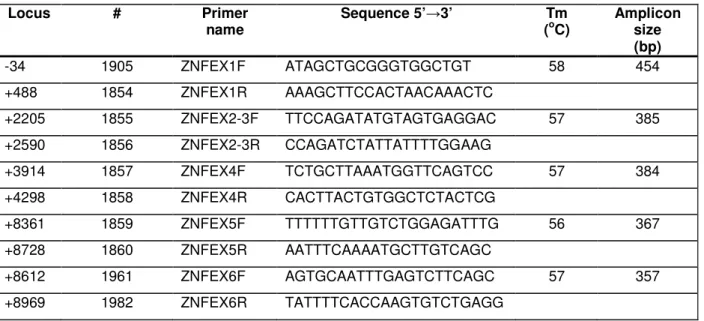
IV. F4 T-plastin genomic region
V. F5 T-plastin promoter-1st exon-1st intron (1 kb) region after bisulfite treatment VI. F6 T-plastin expression analysis by RT-PCR in 79 SMA patients
VII. F7 Simulation of the genome scan analysis under the assumption of recessive mode of inheritance
VIII. F8 Simulation of the genome scan analysis under the assumption of dominant mode of inheritance
IX. F9 Methylation status of T-plastin CpG sites in SMA discordant families X. F10 Methylation status of T-plastin CpG sites in two control groups XI. F11 Haplotype blocks within T-plastin genomic region
XII. F12 Motor axons defects in smn morphants are rescued by overexpression of human T-plastin RNA
TABLE OF CONTENTS
IX
Tables:
I. T1 Classical SMA patients checked for T-plastin expression
II. T2 Phenotypic and genotypic description of SMA discordant families used for genome- wide scan
III. *T3 Up-regulated transcripts detected by microarray analysis in SMA discordant families IV. *T4 Down-regulated transcripts detected by microarray analysis in SMA discordant
families
V. *T5 Up-regulated transcripts detected by microarray analysis in classical SMA patients VI. *T6 Down-regulated transcripts detected by microarray analysis in classical SMA
patients
VII. *T7 Susceptibility regions detected by the genome-wide scan analysis in SMA discordant families
VIII. *T8 Raw data for each chromosomal region detected by the genome-wide scan analysis
IX. *T9 Raw data for methylation analysis of T-plastin CpG island in two control populations X. *T10 Raw data for methylation analysis of T-plastin CpG island in SMA discordant
families
XI. *T11 Raw data for T-plastin haplotype blocks analysis
ERKLÄRUNG
CURRICULUM VITAE
*: The tables are contained in the attached CD-ROM.
LIST OF ABBREVIATION
X
LIST OF ABBREVIATION
aa A ABPs APS bp BSA C cDNA cM cm CNS DEPC D-MEM DMS DMSO DNA DTT EBV EDTA e.g.
EMG ER ESE ESS et al.
FBS FCS FL FITC FDA For FVC G g GSH GST
amino acid adenine
ammonium persulphate actin binding proteins base pair
bovine serum albumin cytosine
complementary DNA centimorgan
centimeter
central nervous system diethylpyrocarbonate
Dulbecco’s modified Eagle medium dimethyl sulphate
dimethylsulfoxide deoxyribonucleic acid dithiotreitol
Epstein-Barr virus
ethylenediaminetetraacetic acid exempli gratia
electromyography endoplasmic reticulum exonic splicing enhancer exonic splicing silencer et alii
fetal bovine serum fetal calf serum full length
fluorescein isothiocyanate Food and Drug Administration forward
forced vital capacity guanine
acceleration due to gravity glutathione
glutathione-S-transferase
LIST OF ABBREVIATION
XI
h HAT HDAC HMT HPRT ICC i.e.
IP IPTG ISS kb kDa l LD LMPCR M m Mb MBPs min ml mm mM mRNA NGF ng nm NMJs Nmol NPL nt OMIM PAGE PBS PCR PFA pH pmol
hour
histone acetyltransferase histone deacetylase histone methyltransferase
hypoxanthine phosphoribosyltransferase immunocytochemistry
id est
immunoprecipitation
isopropyl 1-thio-β-D-galactoside intronic splicing silencer
kilobases kilodalton liter
linkage disequilibrium ligation-mediated PCR molar
milli- megabases
methyl CpG binding proteins minute
millilitre millimeter millimolar messenger RNA nerve growth factor nanogram
nanometer
neuromuscular junctions nanomol
non-parametric linkage nucleotide
Online Mendelian Inheritance in Man polyacrylamide gel electrophoresis phosphate-buffered saline
polymerase chain reaction paraformaldehyde
power of hydrogen picomol
LIST OF ABBREVIATION
XII
PPi Rev RNA RNAi rpm RT SAHA SD SDS sDMA SGs siRNA SMA SMARD SMN SMN∆7 snoRNP snRNPs ss T TEMED UTR VPA versus µ µg µl µM µm
#
pyrophosphate reverse ribonucleic acid RNA interference revolutions per min reverse transcription
suberoylanilide hydroxamid acid standard deviation
sodium dodecyl sulphate
symmetrically dimethylated arginine stress granules
small interfering RNA
autosomal recessive spinal muscular atrophy SMA with respiratory distress
survival motor neuron
survival motor neuron protein lacking exon 7 small nucleolar ribonucleoproteins
small nuclear ribonucleoprotein splice site
thymine
N,N,N’,N’-tetramethylethylenediamine untranslated region
valproic acid vs.
micro- microgram microliter micromolar micrometer number
INTRODUCTION
1
1. INTRODUCTION
Spinal muscular atrophy (SMA) is an autosomal recessive neurodegenerative disease characterized by loss of lower motor neurons in the anterior horn of the spinal cord, accompanied by progressive wasting of associated muscles, and ultimately, paralysis. It is estimated to be the second most common autosomal recessive disease with an overall incidence of around 1 in 10,000 live births and a carrier frequency that may be as high as 1 in 35 (Cusin et al. 2003; Feldkotter et al. 2002). SMA exists in a broad spectrum ranking from very severe infantile to very mild chronic forms of the disease, and is conventionally classified into four groups (type I-IV) on the basis of age of onset and achieved motor milestones (Munsat and Davies 1992). The mutational mechanism behind SMA, in around 94 % of typical cases, is lack of SMN1 gene due to either SMN1 deletion or SMN1 to SMN2 conversion. Furthermore, around 35 different small intragenic mutations have been reported (Ogino and Wilson 2004; Sun et al. 2005; Wirth 2000).
SMN1 is located on chromosome 5q13 in a highly complex genetic region containing a variety of pseudogenes and repetitive elements due to an inverted duplication of approximately 500 kilobases. SMN is present in two versions, SMN1 (telomeric) and SMN2 (centromeric) which differ by only one nucleotide in the coding region. A transition of a cytosine to a thymine in SMN2 exon 7 alters the splicing pattern, creating a truncated transcript (SMN∆7) which encodes a non-functional protein lacking the last 16 residues at the C-terminal end. The truncated SMN2 isoform is less stable and has a reduced self- oligomerization activity (Lorson et al. 1998; Pellizzoni et al. 1998). As a consequence, the SMN2 gene produces reduced amounts of full-length SMN that cannot fully compensate the absence of SMN1, leading to specific degeneration of motor neurons in the spinal cord (Coovert et al. 1997; Lefebvre et al.
1997).
There are numerous other forms of spinal muscular atrophy which share certain characteristics with proximal SMA, however, they are genetically distinct and often affect different subsets of neurons and muscles. They include autosomal dominant forms of the disease (Sambuughin et al. 1998; van der Vleuten et al. 1998), X-linked forms (Kobayashi et al. 1995; La Spada et al. 1991), recessive forms that affect the distal muscles (Viollet et al. 2002), and a severe form of SMA with respiratory distress (SMARD) (Grohmann et al. 2001).
In contrast to proximal SMA, spinal muscular atrophy with respiratory distress (SMARD) type I has been linked to chromosome 11q13-q21 (Grohmann et al. 1999) with mutations in IGHMPP2 gene (Grohmann et al. 2001). In SMARD1 distal muscles and upper limbs are more affected than in SMA, and the major symptom is paralysis of the diaphragm (Grohmann et al. 1999). Spinal and bulbar muscular atrophy, also called Kennedy’s disease, is a rare, adult-onset form of motor neuron disease that is less common than proximal type I, II and III SMA. This X-linked form of spinal and bulbar muscular atrophy has a different genotype and is associated with CAG repeat mutations (La Spada et al. 1991).
Interestingly, in rare cases homozygous absence of the SMN1 gene in unaffected siblings of patients with SMA can be observed (Brahe et al. 1995; Cobben et al. 1995; Hahnen et al. 1995). The presence of phenotypic discordance in SMA families is rare, mainly female-specific and can be found in some 10 % of
INTRODUCTION
2
families with type III SMA and 1.2 % of families with type II SMA (Wirth 2002). The finding that homozygous deletion of SMN1 and identical SMN2 copy number present discordant phenotypes strongly implies that additional factors, except for SMN1 and SMN2, are influencing the SMA phenotypes.
1.1. Clinical and pathological features of spinal muscular atrophy
SMA was first described in the 1890s by Guido Werdnig of the University of Vienna and Johann Hoffman of Heidelberg University. Beginning with Byers and Banker (Byers and Banker 1961) the classification of SMA according to severity was used to facilitate prognostication. The relationship between age of onset and severity was supported by Dubowitz's observation (Dubowitz 1964): age of onset is the only means of predicting outcome at the time of diagnosis. Based on the work of an international collaboration (Munsat 1995; Munsat and Davies 1992) most pediatric neurologists now use the following nomenclature:
I. Patients with type I SMA (Werdnig-Hoffman disease) for the symptoms before age 6 months is characterized by severe generalized muscle hypotonia. Patients never achieve the ability to sit, and death usually occurs from respiratory insufficiency within the first two years without respiratory support.
II. Patients with type II SMA (intermediate) have onset after 6 months of age and before 18 months of age. They achieve the ability to sit unsupported but never stand or walk unaided. Prognosis in this group is largely dependent of the degree of respiratory involvement.
III. Patients with type III SMA (Kugelberg-Welander disease) usually have their first symptoms between 18 months of age and early childhood. They are able to stand and walk independently at some point during their disease course but often become wheelchair bound during youth or adulthood. Life expectancy is not usually reduced in this group.
IV. Patients with type IV SMA have onset in late childhood or adulthood (as late as the fifth or sixth decades).
The clinical symptoms in all four groups of SMA include:
• hypotonia;
• symmetrical muscle weakness and atrophy (predominantly of proximal muscle of the shoulder and pelvic girdle);
• tremor of fingers and hands;
• fasciculation of the tongue muscles;
• hyporeflexia and, at a later stage, contractures of some muscle groups. The diaphragm and extraocular muscles remain unaffected until late stages of the disease and there is little or no impairment of sensory system (Hausmanowa-Petrusewicz et al. 2000; Zalewska and Hausmanowa-Petrusewicz 2000).
The symptoms are due to the selective degeneration of alpha motor neurons in the spinal cord and cranial
INTRODUCTION
3
motor nuclei, leading to the progressive muscle weakness, atrophy and paralysis. Patients with SMA tend to have the greatest rate of loss of muscle power at disease onset (Crawford 2004). This may manifest as a period during which there is clear loss of strength or there may be only the absence of normal motor milestone gains with early growth and development. After this early phase, the rate of loss of muscle strength may slow or stabilize for many years in surviving patients. A recent study indicates that the rate of motor neuron loss may mirror this clinical disease course (Swoboda et al. 2005).
1.2. Survival motor neuron (SMN) gene
Identifying the genes involved in SMA was complicated by the highly complex and unstable nature of the genome region where they are localized and by phenotypes that range in severity from the very severe (type I) to intermediate (type II) and to very mild (type III and IV) (Pearn 1980).
Linkage of autosomal recessive SMA to chromosome 5q11.2-q13.3 was reported in 1990 (Brzustowicz et al. 1990; Melki et al. 1990). One feature of the DNA region containing the SMA gene is that it contains numerous repeated genes and markers. Moreover, the genetic marker loci and genes have very similar copies of each other. This critical region is prone to de novo genomic rearrangements including unequal crossing-over, intrachromosomal rearrangements and gene conversions (Melki et al. 1994b; Wirth et al.
1997a). This region was shown to contain a complex genomic structure with an inverted and duplicated DNA segment of about 500 kb (Lefebvre et al. 1995). Each 500 kb segment, which can be present in 0 to 4 copies per chromosome contains 5 genes:
1. the survival of motor neuron gene (SMN);
2. the BIRC1 (baculoviral IAP repeat-containing 1) gene, also known as NAIP (neuronal apoptosis inhibitory protein);
3. the SERF1 (small EDRK-rich factor 1) gene, also known as H4F5;
4. the GTF2H2 (general transcription factor II H) gene or p44;
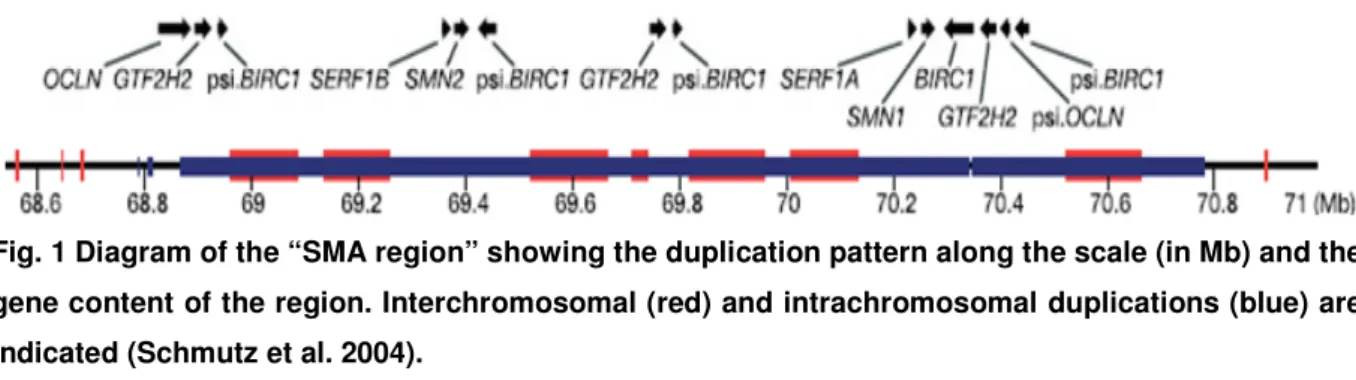
5. the OCLN (occludin) gene.
The polymorphic region is proximally flanked by the unique gene RAD17 and distally by TFNR gene (Kelter et al. 2000) (Fig. 1).
Fig. 1 Diagram of the “SMA region” showing the duplication pattern along the scale (in Mb) and the gene content of the region. Interchromosomal (red) and intrachromosomal duplications (blue) are indicated (Schmutz et al. 2004).
INTRODUCTION
4
Deletions in the SMA region were first implicated by marker studies. Three groups first reported deletions in the SMA region in 1995 (Lefebvre et al. 1995; Roy et al. 1995; Thompson et al. 1995). The deletions disrupted two genes: the neuronal inhibitory protein (NAIP) and the survival motor neuron (SMN) gene.
Both genes had duplicated copies and did not exist as single copies. In the case of NAIP, there was one functional copy of the gene (Roy et al. 1995); for SMN there were two virtually identical genes at the 5q locus, which were originally called telomeric SMN and centromeric SMN but have been renamed SMN1 and SMN2, respectively (Lefebvre et al. 1995).
The functional NAIP gene was deleted in 50% of type I SMA patients, but carriers also had deletion of NAIP (Cobben et al. 1995; DiDonato et al. 1997b; Hahnen et al. 1995; Roy et al. 1995; Velasco et al.
1996). In contrast, SMN1 was absent in 95% to 98% of SMA cases (Cobben et al. 1995; DiDonato et al.
1997a; Hahnen et al. 1995; Lefebvre et al. 1995; Matthijs et al. 1996; Rodrigues et al. 1995; Velasco et al.
1996). The identification of small mutations within the SMN1 gene in about 3.4% of SMA patients clearly indicated that SMN1 was the SMA gene (Lefebvre et al. 1995; Parsons et al. 1998; Velasco et al. 1996;
Wirth et al. 1999). Thus, the loss or mutation of the SMN1 gene with the retention of the SMN2 gene gives rise to SMA (all SMA patients reported to date have at least one SMN2 gene present). Interestingly, the loss of the SMN2 gene occurs in 5% of the normal population with no phenotypic effect (Lefebvre et al.
1995; McAndrew et al. 1997). Over 94% of proximal SMA patients harbour deletions or loss-of-function mutations in the telomeric copy of the SMN gene (SMN1) but retain at least one copy of the centromeric form (SMN2) (Lefebvre et al. 1995; Wirth 2000).
The SMA region in the mouse maps to chromosome 13 and contains a single copy of Smn (DiDonato et al. 1997a; Endrizzi et al. 1999; Scharf et al. 1996). Thus, the 500 kb inverted duplication that gave rise to two SMN genes arose after the divergence of human and mouse lineages. Rat Smn is also single-copy gene (Battaglia et al. 1997; La Bella et al. 1998); the common diagnostic feature of both orthologs is that neither undergoes alternative splicing (Battaglia et al. 1997; Bergin et al. 1997; DiDonato et al. 1997a; La Bella et al. 1998; Viollet et al. 1997). In humans, as much as 5 %-10 % of the human genome is duplicated at least once (Mazzarella and Schlessinger 1998). In some instances, these events are directly responsible for inherited disorders, as in the case for 6 % of mutations causing X-linked Duchenne and Becker muscular dystrophy (Hu et al. 1990). On the other hand, most DNA duplications are non- pathogenic; however, once present, they provide a source of material for inter- and intra-chromosomal exchange. Rearrangements involving both low and high copy repeats are responsible for a growing number of disease pathologies (Deininger and Batzer 1999; Kazazian 1998; Mazzarella and Schlessinger 1998). Sequence comparisons between SMN1 and SMN2 genes could shed some light upon potential cis-elements involved in SMN gene diversification. Twenty three sequence elements were identified within the distal portion of the SMN gene (from intron 6 onward) that distinguish SMN1 from SMN2 (Rochette et al. 2001); five of these were originally reported by Lefebvre and co-workers in 1995 (Lefebvre et al. 1995).
The five nucleotide differences are one in exon 7 (840C-to-T, codon 280, nt. position 27141), exon 8 (nt.
position 27869), and intron 6 (nt. position 27092) and another two in intron 7 (nt. position 27289 and 27404), respectively (Fig. 2).
INTRODUCTION
5
Fig. 2 Genomic structure, nucleotide, and splicing differences between SMN1 and SMN2. The SMN gene copies can be distinguished by 5 nucleotide exchanges, of which only the C-to-T transition in exon 7 is localized within the coding region. This nucleotide exchange in exon 7 is a translationally silent mutation. Therefore, full-length SMN1 and full-length SMN2 mRNA encode identical proteins.
However, the C-to-T transition disrupts an exonic splicing enhancer resulting in alternative splicing of SMN2 pre-mRNA and skipping of exon 7. SMN2∆7 transcripts encode a truncated and unstable protein (Wirth et al. 2006a).
SMN gene duplication occurred after the divergence of rodents and primates about 75-110 million years ago but prior to the separation of human and chimpanzee lineages more than 5-7 million years ago (Bergstrom et al. 1998; Gagneux et al. 1999; Horai et al. 1995). This duplication does not appear to have an obvious phenotypic effect, and the presence of two SMN genes may have provided a selective advantage; whereas ablation of the single ancestral SMN gene in the mouse causes embryonic lethality (Schrank et al. 1997), the presence of SMN2 provides partial compensation in human as demonstrated by the finding that human fetuses with SMA develop much further and much longer than Smn-deficient mice (Crawford and Pardo 1996). As many as 20 %-50 % of duplicated genes are preserved but are subjected to loss-of-function mutations that led to gene diversification (Lynch and Conery 2000). The C-to-T mutation in exon 7 of the SMN2 gene probably represents one such loss-of-function mutation, precluding SMN2 from completely complementing the loss of SMN1 (Rochette et al. 2001).
Some 3.4 % of patients with SMA are compound heterozygotes with a deletion of SMN1 on one chromosome and an intragenic SMN1 mutation on the other chromosome (Wirth et al. 1999). About 35 subtle mutations have been identified so far, many of these being missense mutations shown to disturb the proper function of the SMN1 protein (Buhler et al. 1999; Lorson and Androphy 1998; Sun et al. 2005).
About 4 % of patients showing a clear SMA phenotype undistinguishable from proximal SMA fail to show any mutation within the SMN1 gene pointing towards genetic heterogeneity (Wirth et al. 1999).
INTRODUCTION
6
1.3. Gene conversion, deletion and de novo mutation
Homozygous absence of either SMN1 in patients with SMA or of SMN2 in controls can be the result of two different mechanisms: deletion or gene conversion (Burghes 1997; Wirth et al. 1997a; Wirth et al. 1997b).
Approximately 50 % of type I SMA patients have a single copy of SMN2 on each chromosome, so that the SMN1 gene is deleted and SMN2 copy number is unaffected (DiDonato et al. 1994; Lefebvre et al. 1995;
Melki et al. 1994a; Wirth et al. 1995b). The genotype of one SMN2 copy on each chromosome, together with the loss of NAIP, occurs only on type I SMA chromosomes and implies a large deletion (Burlet et al.
1996; DiDonato et al. 1994; Lefebvre et al. 1995; Melki et al. 1994b; Rodrigues et al. 1996; Wirth et al.
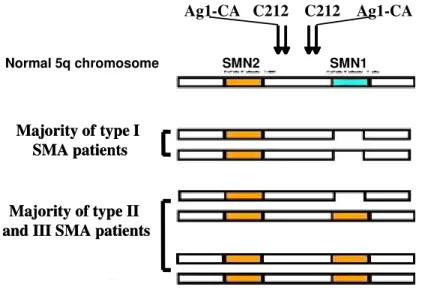
1995a). In type II and type III SMA although patients lack SMN1, they most often have one chromosome with one copy of SMN2 and have the other chromosome with two copies of SMN2 (Fig. 3) (DiDonato et al.
1994; Wirth et al. 1995a). In type II and III SMA, the SMN1 gene is missing, but the NAIP gene is present, as are the markers that lie in the 5' end of the SMN1 gene.
Ag1-CA C212 C212 Ag1-CA Ag1-CA C212 C212 Ag1-CA
Majority of type I SMA patients
Majority of type II and III SMA patients
Majority of type I SMA patients
Majority of type II and III SMA patients
Normal 5q chromosome SMN2 SMN1
Ag1-CA C212 C212 Ag1-CA Ag1-CA C212 C212 Ag1-CA
Majority of type I SMA patients
Majority of type II and III SMA patients
Majority of type I SMA patients
Majority of type II and III SMA patients
Ag1-CA C212 C212 Ag1-CA Ag1-CA C212 C212 Ag1-CA Ag1-CA C212 C212 Ag1-CA Ag1-CA C212 C212 Ag1-CA
Majority of type I SMA patients
Majority of type II and III SMA patients
Majority of type I SMA patients
Majority of type II and III SMA patients
Normal 5q chromosome SMN2 SMN1
Fig. 3 Schematic representation of the most frequently observed SMA chromosomes in acute SMA (type I) and mild SMA (type II/III). While type I SMA chromosomes usually carry true SMN1 deletions on both 5q13 homologs, type II and III SMA chromosomes carry either on one or on both 5q13-homologs an increased SMN2 copy number caused by gene conversion of SMN1 into SMN2 (Wirth 2000).
Because the SMN1 gene is not detected but the markers reveal that the locus is still present, another mechanism besides deletion of SMN1 must be operating; the most likely mechanism is conversion of SMN1 to SMN2. Because the SMN1 gene is absent in all SMA types, the increase in SMN2 copy number indicates that a large number of type II and III SMA chromosomes contain a converted allele, rather than a deleted allele. In conversion of SMN1 to SMN2, there is gain of copy number of SMN2, which will alter the
INTRODUCTION
7
distribution of SMN2 alleles; deletion of SMN1 will not alter the distribution of SMN2 alleles. Chimeric genes have been identified as SMA alleles and can arise by one of two mechanisms:
1. a deletion that removes the material between the SMN1 and SMN2 gene and fuses the 5' end of the SMN2 gene to the 3' end of the SMN1 gene or,
2. a conversion event that effects exon 7, but not exon 8 of the SMN1 gene (Hahnen and Wirth 1996).
The chimeric genes formed by deletion and joining of the SMN2 to SMN1 are severe-SMA alleles.
Hahnen et al. (1996) showed that chimeric SMN genes can occur in type I SMA chromosomes such that there is one chimeric gene on one chromosome 5 (evidence is based on marker studies). Gene conversion leads to an increase of copy number of either SMN1 or SMN2, with simultaneous decrease of the SMN counterparts. When SMN1 is converted into SMN2, the chromosomes carry two SMN2 copies and no SMN1. When SMN2 is converted into SMN1 the chromosomes carry two SMN1 copies and no SMN2. In the first case an “SMA chromosome” with an increased number of SMN2 is generated, in the second case a “normal chromosome” with two SMN1 genes on one chromosome will arise. Additionally, a high percentage of unequal crossing-over, causing either deletions or duplications can be observed in the region that arise as a consequence of the polymorphic character of the 500 kb repeated units. These mechanisms are also responsible for about 2 % of de novo mutations observed among patients with SMA.
1.4. Survival motor neuron transcripts
Almost every protein-coding gene in humans is interspersed by non-coding sequences, known as introns.
Splicing is the post-transcriptional process in which these introns are excised from precursor mRNA molecules (pre-mRNA) and the coding exons are ligated (Horiuchi and Aigaki 2006).
The SMN gene is ubiquitously expressed. SMN1 produces mainly full-length transcripts that contain all nine exons (1, 2a, 2b, 3-8) whereas SMN2 produces mainly alternatively spliced transcripts that lack exon 7 and carry only a small amount (~10%) of full-length (FL) transcripts (Burglen et al. 1996; Helmken et al.
2003; Lefebvre et al. 1995). FL-SMN transcripts derived from both SMN copies encode an identical FL- SMN protein composed of 294 amino acids, with a stop codon located in exon 7. In comparison, the SMN2∆7 transcripts encode a truncated SMN protein of 282 amino acids, with a C-terminus that differs from the FL-SMN protein by the last 4 amino acids. The truncated protein is unstable and shows a reduced oligomerization capacity which has been shown to be essential for the proper SMN function (Burglen et al. 1996; Lefebvre et al. 1995; Lorson and Androphy 1998; Lorson et al. 1999; Lorson et al.
1998). Additionally, both SMN genes produce very low amounts of alternatively spliced transcripts lacking either exon 3, exon 5 or both (Gennarelli et al. 1995). Skipping of these exons produces in frame proteins lacking the respective encoded domains. Especially the loss of exon 3 is of particular interest, since the corresponding region contains a so called Tudor domain that is essential for the interaction of SMN with Sm proteins. Absence or missense mutations within the Tudor domain either abolish or reduce the ability of SMN to interact with Sm proteins (Buhler et al. 1999; Mohaghegh et al. 1999; Sun et al. 2005).
INTRODUCTION
8
SMN exon 7 spans 54 nucleotides and harbours a stop codon at nt position 49 to 51. The last position of exon 7 is an adenosine residue, which places exon 7 into the minor group of internal exons lacking a 3'- end G residue (Burge et al. 1999). Exon 7 is characterized by a weak 3'ss due to a suboptimal polypyrimidine tract (Lim and Hertel 2001). Correct splicing of exon 7 depends on various cis-acting elements (enhancers and silencers) localized within exon 7 as well as within the introns 6 and 7 (Cartegni and Krainer 2002; Hofmann et al. 2000; Hofmann and Wirth 2002; Kashima and Manley 2003; Lorson and Androphy 2000; Lorson et al. 1999; Miyaso et al. 2003; Young et al. 2002b). They are recognized by various splicing factors, SR and SR-like proteins as well as hnRNPs (Cartegni and Krainer 2002; Helmken et al. 2003; Hofmann et al. 2000; Hofmann and Wirth 2002; Young et al. 2002b). Most of the elements seem to be highly conserved and are also involved in pre-mRNA splicing of the murine Smn gene (DiDonato et al. 2001). There is no tissue specificity observed concerning the ratio of FL-SMN vs. SMN∆7 in a certain individual as demonstrated by quantitative RT-PCR (Helmken et al. 2003; Lorson et al. 1999).
In 1999, Lorson and colleagues demonstrated that C-to-T transition in exon 7 is sufficient to cause skipping of this exon of the SMN2 gene. They constructed wildtype SMN1 and SMN2 minigenes (exon 6 to exon 8) as well as hybrid minigenes in which the five nucleotide differences were exchanged one by one either on the SMN1 background with SMN2 specific nucleotides or vice-versa, followed by in vivo splicing and analysis of SMN transcripts (Lorson et al. 1999). They demonstrated that an exonic splicing enhancer (ESE) is disrupted by the C-to-T exchange within the SMN2 gene, thus being responsible for the alternative splicing (Lorson and Androphy 2000; Lorson et al. 1999). Later, Cartegni and Krainer stated that the C-to-T exchange lies within a conserved heptamer motif, an ESE, CAGACAA, which is directly recognized by the SR-rich splicing-factor SF2/ASF in SMN1, but not in SMN2 derived transcripts. UV- crosslinking experiments showed specific interaction of SF2/ASF with exon 7 SMN1 but not with SMN2, thus promoting exon 7 inclusion (Cartegni and Krainer 2002). In contrast to these findings, the group of Manley demonstrated that the C-to-T exchange in SMN2 creates a new exonic splicing silencer rather than disrupting an ESE, which finally functions as a binding site for the repressor protein hnRNP-A1. It has been shown that the reduction of hnRNP-A1 in HeLa cells by RNA interference promotes exon 7 inclusion in SMN2. Using in vitro UV-cross linking, hnRNP-A1 was found to bind exon 7 of SMN2 but not of SMN2 (Kashima and Manley 2003). A controversial debate is still ongoing and further experiments have to prove which of the hypotheses is correct. Meanwhile, Singh and colleagues showed that the 5' end of exon 7 contains an extended inhibitory context composed of several overlapping sequence motifs. Together, they regulate a larger sequence than the hnRNP-A1 binding site (Singh et al. 2004a, b).
In addition to the 5' end ESE and/or ESS, another ESE is found in the center of exon 7 that binds the SR- like splicing factor Htra2-β1 (Hofmann et al. 2000). Htra2-β1 is the ortholog of D. melanogaster tranformer- 2 (Tra 2), a gene essential for sex differentiation which is regulated by alternative splicing (Baker 1989). It is likely to be an important developmental regulator of alternative splicing that acts by binding to purine- rich elements in or near exons (Tacke et al. 1998). Tra2-β1 binds and enhances the incorporation of a novel testis-specific alternative exon of the homeodomain- interacting protein kinase HipK3 (HipK3-T) and promotes exclusion of another exon in the HipK3 gene, the ubiquitous alternative (U) exon (Venables et
INTRODUCTION
9
al. 2005). A similar situation was recently reported, whereby Tra2-β1 promotes inclusion of exon 10 and exclusion of exon 2 of the important neural protein Tau (Wang et al. 2005).
The gene for Htra2-β has been mapped to chromosome 3q26.2-q27, contains 10 exons, and the coding region spans 21 kb (Nayler et al. 1998). RT-PCR and analysis of Htra2-β cDNA indicated that at least four different Htra2-β isoforms are generated by alternative splicing: Htra2-β1 (exons 1, 3-10), Htra2-β2 (exons 1-2), Htra2-β3 (exons 1,4-10), and Htra2-β4, which is generated by over reading the polyadenylation signal in exon 2a using the 5’ splice site of exon 2b (Nayler et al. 1998). Two of these isoforms, Htra2-β3 and Htra2-β4, appear to be tissue-specific and developmentally regulated, whereas Htra2-β1 and Htra2- β2 are ubiquitously expressed bearing high levels in brain and testis (Nayler et al. 1998). Protein-RNA binding experiments showed a strong interaction of Htra2-β1 with the GA-rich region localized in the center of exon 7 of SMN1 and SMN2 producing correctly spliced transcripts (Hofmann et al. 2000;
Hofmann and Wirth 2002). In addition, the splicing factor SRp30 (an SR-rich splicing factor) as well as hnRNP-G and RPM (belonging to the group of hnRNPs) directly bind Htra2-β1 and further enhance the inclusion of exon 7 (Hofmann and Wirth 2002; Young et al. 2002b) (Fig. 4).
Fig. 4 Splicing regulation of SMN exon 7. (A) SMN1 exon 7 contains a heptamer sequence (SE1) at the 5’ end that is recognized by the SR-protein SF2/ASF. (B) In SMN2, the C-to-T transition disrupts the critical heptamer sequence within SE1, and the splicing factor SF2/ ASF cannot bind anymore to exon 7, which results in skipping of this exon. Furthermore, the C-to-T transition in SMN2 exon 7 promotes an inhibitory effect of hnRNP-A1 and thus facilitates the exclusion of exon 7 (Wirth et al. 2006b).
INTRODUCTION
10
Both SMN1 and SMN2 contain an ESE in the central part of exon 7 (SE2) that is recognized by Htra2-β1 and its interacting partners hnRNP-G and SRp30c. Overexpression of the SE2-dependent splicing factors restores FL-SMN2 transcript to about 80 %. At the 3’end of exon 7, another exonic splicing enhancer (SE3) has been identified. Furthermore, intron 7 contains an ISS (ISS-N1) that exerts its function on the positive acting exonic and intronic elements (curved arrows in Fig. 4). The trans-acting splicing factors that bind the intronic splicing elements or SE3 are not yet identified (Wirth et al. 2006a).
The abundant heterogeneous nuclear ribonucleoproteins (hnRNPs) that coat nascent transcripts often inhibit splicing, and the effect of Tra2-β1 on the splicing of tau and SMN is antagonized by hnRNP-A1 and hnRNP G (Andreadis 2005; Hofmann et al. 2000; Hofmann and Wirth 2002; Kashima and Manley 2003;
Nasim et al. 2003; Venables et al. 2000). This network of splicing factor binding to the central ESE in exon 7 is the most likely responsible for the 10-15 % FL-mRNA generated by SMN2. Overexpression of these splicing factors either separate or in combination restores the splicing capacity of SMN2 minigenes up to 80 % and substantially increases endogenous SMN protein levels (Brichta et al. 2003; Hofmann et al.
2000; Hofmann and Wirth 2002). A potential therapy of SMA based on the modulation of the SMN2 splicing pattern that increases FL-SMN levels has been hypothesized (Hofmann et al. 2000).
Exon 7 skipping in SMN2 is furthermore facilitated by two intronic splicing silencer localized in intron 6 from -112 to -68 bp (element 1) and intron 7 from +59 to +72 (element 2) (Miyajima et al. 2002; Miyaso et al. 2003). However, mutations or deletions within these regions do not affect the correct splicing of wild type SMN1 pre-mRNA. A 33 kD protein has been shown to interact with element 1 of SMN2 but not of SMN1. Element 2 possesses a characteristic stem-loop structure, in which the correct matching of the nucleotides within the stem is essential. In these works, other genes with a complete matching of the nucleotides within the stem-loop have been identified, although the experimental proof for the role in the regulation of splicing still has to be given (Miyajima et al. 2002; Miyaso et al. 2003).
1.5. The SMN protein and its functions
SMN is a ubiquitously expressed protein with a molecular weight of 38kDa. It has been highly conserved through evolution. In humans, SMN is a protein found in the cytoplasm and the nucleus of cells, where it is present throughout the nucleoplasm and is highly enriched within discrete bodies called gems (for
“Gemini” of Cajal bodies) (Liu and Dreyfuss 1996).
SMN protein is encoded by eight exons generating a multidomain polypeptide. It contains the central Tudor domain (encoded by exon 3) flanked by a N-terminal lysine (K)-rich sequence (encoded by exon 2) and in the C-terminal regions, by a proline (P)-rich region (encoded by exons 4 and 5), a tyrosine-glycine (YG)-box (encoded by exon 6) and the exon 7 encoded domains. Missense mutations have been identified in several of these regions, suggesting that each of these domains may be functionally important. The Tudor domain, named because of its structural homology to repeats of the Drosophila tudor protein, is conserved among different RNA-binding proteins (Ponting 1997; Selenko et al. 2001) and
INTRODUCTION
11
Table 1 The SMN protein is present as part of a large macromolecular complex containing a number of common core components and a set of transiently or substoichiometrically interacting partners.
SMN complex component
Direct/Indirect
SMN interaction Function Reference
Core components
Gemin1 (SMN) + (Liu et al. 1997; Lorson et
al. 1998)
Gemin2 (SIP 1) + snRNP biogenesis and pre-mRNA
splicing
(Liu et al. 1997)
Gemin3 (DP103) + snRNP biogenesis and pre-mRNA
splicing
(Campbell et al. 2000;
Charroux et al. 1999)
Gemin4 (GIP1) - snRNP biogenesis and pre-mRNA
splicing
(Charroux et al. 2000;
Meister et al. 2000)
Gemin5 (p175) + snRNP biogenesis and pre-mRNA
splicing s
(Gubitz et al. 2002)
Gemin6 - snRNP biogenesis and pre-mRNA
splicing
(Pellizzoni et al. 2001b)
Gemin7 + snRNP biogenesis and pre-mRNA
splicing
(Baccon et al. 2002)
Gemin8 - snRNP biogenesis and pre-mRNA
splicing
(Carissimi et al. 2006)
unrip - snRNP biogenesis and pre-mRNA
splicing
(Grimmler et al. 2005;
Meister et al. 2001b) Substrates and substoichiometric components
Sm proteins + snRNP biogenesis and pre-mRNA
splicing
(Friesen and Dreyfuss 2000; Liu et al. 1997)
LSm4 + snRNP biogenesis and pre-mRNA
splicing
(Brahms et al. 2001;
Friesen and Dreyfuss 2000)
Fibrillarin + Assembly of snoRNPs (Jones et al. 2001;
Pellizzoni et al. 2001a)
GAR1 + Assembly of snoRNPs (Pellizzoni et al. 2001a)
Coilin + Recruitment of SMN to Cajal bodies (Hebert et al. 2001)
U1-A, U2-A’ unknown snRNP biogenesis (Liu et al. 1997)
Profilin + Control of actin dynamics (Giesemann et al. 1999)
ZPR1 (zinc-finger protein 1)
+ Caspase activation and apoptosis;
snRNP assembly/maturation
(Gangwani et al. 2001)
OSF (Osteoclast- stimulating factor)
+ Regulation of osteoclast formation and activity
(Kurihara et al. 2001)
Nucleolin and B23 - Cell growth and proliferationcontrol, programmed cell death, cell surface signal transduction,and differentiation and maintenance of neural tissues
(Lefebvre et al. 2002)
INTRODUCTION
12
RNA helicase A + Transcription (Pellizzoni et al. 2001c)
RNA polymerase II - Transcription (Pellizzoni et al. 2001c)
hnRNP Q and R + RNA transport along the axons (Mourelatos et al. 2001;
Rossoll et al. 2002) hsc70 (heat shock
protein 70) unknown Post-translational protein transport (Meister et al. 2001b) snurportin and importin
β - and + Transport of snRNPs to nucleus (Narayanan et al. 2002)
galectin 1 and 3 - snRNP biogenesis and pre-mRNA
splicing
(Park et al. 2001)
p53 + Apoptosis (Young et al. 2002a)
ISG20 unknown Degradation of single-stranded RNA (Espert et al. 2006) FGF-2 (fibroblast
growth factor 2)
+ Neurotrophic factor for motor neurons (Claus et al. 2004)
mSin3A unknown Transcriptional regulation (Zou et al. 2004)
EWS (Ewing Sarcoma) + Transcriptional regulation (Young et al. 2003)
Bcl-2 + Anti-apoptosis (Iwahashi et al. 1997)
FUSE binding protein + Regulator of transcription and mRNA stability
(Rothe et al. 2006;
Williams et al. 2000) TIA-1 and TIAR unknown RNA metabolism, translation
regulation, assemblers of stress granules
(Hua and Zhou 2004b)
Rpp20 + RNA metabolism, component of stress
granules
(Hua and Zhou 2004a)
PPP4 (Protein
phosphatase 4) - Ubiquitous protein phosphatase that dephosphorylatesserine and threonine residues
(Carnegie et al. 2003)
TGS1
(trimethylguanosine synthase 1)
+ snRNA cap hypermethylase (Mouaikel et al. 2003)
Viral proteins
Papilloma virus E2 + Nuclear transcription activation (Strasswimmer et al.
1999) Epstein-Barr virus
nuclear antigen 2a + Transcriptial regulators (Voss et al. 2001)
Epstein-Barr virus nuclear antigen 6 (or 3c)
- Transcriptial regulators (Krauer et al. 2004)
Minute virus NS1 and
NS2 unknown Viral replication and a potent
transcriptional activator.
(Young et al. 2002c, d)
mediates SMN interaction with arginine-glycine (RG) motifs in several proteins (Gubitz et al. 2004; Meister and Fischer 2002) including the Cajal body marker coilin and the Sm core proteins, after their symmetrically dimethylated mediates arginine (sDMA) isoforms (Boisvert et al. 2002; Friesen et al. 2001b;
Hebert et al. 2002; Meister and Fischer 2002). The K-rich sequence is embedded in the interspecies
INTRODUCTION
13
conserved RNA-binding domain (Bertrandy et al. 1999; Lorson et al. 1998). The P-rich domain associates with the actin-binding protein profilin (Giesemann et al. 1999). The YG-box domain is implicated in self- association in vitro (Lorson and Androphy 1998)and a putative cytoplasmic retention signal is encoded by exon 7 (Zhang et al. 2003). The central Tudor domain cooperates with the YG-box and the K-rich sequence for the accumulation of SMN in Cajal bodies. One explanation for the role of the YG-box in Cajal bodies localization is that self-oligomerization might enhance SMN accumulation in Cajal bodies by promoting binding to Cajal bodies components, such as snRNPs (Fischer et al. 1997; Liu et al. 1997;
Pellizzoni et al. 2001a; Wang and Dreyfuss 2001b). The K-rich sequence encoded by the exon 2b is required for the nucleolar accumulation of truncated SMN proteins (Renvoise et al. 2006). All directly and indirectly interacting SMN partners known so far are listed in table 1 (Wirth et al. 2006b).
Gems have similarities in size and number to Cajal (coiled) bodies and are often associated with them (Liu and Dreyfuss 1996). Cajal bodies were first described in 1903 and are known to contain high levels of factors involved in the transcription and processing of many types of nuclear RNAs, including small nuclear ribonucleoproteins (snRNPs), nucleolar ribonucleoproteins (snoRNPs), and the three eukaryotic RNA polymerases (Gall 2003a, b; Ogg and Lamond 2002). However, since Cajal bodies are deficient in DNA, nascent pre-mRNA, and non-snRNP essential for splicing factors, they are probably not active sites for transcription or splicing (Ogg and Lamond 2002). Instead, they most likely are locals where the assembly and/or modification of the nuclear transcription and RNA processing machinery take place (Gall 2003a, b). Double-label immunofluorescence microscopy using antibodies against SMN as a marker of gems, and p80-coilin as a marker for Cajal bodies (Andrade et al. 1991), revealed that gems and Cajal bodies mostly co-localize in some cell lines and adult tissues but are separated in fetal tissues and several types of cultured cells (Paushkin et al. 2002). This indicates that gems and Cajal bodies are distinct nuclear structures that have a dynamic functional relationship. The interaction between gems and Cajal bodies may be mediated, at least in part, by the capacity of SMN and coilin to bind each other (Hebert et al. 2001). Gems are also separated from interchromatin granule clusters (or speckles), which are DNA – free nuclear domains composed of densely packed ribonucleoprotein particles enriched in mature snRNPs and protein splicing factors (Almond et al. 2003). Newly assembled spliceosomal mRNPs re- entering the nucleus associate with SMN (Narayanan et al. 2004) and transiently move into Cajal bodies (Jady et al. 2003; Sleeman et al. 2001). The role of Cajal bodies in snRNP maturation steps (Jady et al.
2003; Nesic et al. 2004) and in regeneration of snRNPs after splicing has been described (Pellizzoni et al.
1998; Schaffert et al. 2004; Stanek and Neugebauer 2004). It has been shown that cells transfected with SMA mutants showed severe reduction of snRNPs in Cajal bodies (Renvoise et al. 2006).
1.5.1. SMN complex
When isolated from cultivated cells, a large proportion of cellular SMN is present as part of a multisubunit macromolecular entity. SMN protein oligomerizes and forms a stable complex called the SMN complex, with a group of proteins named the Gemins. These include Gemin 2 (formerly SIP1) (Liu et al. 1997),
INTRODUCTION
14
Gemin 3/ DP103 (a DEAD-box RNA helicase) (Campbell et al. 2000; Charroux et al. 1999), Gemin 4 (Charroux et al. 2000; Meister et al. 2000), Gemin 5/ p175 (a WD repeat protein) (Gubitz et al. 2002), Gemin 6 (Pellizzoni et al. 2001b), Gemin 7 (Baccon et al. 2002) and Gemin 8 (Carissimi et al. 2006). This complex is large and sediments in sucrose gradients as hetero-disperse particles of 30-70 S (Paushkin et al. 2002). The Gemins co-localize with SMN in gems and are also present throughout the cytoplasm and, albeit at lower levels, in the nucleoplasm (Baccon et al. 2002; Charroux et al. 1999; Charroux et al. 2000;
Gubitz et al. 2002; Liu et al. 1997; Pellizzoni et al. 2002a).
Gemin 4 is the only SMN complex component that also localizes to the nucleolus (Charroux et al. 2000;
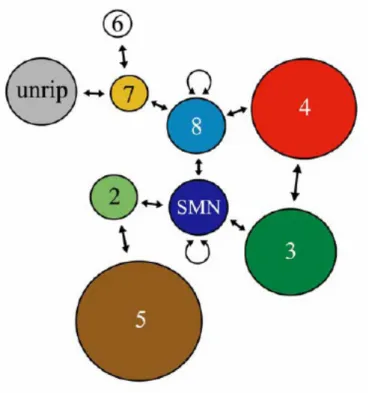
Paushkin et al. 2002). Based on their stable association with SMN, the Gemins can be considered as integral components of the SMN complex and are readily isolated by coimmunoprecipitation using anti- SMN antibodies or antibodies to the Gemins, even under stringent high salt conditions (750 mM NaCl) (Paushkin et al. 2002). The function of the multi-unit SMN-complex relies on the ordered interplay of the nine components SMN, Gemin 2-8 and unrip. Recent studies have revealed a framework of the SMN- complex with SMN, Gemin 7 and Gemin 8 as its backbone (Otter et al. 2006) (Fig. 5).
Fig. 5 Schematic representation of all interactions within the SMN-complex. SMN, Gemin 7 and Gemin 8 provide a binding platform for the other components of the complex. SMN binds Gemin 2, Gemin 3 and Gemin 8. Gemin 8 interacts in turn with Gemin 4 and Gemin 7. Gemin 7 recruits unrip and Gemin 6 via direct interaction (Otter et al. 2006).
INTRODUCTION
15
These three proteins provide a binding platform for the other components of the complex via multiple interactions: SMN binds to Gemin 2 (Baccon et al. 2002), Gemin 3 (Campbell et al. 2000; Charroux et al.
1999) and Gemin 8. Gemin 8, in turn, interacts with Gemin 4 and 7. Finally, Gemin 7 recruits unrip and Gemin 6 via direct interaction (Baccon et al. 2002; Carissimi et al. 2006; Grimmler et al. 2005). The peripheral protein Gemin 5 can be dissociated upon treatment with high salt (Otter et al. 2006). This finding suggests its incorporation into the complex via weak interaction mediated by Gemin 2 and possibly Gemin 4.
Conflicting data regarding the function of Gemin 5 have been recently reported (Battle et al. 2006; Feng et al. 2005; Shpargel and Matera 2005). In two reports RNAi was used to show that Gemin 2 is dispensable for the assembly reaction (Feng et al. 2005; Shpargel and Matera 2005). In contrast, evidence for an essential role of Gemin 5 in the formation of U snRNPs has been provided in another recent report (Battle et al. 2006).
Gemin 2 was formerly referred to an SIP-1 (SMN interacting protein 1) and binds to a distinct site at the N- terminus (aa 13-14) of SMN. Although Gemin 2 and SMN are closely interacting proteins, part of the same complex, the same pathway and exhibit the same cellular location in gems and cytoplasm, it has been shown that SIP1 is neither responsible for 5q-unlinked SMA nor for the phenotypic variability observed in SMA families (Helmken et al. 2000). The SMN protein likely plays a central role in the structural organization of the SMN complex as it is the essential to bring together the different subunits. The presence of multiple subunits and the seemingly modular organization of the SMN complex due to SMN’s ability to oligomerize, which is impaired in SMN mutants of SMA patients (Lorson et al. 1998; Pellizzoni et al. 1999), support the current view of the SMN complex as a dynamic macromolecular machine capable of multiple tasks.
The SMN complex interacts with several proteins, some of which can be considered SMN complex substrates. Among these substrates are the Sm proteins and Sm-like (Lsm) proteins of the snRNPs, which are essential components of the splicing machinery. Intriguingly, each component of the SMN complex has the capacity to bind to a subset of the Sm/Lsm proteins (Baccon et al. 2002; Charroux et al.
1999; Charroux et al. 2000; Gubitz et al. 2002; Liu et al. 1997; Pellizzoni et al. 2002b). Additional SMN complex substrates are the snoRNP proteins, fibrillarin and GAR1, as well as hnRNP U, Q and R, RNA helicase A, coilin, nucleolin, and Epstein–Barr virus nuclear antigen 2 (Barth et al. 2003; Hebert et al.
2001; Jones et al. 2001; Lefebvre et al. 2002; Mourelatos et al. 2001; Pellizzoni et al. 2001a; Rossoll et al.
2002). Recently, it was also reported that protein phosphatase 4 (PPP4), a ubiquitous essential protein serine/threonine phosphatase, is associated with the SMN complex via binding to Gemin4 and/or Gemin3, and overexpression of catalytic (PPP4c) and regulatory (R2) domains of PPP4 was found to modify the temporal localization of newly formed snRNPs in HeLa cells (Carnegie et al. 2003). However, whether and how this phosphatase protein affects the functions of Gemin 3, Gemin 4 and/or the SMN complex awaits further clarification. Gemin 3 and 4 have also been shown to be components of a 15S microRNP complex that contains eIF2C2, a member of the Argonaute protein family, and numerous miRNAs (Dostie et al.
2003; Mourelatos et al. 2002). These findings raised the interesting possibility that SMN deletions or loss-