Report No. 56
South Asia Human Development Sector
Determinants of School Enrollment in Balochistan March 2013
Public Disclosure AuthorizedPublic Disclosure AuthorizedPublic Disclosure AuthorizedPublic Disclosure Authorized
76115
Report No. 56
South Asia: Human Development Sector
Determinants of School Enrollment in Balochistan
March 2013
Discussion Paper Series
Discussion Papers are published to communicate the results of the World Bank’s work to the development community with the least possible delay. The typescript manuscript of this paper therefore has not been prepared in accordance with the procedures appropriate to formally edited texts. Some sources cited in the paper may be information documents that are not readily
available.
The findings, interpretations, and conclusions expressed herein do not necessarily reflect the views of the International Bank for Reconstruction and Development / The World Bank and its affiliated organizations, or those of the Executive Directors of the World Bank or the
governments they represent.
The World Bank does not guarantee the accuracy of the data included in this work. The
boundaries, colors, denominations, and other information shown on any map in this work do not imply any judgment on the part of The World Bank concerning the legal status of any territory or the endorsement or acceptance of such boundaries.
TABE OF CONTENTS
ACKNOWLEDGEMENTS ...ii
ABBREVIATIONS AND ACRONYMS ... iii
ABSTRACT ... 1
1. Introduction ... 1
2. Data ... 3
3. Methods... 3
4. Results ... 4
5. Discussion ... 13
6. Conclusion ... 15
BIBLIOGRAPHY ... 16
TABLES
Table 1 Sample Counts and Proportions in Different Schooling Statuses... 2Table 2 Sample Counts and Proportions in Different Schooling Statuses by Gender for Balochistan ... 2
Table 3 Characteristics of Children in Balochistan and Punjab (Ages 6-10) By Schooling Status ... 5
Table 4 Decomposition of Out-of-School Variation, 2010/11 ... 7
Table 5 Household Incidence of Schooling with Multiple Children, Pakistan, Balochistan and Punjab ... 8
Table 6 Household Incidence of Schooling with Multiple Girls and Boys (Ages 6-15), 2010/11 ... 8
Table 7 Descriptive Statistics ... 10
Table 8 Regression Results for Balochistan and the Rest of Pakistan ... 12
Table 9 Reasons for Being out of School, Children in Balochistan ... 15
AUTHOR Ali Ansari
ACKNOWLEDGEMENTS
I acknowledge with sincere gratitude the Pakistan Bureau of Statistics for providing access to the data used for this analysis, in particular the Chief Statistics Officer-PSLM. I appreciate the assistance and feedback provided by several World Bank colleagues in the preparation of this study. In particular, Dhushyanth Raju (Senior Economist), Umbreen Arif (Senior Education Specialist), Huma Waheed (Operations Officer), Ayesha Khan (Research Analyst) and Amit Dar (Education Sector Manager). I also acknowledge the insightful comments provided by Nuzhat Ahmad on the contents of this article.
I also thank Mohammad Khalid Khan (Program Assistant) from the World Bank for providing editorial comments for the production of this paper along with Amna Mir (Program Assistant), for providing administrative support.
ABBREVIATIONS AND ACRONYMS
NER Net Enrollment Rate
PBS Pakistan Bureau of Statistics
PIHS Pakistan Integrated Household Surveys
PSLM Pakistan Standards of Living Measurement Surveys PSU Primary Sampling Units
ABSTRACT
This paper examines the determinants of enrollment of schooling for children between the ages of 6 and 15 in Balochistan. Using a nationally representative sample from the Pakistan Living Standards Measurement Surveys (PSLM) 2010-11, this analysis consists of three main components: Constructing profiles of children in Balochistan by schooling status, conducting a decomposition of variance of schooling status, and a logistic regression analysis to determine gender differentials in school enrollment. The results suggest that for 6-10 year olds in Balochistan the majority of variation in schooling status is explained between households rather than within households, while for 11-15 year olds the majority of variation in schooling status is explained by within household differences.
Gender disparities are evident in the province as 57 percent of households with multiple girls in the 6-15 age group send no girls to school. The results from the analysis suggest that females are 4.5 times more likely to be out of school than males in the 6 to 10 age group, while they are 15.5 times more likely to be out of school than males in the 11-15 age group. Poverty also plays a major role in determining whether or not a child is enrolled in school, as children belonging to the poorest wealth quintile in the 6-10 age group are 4 times as likely to be out of school than children in the richest wealth quintile.
1. Introduction
Educational attainment in Pakistan has been historically low as compared to other countries in the region. Currently the primary net enrollment rate (NER) (for 6-10 year olds) in Pakistan is 66 percent (PSLM Surveys, 2010-11) which is far below that of some of the other countries in the region, as India’s NER is 92 percent, and Bangladesh’s NER is 89 percent (“Net enrollment ratio,” 2012). It is also evident that there is great disparity within Pakistan, particularly in Balochistan which has a primary NER of 56 percent as compared to the Punjab province which has a primary NER of 70 percent. Gender wise disparities are also pronounced in Balochistan as 41 percent of females between the ages of 6 and 10, and 27 percent of 11 to 15 year old females are enrolled in school, as compared to 68 percent, and 64 percent of males respectively.
Authors have examined various factors that influence enrollment decisions in Pakistan however, there have been relatively few recent studies that examine the determinants of schooling decisions and gender differentials in schooling in Balochistan. Cultural and societal attitudes towards girls’ education play a factor in whether or not girls attend school, particularly in Balochistan. Using data from the 2002 Pakistan Integrated Household Surveys (PIHS), Qureshi (2003) reports that the primary reason for girls between the ages of 10 and 18 for not attending school is that parents do not allow them to attend school. One of the reasons why parents may not be willing to send girls to school in Balochistan, could be attributed to large distances to schools, and the lack of schools within many villages. If the school is located far away from their homes, or in another village, parents may not allow their daughters to go to school due to security
concerns. Hazarika (2001) finds that distance from primary school is a statistically significant determinant of female primary schooling enrollment in rural Pakistan.
Furthermore, Kim, Alderman & Orazem (1998) find that increasing access to private schooling for girls in Quetta, Balochistan, increased girls enrollment by 33 percent in the target neighborhoods. One of the limitations of the Kim, Alderman & Orazem study is that the evaluation only covered a particular intervention in an urban area in Quetta, Balochistan. Therefore, given the lack of up-to-date research on education in Balochistan, and the existing gender disparities in schooling, there is a need for more in depth research that explores additional determinants of schooling, and that can be generalized to the entire province. This paper aims to identify the factors that influence school enrollment decisions in Balochistan, and examine gender differentials in schooling decisions. To do this, three exercises are conducted; profiling of children by schooling status, decomposition of variance analysis, and a bi nomial logistic regression analysis to analyze the determinants of schooling in Balochistan.
Table 1 Sample Counts and Proportions in Different Schooling Statuses
Schooling status
Pakistan Balochistan Punjab
(1) (2) (3) (4) (5) (6) (7) N Percent N Percent N Percent (6)–(4) Panel A: 6–10 year olds
In school 50,660 68.07 8,178 55.94 19,862 72.41 16.47 In private school 14,910 31.65 394 4.98 8,766 37.77 32.79 In public school 33,883 66.79 7,784 95.02 12,846 60.64 -34.38 Never in school 25,791 30.99 6,541 43.05 6,635 26.48 -16.57 Dropped out of school 661 0.93 181 1.01 276 1.11 0.1 Panel B: 11–15 year olds
In school 39,476 66.38 5,037 49.05 16,659 69.50 20.45 In private school 9,238 31.65 271 5.54 5,026 29.50 23.96 In public school 29,341 66.79 4,766 94.46 11,184 67.60 -26.86 Never in school 15,484 21.97 4,206 38.72 3,798 17.57 -21.15 Dropped out of school 6,996 11.65 1,281 12.22 2,990 12.93 0.71 Notes: Statistics derived from 2010/11 PSLM data. Pakistan comprises of the four provinces and Islamabad. All proportions are adjusted for sampling weights.
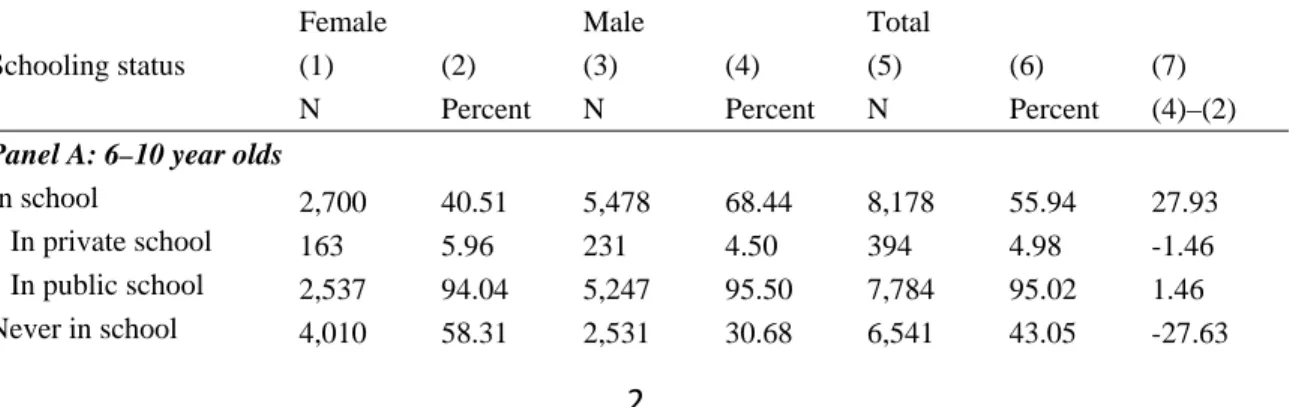
Table 2 Sample Counts and Proportions in Different Schooling Statuses by Gender for Balochistan
Schooling status
Female Male Total (1) (2) (3) (4) (5) (6) (7) N Percent N Percent N Percent (4)–(2) Panel A: 6–10 year olds
In school 2,700 40.51 5,478 68.44 8,178 55.94 27.93 In private school 163 5.96 231 4.50 394 4.98 -1.46 In public school 2,537 94.04 5,247 95.50 7,784 95.02 1.46 Never in school 4,010 58.31 2,531 30.68 6,541 43.05 -27.63
2. Data
The data used for this analysis are derived from the Pakistan Living Standards Measurement Surveys (PSLM) 2010-11 which is an annual survey conducted by the Pakistan Bureau of Statistics (PBS). The data is nationally representative, and covers all four provinces of Pakistan, excluding military restricted areas. The 2010-11 surveys covered 76,546 households across Pakistan, collecting information on health, education, and other socio economic indicators. The surveys adopted a two stage stratified sample design, where villages in rural areas, and enumeration blocks in urban areas were taken as the Primary Sampling Units (PSUs), and households were taken as Secondary Sampling Units.
Following this sampling methodology has been particularly challenging in Balochistan, due to the security situation in the province. Therefore, there are areas within the province that were selected for surveying but were not able to be surveyed due to security concerns. It is because of these issues that one must proceed with caution when conducting analysis using this data set. Despite these issues, given the lack of additional sources of reliable data from Balochistan the PSLM survey data still serves a useful purpose in attempting to understand the out of school phenomenon in Balochistan.
3. Methods
As a first step towards understanding the characteristics of children in Balochistan profiles of children by schooling status are generated. Secondly, a variance decomposition analysis is conducted to determine the level at which the variance of schooling status can be explained. The method followed here is the same as outlined by Konstantopoulos (2007). The exercise is useful to inform policy making because it can identify whether or not variation in schooling status can be explained by geographic differences, inter household differences or within household differences. This analysis was conducted separately first using a two level components model, and then using a three level components model. The two level components model classifies variance in to two main components; between household variation in schooling status and within household variation in schooling status. The three components model classifies variation
Dropped out of school 98 1.18 83 0.87 181 1.01 -0.31 Panel B: 11–15 year olds
In school 1,110 27.14 3,927 63.99 5,037 49.05 36.85 In private school 79 6.31 192 5.32 271 5.54 -0.99 In public school 1,031 93.69 3,735 94.68 4,766 94.46 0.99 Never in school 2,671 61.26 1,535 23.37 4,206 38.72 -37.89 Dropped out of school 517 11.61 764 12.64 1,281 12.22 1.03 Notes: Statistics derived from 2010/11 PSLM data. All proportions are adjusted for sampling weights.
Column 7 represents the difference in male and female proportions.
in schooling status into three levels; district level, between households, and within households. In other words, the question of interest is; is the variance in schooling status mostly explained at the district level, household level, or within households?
The household incidence of schooling analysis, examines household schooling participation in Balochistan, Punjab, and Pakistan for households with multiple children in two respective age groups; 6-10 year olds, and 11-15 year olds. The central question being addressed here is; what share of households with children in the respective age groups, send no children to school, send some children to school and send all children to school? This analysis is also done separately by gender, to determine if there are differences in household school participation for girls and boys.
To quantify the results, and determine the extent to which enrollment decisions are vary by gender, a bi nomial logistic regression model is used. The econometric model utilized in this paper, is similar to that used by Dancer and Rammohan (2007). The basic idea is that parents strive to maximize their utility, subject to their income constraint: Parents derive their utility from a mix of market and non market goods which include educational investments in children. Educational investments in children, or the decisions to send children to school, are based on a variety of household, parental, and geographical characteristics, which are included in the model provide various levels of utility for households which households look to maximize. Using a linear random utility model we also assume that the error follows a logistic distribution. Using logistic regression modeling, calculating the probability a child is in school or out of school based on certain characteristics is possible, as we are able to utilize the logistic coefficients to calculate odds ratios, and determine the likelihood a child is in school or out of school based on various characteristics.
4. Results
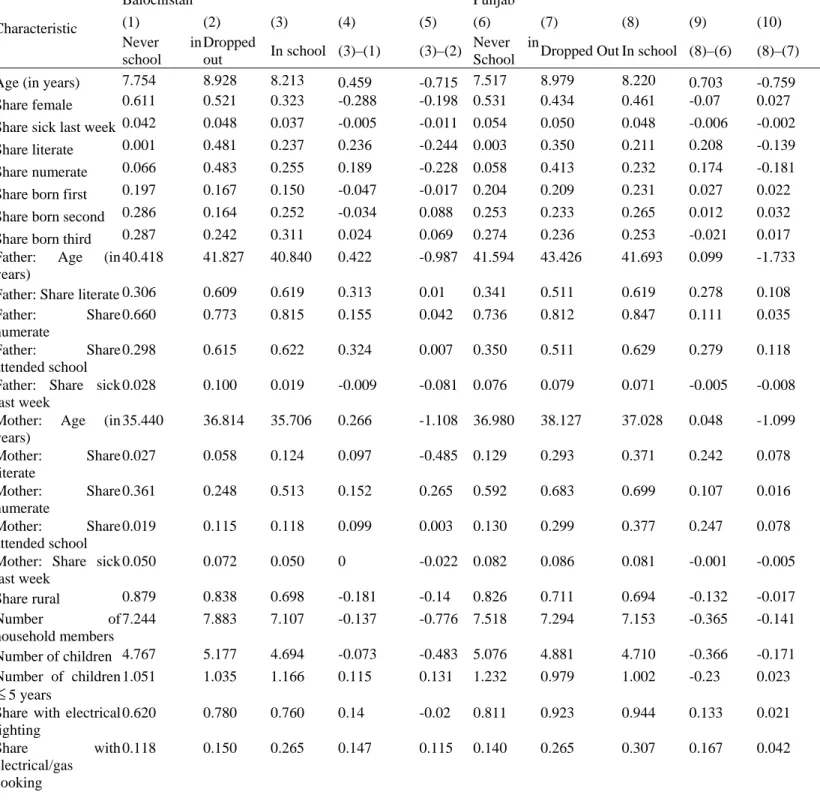
Profiles and descriptive statistics by schooling status are presented in table 3 below, for children in Balochistan and Punjab, between the ages of 6 and 10. For the 6-10 year olds in Balochistan, the majority of never in school and drop out children are female, while 68 percent of in school children are male. On average, drop outs tend to be older than their in school counterparts, and children who have never been enrolled in school. Only 30 percent of never in school children in this age group have fathers who have ever gone to school, and only 2 percent of never in school children have mothers who have ever gone to school. For in school children, 62 percent have fathers who have attended school, and 12 percent have mothers who have ever attended school.
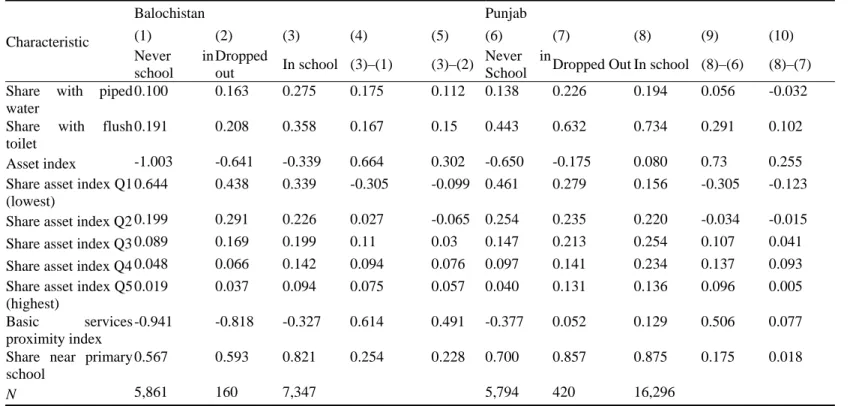
Wealth disparities are also evident by schooling status: 64 percent of never in school children belong to the poorest asset index quintiles, as compared to only 44 percent of dropouts and 34 percent of in school children. Similarly, never in school children tend to live further away from basic service centers, as compared to in school children. Never in school children also tend to live further away from primary schools as compared to in
school children; only 57 percent of never in school live within 15 minutes of a primary school as compared to 82 percent of in school children.
Table 3 Characteristics of Children in Balochistan and Punjab (Ages 6-10) By Schooling Status
Characteristic
Balochistan Punjab
(1) (2) (3) (4) (5) (6) (7) (8) (9) (10)
Never in school
Dropped
out In school (3)–(1) (3)–(2) Never in
School Dropped Out In school (8)–(6) (8)–(7) Age (in years) 7.754 8.928 8.213 0.459 -0.715 7.517 8.979 8.220 0.703 -0.759 Share female 0.611 0.521 0.323 -0.288 -0.198 0.531 0.434 0.461 -0.07 0.027 Share sick last week 0.042 0.048 0.037 -0.005 -0.011 0.054 0.050 0.048 -0.006 -0.002 Share literate 0.001 0.481 0.237 0.236 -0.244 0.003 0.350 0.211 0.208 -0.139 Share numerate 0.066 0.483 0.255 0.189 -0.228 0.058 0.413 0.232 0.174 -0.181 Share born first 0.197 0.167 0.150 -0.047 -0.017 0.204 0.209 0.231 0.027 0.022 Share born second 0.286 0.164 0.252 -0.034 0.088 0.253 0.233 0.265 0.012 0.032 Share born third 0.287 0.242 0.311 0.024 0.069 0.274 0.236 0.253 -0.021 0.017 Father: Age (in
years)
40.418 41.827 40.840 0.422 -0.987 41.594 43.426 41.693 0.099 -1.733 Father: Share literate 0.306 0.609 0.619 0.313 0.01 0.341 0.511 0.619 0.278 0.108 Father: Share
numerate
0.660 0.773 0.815 0.155 0.042 0.736 0.812 0.847 0.111 0.035 Father: Share
attended school
0.298 0.615 0.622 0.324 0.007 0.350 0.511 0.629 0.279 0.118 Father: Share sick
last week
0.028 0.100 0.019 -0.009 -0.081 0.076 0.079 0.071 -0.005 -0.008 Mother: Age (in
years)
35.440 36.814 35.706 0.266 -1.108 36.980 38.127 37.028 0.048 -1.099 Mother: Share
literate
0.027 0.058 0.124 0.097 -0.485 0.129 0.293 0.371 0.242 0.078 Mother: Share
numerate
0.361 0.248 0.513 0.152 0.265 0.592 0.683 0.699 0.107 0.016 Mother: Share
attended school
0.019 0.115 0.118 0.099 0.003 0.130 0.299 0.377 0.247 0.078 Mother: Share sick
last week
0.050 0.072 0.050 0 -0.022 0.082 0.086 0.081 -0.001 -0.005 Share rural 0.879 0.838 0.698 -0.181 -0.14 0.826 0.711 0.694 -0.132 -0.017 Number of
household members
7.244 7.883 7.107 -0.137 -0.776 7.518 7.294 7.153 -0.365 -0.141 Number of children 4.767 5.177 4.694 -0.073 -0.483 5.076 4.881 4.710 -0.366 -0.171 Number of children
5 years
1.051 1.035 1.166 0.115 0.131 1.232 0.979 1.002 -0.23 0.023 Share with electrical
lighting
0.620 0.780 0.760 0.14 -0.02 0.811 0.923 0.944 0.133 0.021 Share with
electrical/gas cooking
0.118 0.150 0.265 0.147 0.115 0.140 0.265 0.307 0.167 0.042
Table 3 Characteristics of Children in Balochistan and Punjab (Ages 6-10) By Schooling Status
Characteristic
Balochistan Punjab
(1) (2) (3) (4) (5) (6) (7) (8) (9) (10)
Never in school
Dropped
out In school (3)–(1) (3)–(2) Never in
School Dropped Out In school (8)–(6) (8)–(7) Share with piped
water
0.100 0.163 0.275 0.175 0.112 0.138 0.226 0.194 0.056 -0.032 Share with flush
toilet
0.191 0.208 0.358 0.167 0.15 0.443 0.632 0.734 0.291 0.102 Asset index -1.003 -0.641 -0.339 0.664 0.302 -0.650 -0.175 0.080 0.73 0.255 Share asset index Q1
(lowest)
0.644 0.438 0.339 -0.305 -0.099 0.461 0.279 0.156 -0.305 -0.123 Share asset index Q2 0.199 0.291 0.226 0.027 -0.065 0.254 0.235 0.220 -0.034 -0.015 Share asset index Q3 0.089 0.169 0.199 0.11 0.03 0.147 0.213 0.254 0.107 0.041 Share asset index Q4 0.048 0.066 0.142 0.094 0.076 0.097 0.141 0.234 0.137 0.093 Share asset index Q5
(highest)
0.019 0.037 0.094 0.075 0.057 0.040 0.131 0.136 0.096 0.005 Basic services
proximity index
-0.941 -0.818 -0.327 0.614 0.491 -0.377 0.052 0.129 0.506 0.077 Share near primary
school
0.567 0.593 0.821 0.254 0.228 0.700 0.857 0.875 0.175 0.018
N 5,861 160 7,347 5,794 420 16,296
Notes: Statistics derived from 2010/11 PSLM data.
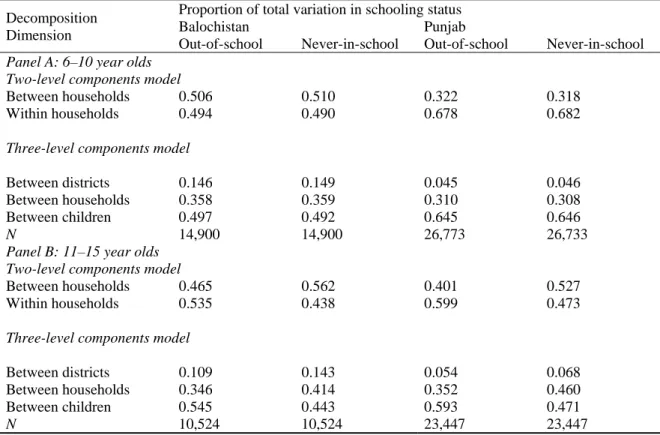
It is observed that based on the two components model, for children between the ages of 6 and 10, the majority of variation in schooling status in Balochistan is explained between households rather than within households. However, in the three level components model within household differences account for the majority of the variation in schooling status. The reason for this is because district level variation in the three components model accounts for some of the between household variation found in the two components model. For 11-15 year olds, the results are similar; the majority of variation in schooling status can be attributed to within household differences, however, a large share of the variation can also be explained by between household differences. For the Punjab province the results are slightly different- the majority of variation in schooling status can be attributed to within household differences rather than between household differences for both the 6-10 age group and the 11-15 year age group.
Table 4 Decomposition of Out-of-School Variation, 2010/11
Decomposition Dimension
Proportion of total variation in schooling status
Balochistan Punjab Out-of-school Never-in-school Out-of-school Never-in-school Panel A: 6–10 year olds
Two-level components model
Between households 0.506 0.510 0.322 0.318 Within households 0.494 0.490 0.678 0.682 Three-level components model
Between districts 0.146 0.149 0.045 0.046
Between households 0.358 0.359 0.310 0.308
Between children 0.497 0.492 0.645 0.646
N 14,900 14,900 26,773 26,733
Panel B: 11–15 year olds Two-level components model
Between households 0.465 0.562 0.401 0.527 Within households 0.535 0.438 0.599 0.473 Three-level components model
Between districts 0.109 0.143 0.054 0.068
Between households 0.346 0.414 0.352 0.460
Between children 0.545 0.443 0.593 0.471
N 10,524 10,524 23,447 23,447
Notes: Statistics derived from 2010/11 PSLM data.
The results for Balochistan suggest that for the 6-10 age group, varying characteristics of households may explain the majority of variation in schooling status in the province.
However, for 11-15 year olds in the province it seems that there are within household characteristics that explain the variation in schooling status, and these should be examined further.
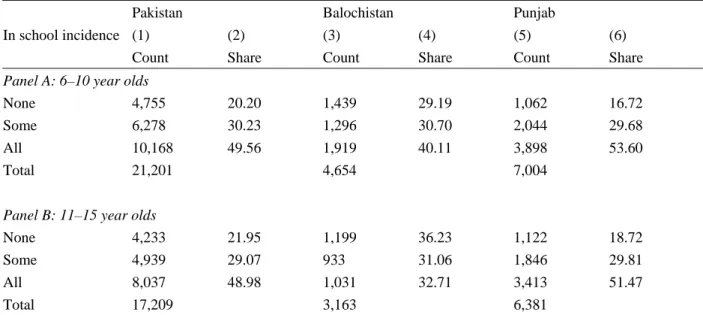
Given the results from the decomposition of variance analysis, it is worthwhile exploring the household incidence of schooling for households in Balochistan, Punjab, and Pakistan with multiple children in two respective age groups; 6-10 year olds, and 11-15 year olds.
The central question we are addressing here is, what share of households with children in the respective age groups sends no children to school, sends some children to school and sends all children to school? The results show that 40 percent of households in Balochistan with multiple children between the ages of 6 and 10, are sending all their children to school. 29 percent of households are sending none of their children to school, while 31 percent are sending some of their children to school. For households with multiple 11-15 year olds, 36 percent have no children enrolled in school, while 31 percent have some children enrolled in school, and 33 percent have all children enrolled in school. When compared with Punjab and the country as a whole, it is evident that the
share of households in Balochistan that send no children to school (across both age groups) is relatively large.
To determine whether gender may play role to send children to school, Table 6 presents the incidence of schooling for households separately by gender for children between the ages of 6 and 15. The purpose of this table is to determine whether there is any gender bias within households in sending girls to school. The results are striking: 57 percent of households with multiple girls between the ages of 6 and 15, send none of their girls to school, while only 25 percent of households have enrolled all their girls in school. For households with multiple boys in the relevant age group, only 23 percent of households send no boys to school while 56 percent of households send all their boys to school.
These figures are drastically different from the numbers for Punjab, where only 22 percent of households are not sending any of their girls to school.
Table 6 Household Incidence of Schooling with Multiple Girls and Boys (Ages 6-15), 2010/11
In School Incidence
Pakistan Balochistan Punjab
Girls Boys Girls Boys Girls Boys (1) (2) (3) (4) (5) (6) (7) (8) (9) (10) (11) (12) Count Share Count Share Count Share Count Share Count Share Count Share None 5,392 29.23 3,276 16.01 1,722 56.61 987 22.52 1,099 21.52 844 14.62 Some 3,789 26.23 5,065 28.57 484 17.58 880 21.87 1,538 28.05 1,892 30.55 All 6,283 44.55 10,706 55.42 735 25.81 2,290 55.61 2,917 50.43 3,561 54.83 Total 15,464 19,047 2,941 4,157 5,554 6,297 Notes: Counts are sample counts. Shares are adjusted for sampling weights. Statistics have been calculated separately by gender for households with multiple girls and boys between the ages and 6–15.
Two models were created for the regression analysis- one non-interactive model, and one interactive model for both age groups (6-10 and 11-15). The dependent variable is coded Table 5 Household Incidence of Schooling with Multiple Children, Pakistan, Balochistan and Punjab
In school incidence
Pakistan Balochistan Punjab
(1) (2) (3) (4) (5) (6) Count Share Count Share Count Share Panel A: 6–10 year olds
None 4,755 20.20 1,439 29.19 1,062 16.72
Some 6,278 30.23 1,296 30.70 2,044 29.68
All 10,168 49.56 1,919 40.11 3,898 53.60
Total 21,201 4,654 7,004
Panel B: 11–15 year olds
None 4,233 21.95 1,199 36.23 1,122 18.72
Some 4,939 29.07 933 31.06 1,846 29.81
All 8,037 48.98 1,031 32.71 3,413 51.47
Total 17,209 3,163 6,381
Notes: Counts are sample counts. Shares are adjusted for sampling weights. Households in Panel A are those with multiple 6–10 year olds. Households in Panel B are those with multiple 11–15 year olds.
0 if a child is enrolled in school and 1 if child is out of school. The independent variables for the analysis measure child characteristics, parental characteristics and household characteristics.
The child characteristics include age, age squared, gender (1 if female; 0 if male), 1st born (1 if child is first born child; 0 if not), and for children in the 11-15 age group an employment variable is also included (1 if the child did any work for pay, profit or
‘family gain’ during the last month for at least one hour; 0 if not working).
Only two parental characteristics are used for this analysis; one variable measuring whether or not the father of the child has ever attended school, and another variable measuring whether or not the child’s mother has ever attended school (1 if yes, 0 if no).
A variable that contains information on parental literacy was not included due to the fact that parents’ literacy status and whether or not they have attended school are very closely correlated.
Household characteristics in the model, include household size, the number of children less than 5 years old, rural (1 if rural; 0 if not), home ownership (1 if living in own home;
0 if not), time to nearest primary/middle school (with the base group set as living within 0-14 minutes of a primary school). Asset Index wealth quintiles are also included in this analysis as a measure of wealth, because of the lack in consistency in the manner in which income was reported in the surveys (the highest or richest quintile is set as the comparison group). A basic services proximity index was created to measure distance to the nearest hospital, and grocery store and this measure was included in the model in the form of terciles, with tercile 3 (living closest to basic services) serving as the base group.
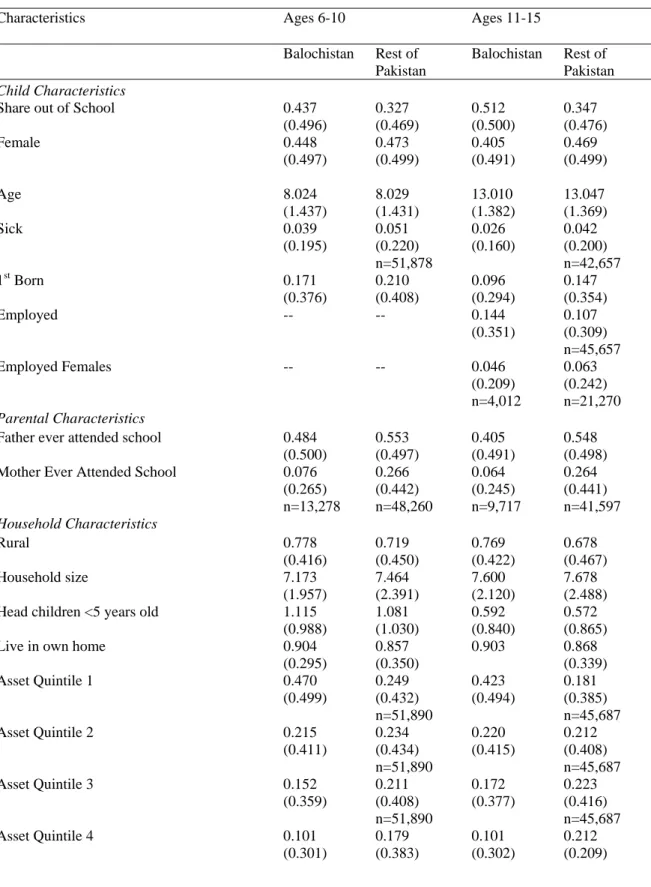
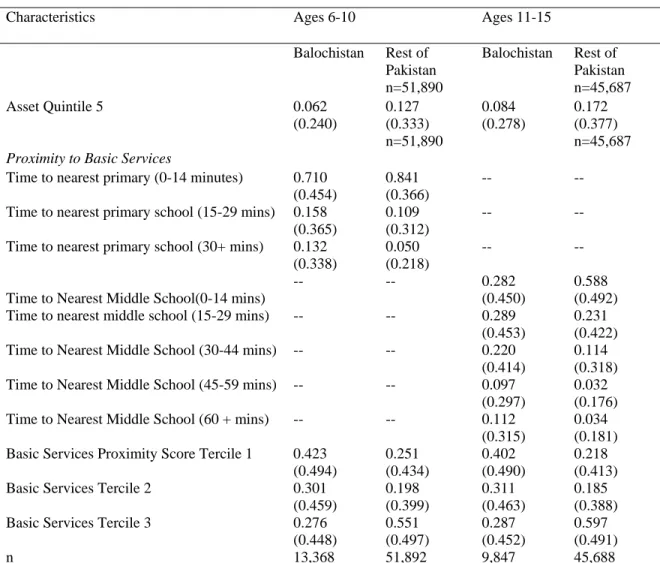
Basic descriptive statistics for all these variables are presented in table 7 below.
Table 7 Descriptive Statistics
Characteristics Ages 6-10 Ages 11-15 Balochistan Rest of
Pakistan
Balochistan Rest of Pakistan Child Characteristics
Share out of School 0.437 (0.496)
0.327 (0.469)
0.512 (0.500)
0.347 (0.476) Female 0.448
(0.497)
0.473 (0.499)
0.405 (0.491)
0.469 (0.499) Age 8.024
(1.437)
8.029 (1.431)
13.010 (1.382)
13.047 (1.369) Sick 0.039
(0.195)
0.051 (0.220) n=51,878
0.026 (0.160)
0.042 (0.200) n=42,657
1st Born 0.171
(0.376)
0.210 (0.408)
0.096 (0.294)
0.147 (0.354)
Employed -- -- 0.144
(0.351)
0.107 (0.309) n=45,657
Employed Females -- -- 0.046
(0.209) n=4,012
0.063 (0.242) n=21,270 Parental Characteristics
Father ever attended school 0.484 (0.500)
0.553 (0.497)
0.405 (0.491)
0.548 (0.498) Mother Ever Attended School 0.076
(0.265) n=13,278
0.266 (0.442) n=48,260
0.064 (0.245) n=9,717
0.264 (0.441) n=41,597 Household Characteristics
Rural 0.778 (0.416)
0.719 (0.450)
0.769 (0.422)
0.678 (0.467) Household size 7.173
(1.957)
7.464 (2.391)
7.600 (2.120)
7.678 (2.488) Head children <5 years old 1.115
(0.988)
1.081 (1.030)
0.592 (0.840)
0.572 (0.865) Live in own home 0.904
(0.295)
0.857 (0.350)
0.903 0.868 (0.339) Asset Quintile 1 0.470
(0.499)
0.249 (0.432) n=51,890
0.423 (0.494)
0.181 (0.385) n=45,687 Asset Quintile 2 0.215
(0.411)
0.234 (0.434) n=51,890
0.220 (0.415)
0.212 (0.408) n=45,687 Asset Quintile 3 0.152
(0.359)
0.211 (0.408) n=51,890
0.172 (0.377)
0.223 (0.416) n=45,687 Asset Quintile 4 0.101
(0.301)
0.179 (0.383)
0.101 (0.302)
0.212 (0.209)
Table 7 Descriptive Statistics
Characteristics Ages 6-10 Ages 11-15 Balochistan Rest of
Pakistan
Balochistan Rest of Pakistan
n=51,890 n=45,687 Asset Quintile 5 0.062
(0.240)
0.127 (0.333) n=51,890
0.084 (0.278)
0.172 (0.377) n=45,687 Proximity to Basic Services
Time to nearest primary (0-14 minutes) 0.710 (0.454)
0.841 (0.366)
-- -- Time to nearest primary school (15-29 mins) 0.158
(0.365)
0.109 (0.312)
-- -- Time to nearest primary school (30+ mins) 0.132
(0.338)
0.050 (0.218)
-- --
Time to Nearest Middle School(0-14 mins)
-- -- 0.282 (0.450)
0.588 (0.492) Time to nearest middle school (15-29 mins) -- -- 0.289
(0.453)
0.231 (0.422) Time to Nearest Middle School (30-44 mins) -- -- 0.220
(0.414)
0.114 (0.318) Time to Nearest Middle School (45-59 mins) -- -- 0.097
(0.297)
0.032 (0.176) Time to Nearest Middle School (60 + mins) -- -- 0.112
(0.315)
0.034 (0.181) Basic Services Proximity Score Tercile 1 0.423
(0.494)
0.251 (0.434)
0.402 (0.490)
0.218 (0.413) Basic Services Tercile 2 0.301
(0.459)
0.198 (0.399)
0.311 (0.463)
0.185 (0.388) Basic Services Tercile 3 0.276
(0.448)
0.551 (0.497)
0.287 (0.452)
0.597 (0.491)
n 13,368 51,892 9,847 45,688
Notes: All statistics have been adjusted for sample weights. Statistics presented are means, and standard deviations in parenthesis. Rest of Pakistan includes KPK, Sindh, Punjab and ICT.
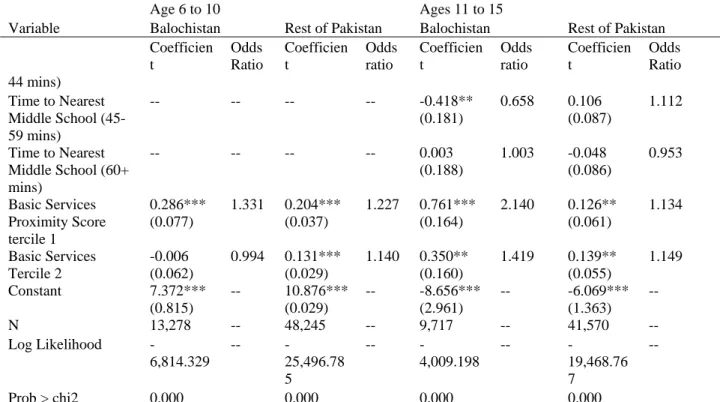
The results of the bi nomial logistic regression are presented in table 8 below. For each model, the first columns contain parameter estimates along with standard errors in parenthesis, and the second columns contain odds ratios. These ratios are calculated by exponentiating coefficient estimates from the logistic regression, to facilitate the interpretation of the results.
Table 8 Regression Results for Balochistan and the Rest of Pakistan
Age 6 to 10 Ages 11 to 15
Variable Balochistan Rest of Pakistan Balochistan Rest of Pakistan Coefficien
t
Odds Ratio
Coefficien t
Odds ratio
Coefficien t
Odds ratio
Coefficien t
Odds Ratio Child Characteristics
Female 1.514***
(0.044)
4.543 0.587***
(0.022)
1.799 2.740***
(0.065)
15.487 1.343***
(0.027)
3.828 Age -2.183***
(0.203)
0.113 -2.811***
(0.102)
0.060 0.600 (0.456)
1.823 0.327 (0.209)
1.387
Age2 0.120***
(0.013)
1.128 0.155***
(0.006)
1.168 -0.014 (0.017)
0.987 -0.003 (0.008)
0.997 Sick -0.032
(0.107)
0.968 0.067 (0.049)
1.070 0.263*
(0.155)
1.301 0.099 (0.062)
1.104 1st Born 0.007
(0.067)
1.007 -0.022 (0.034)
0.978 0.290***
(0.101)
1.336 -0.045 (0.042)
0.956
Employed -- -- -- -- 3.220***
(0.131)
25.018 2.737***
(0.057)
15.442 Female x employed -- -- -- -- -2.084***
(0.399)
0.124 -1.066***
(0.122)
0.344 Parental Characteristics
Father ever attended school
-1.092***
(0.046)
0.335 -0.691***
(0.023)
0.501 -1.160***
(0.063)
0.313 -0.650***
(0.027)
0.522 Mother Ever
Attended School
-0.956***
(0.109)
0.385 -0.731***
(0.035)
0.482 -1.347***
(0.148)
0.260 -0.920***
(0.040)
0.399 Household Characteristics
Rural 0.185***
(0.072)
1.204 -0.144***
(0.030)
0.866 0.437***
(0.093)
1.547 -0.128***
(0.033)
0.880 Household size 0.073***
(0.011)
1.076 0.049***
(0.005)
1.050 0.092***
(0.014)
1.096 0.046***
(0.005)
1.047 Head children <5
years old
-0.141***
(0.026)
0.868 -0.028**
(0.013)
0.972 -0.067*
(0.035)
0.936 -0.003 (0.015)
0.997 Live in own home -0.028
(0.081)
0.972 -0.277***
(0.031)
0.758 0.029 (0.111)
1.030 -0.133***
(0.038)
0.876 Asset Quintile 1 1.371***
(0.131)
3.939 1.515***
(0.054)
4.549 1.667***
(0.143)
5.298 2.085***
(0.059)
8.047 Asset Quintile 2 0.898***
(0.130)
2.454 0.847***
(0.051)
2.333 1.152***
(0.140)
3.164 1.310***
(0.054)
3.707 Asset Quintile 3 0.321***
(0.130)
1.378 0.447***
(0.051)
1.563 0.484***
(0.137)
1.622 0.881***
(0.052)
2.413 Asset Quintile 4 0.091
(0.140)
1.095 0.166***
(0.051)
1.180 0.158 (0.143)
1.171 0.499***
(0.051)
1.647 Proximity to Basic Services
Time to nearest primary school (15- 29 mins)
0.322***
(0.074)
1.380 0.202***
(0.044)
1.224 -- -- -- --
Time to nearest primary school (30+
mins)
1.308***
(0.131)
3.699 0.398***
(0.056)
1.489 -- -- -- --
Time to nearest middle school (15- 29 mins)
-- -- -- -- -0.253
(0.164)
0.777 0.115**
(0.056)
1.121
Time to Nearest Middle School (30-
-- -- -- -- -0.225
(0.170)
0.799 0.182***
(0.064)
1.199
Table 8 Regression Results for Balochistan and the Rest of Pakistan
Age 6 to 10 Ages 11 to 15
Variable Balochistan Rest of Pakistan Balochistan Rest of Pakistan Coefficien
t
Odds Ratio
Coefficien t
Odds ratio
Coefficien t
Odds ratio
Coefficien t
Odds Ratio 44 mins)
Time to Nearest Middle School (45- 59 mins)
-- -- -- -- -0.418**
(0.181)
0.658 0.106 (0.087)
1.112
Time to Nearest Middle School (60+
mins)
-- -- -- -- 0.003
(0.188)
1.003 -0.048 (0.086)
0.953
Basic Services Proximity Score tercile 1
0.286***
(0.077)
1.331 0.204***
(0.037)
1.227 0.761***
(0.164)
2.140 0.126**
(0.061)
1.134
Basic Services Tercile 2
-0.006 (0.062)
0.994 0.131***
(0.029)
1.140 0.350**
(0.160)
1.419 0.139**
(0.055)
1.149 Constant 7.372***
(0.815)
-- 10.876***
(0.029)
-- -8.656***
(2.961)
-- -6.069***
(1.363) --
N 13,278 -- 48,245 -- 9,717 -- 41,570 --
Log Likelihood -
6,814.329
-- -
25,496.78 5
-- -
4,009.198
-- -
19,468.76 7
--
Prob > chi2 0.000 0.000 0.000 0.000 Notes: the dependent variable is out of school (1 if out of school, 0 if in school). * indicates significance at the 0.10 level. ** indicates significance at the 0.05 level,*** indicates significance at the 0.001 level.
5. Discussion
The results will be discussed separately for each age group and each model. For Balochistan, the results for 6-10 year olds indicate that females are 4.5 times more likely than males to be out of school, all else equal. Moreover, in this age group, as age increases, the child is more likely to be enrolled in school, stated differently, younger children are more likely to be out of school than older children. Parental education is another significant factor that explains the variation in schooling status; if a child’s father or mother has ever attended school, he or she is less likely to be out of school.
Household characteristics indicate that children living in rural areas are 1.2 times more likely to be out of school than their urban counterparts. Children coming from larger households are more likely to be out of school, while children with a greater number of siblings less than five years old are less likely to be out of school. Children coming from families that are in the bottom asset index quintile are 3.9 times more likely to be out of school than those who are in the top wealth quintile.
Distance from primary school is another significant predictor of being out of school, as children who live within 15-29 minutes of a primary school, are 1.4 times more likely to be out of school than children who live less than 15 minutes from a primary school. As distance to primary school increases, the likelihood of being out of school increases;
children who live more than 30 minutes away from a primary school are more than three
times as likely to be out of school as children who live less than 15 minutes away from a primary school.
For the 11 to 15 year old age group, the results are generally similar to the younger age cohort with a few exceptions. Greater gender disparity is observed in this age group, as females are 15.5 times more likely to be out of school than males. Unlike the 6-10 year age group, age is not a statistically significant predictor of being out of school however, first born children are 1.3 times more likely to be out of school as compared to all other children in the household. Children whose fathers have attended school in the past are a third as likely to be out of school as compared to children with fathers who have never attended school. Similarly, children whose mothers have attended school are a quarter as likely to be out of school, relative to children with mothers who have never gone to school.
Household characteristics tell a similar story; children coming from larger families are more likely to be out of school. Children belonging to households in the bottom asset index quintiles are 5 times more likely to be out of school than children belonging to the wealthiest asset index quintiles. Moreover, children who are working are 25 times more likely to be out of school than children who are not working. Middle school distance is not a statistically significant predictor of being out of school except for children who live between 45 minutes and 59 minutes of a primary school, who are less likely to be out of school than those who live less within 14 minutes away from a middle school. This result is counterintuitive as one would expect children who live further away from a middle school to be out of school as compared to children who live near a middle school.
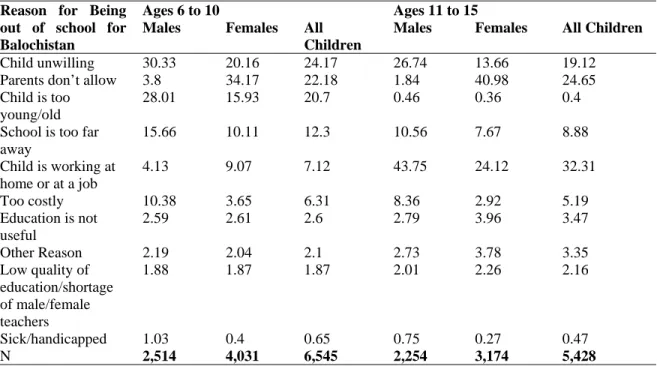
The PSLM surveys also contain questions that solicit information from parents regarding why a child is not enrolled in school. For the ease of interpretation the responses have been classified in to the categories listed in table 9 below. The responses have been presented separately by gender, and for the two different age groups. The results indicate that the primary reason for boys between the ages of 6 and 10 for being out of school is that the children are unwilling to go to school. The second most common answer reported is that the child is too young to go to school. 16 percent of respondents cited school distance as the primary reason, while only 10 percent of respondents claimed that reason for not going to school was because education was too expensive. For girls between the ages of 6 and 10, the primary reason for not attending school is that parents do not allow them to go to school (34 percent). One fifth of respondents also claimed that the girls are unwilling to go to school, and 16 percent stated that the child was too young to go to school.
In the 11 to 15 age group, 44 percent of respondents claimed that the primary reason for boys being out of school is because they are working. For girls in the 11 to 15 year age group, 41 percent of respondents cited that their parents did not allow them to go to school, while 24 percent of respondents claimed they had to help with work, therefore they could not attend school. As a child becomes older, poverty plays an increasingly important role, because they are often required to help out at home, or work rather than go to school.
6. Conclusion
Based on the results of the analysis, it is evident that when it comes to education, girls are particularly disadvantaged in Balochistan. The incidence of schooling for households with multiple girls shows that 57 percent of households in Balochistan with girls between the ages of 6-15 do not send any of their girls to school. These gender wide disparities are captured in the PSLM surveys when respondents indicate that the primary reason girls between the ages of 6-10 and 11-15 do not attend school is because parents do not allow them to attend school. The quantitative analysis corroborates this claim with females being more likely than boys to be out of school, all else equal. Moreover, in the 6-10 age group, the results of the regression analysis confirm the responses of parents who cite age as one of the reasons why their children are not enrolled in school: The younger the child is, the more likely he or she is to be out of school. Poverty also plays a major role in determining whether or not children go to school, as we see that children from poorer households are less likely to be in school and in the 11-15 age group, children who are working for pay, profit, or ‘family gain’ are more likely to be out of school than those who are not working. Lastly, primary school distance also plays a role for children between the ages of 6-10; children who live further away from primary schools are more likely to be out of school than children who live within 15 minutes of a primary school.
Table 9 Reasons for Being out of School, Children in Balochistan
Reason for Being out of school for Balochistan
Ages 6 to 10 Ages 11 to 15 Males Females All
Children
Males Females All Children Child unwilling 30.33 20.16 24.17 26.74 13.66 19.12 Parents don’t allow 3.8 34.17 22.18 1.84 40.98 24.65
Child is too young/old
28.01 15.93 20.7 0.46 0.36 0.4 School is too far
away
15.66 10.11 12.3 10.56 7.67 8.88 Child is working at
home or at a job
4.13 9.07 7.12 43.75 24.12 32.31 Too costly 10.38 3.65 6.31 8.36 2.92 5.19
Education is not useful
2.59 2.61 2.6 2.79 3.96 3.47
Other Reason 2.19 2.04 2.1 2.73 3.78 3.35 Low quality of
education/shortage of male/female teachers
1.88 1.87 1.87 2.01 2.26 2.16
Sick/handicapped 1.03 0.4 0.65 0.75 0.27 0.47
N 2,514 4,031 6,545 2,254 3,174 5,428
Notes: Sample only includes out of school children in the relevant age group for Balochistan. Numbers reported in columns are percentages. All proportions have been adjusted for sample weights. Source:
PSLM Surveys 2010/11
BIBLIOGRAPHY
Anzar , U. (1999). Education reforms in balochistan 1990-1998. The World Bank.
Dancer , D. M., & Rammohan, A. (2007). Determinants of schooling in egypt: the role of gender and rural/urban residence. Oxfod Development Studies, 35(2), 171-195. doi:
10.1080/13600810701322041
Government of Pakistan, Pakistan Bureau of Statistics. (2011). Pakistan social and living standards measurement survey (2010-11).
Hazarika, G. (2001). The sensitivity of primary school enrollment to the costs of post-primary schooling in rural pakistan: A gender perspective. Education Economics, 9(3), 237-244.
Kim, J., Alderman, H., & Orazem, P. F. (1998). Can private school subsidies increase enrollment for the poor? the quetta urban fellowship program. The World Bank Economic Review, 13(3), 443-465.
Konstantopoulos, S. (2007). A comment on variance decomposition and nesting effects in two- and three-level designs. IZA, no. 3178.
United Nations , UNESCO Institute for Statistics. (2012). Net enrolment ratio in primary education (ner). Retrieved from: http://data.un.org/Data.aspx?d=SOWC&f=inID:7