Country Reports
What are the Preconditions and Drivers
for the Development of Waste Management in a Country?
Ella Stengler and Maxime Pernal
1. Waste management in Europe: State of play ...94
1.1. EU policy ...94
1.2. Implementation of EU waste legislation ...94
2. Germany ...96
3. Austria ...98
4. Slovenia...100
5. Belgium ...102
6. Netherlands ...105
7. Conclusions ...107
8. References ...108
Each year, the European Union (EU) produces more than 2.4 billion tonnes of waste of which approximately ten percent is composed of municipal or similar waste [29, 30]. With the publication of the Circular Economy package by the European Commis- sion (EC) in December 2015 [10], waste management is back under the spotlights of EU policy. The EC proposals include ambitious targets for municipal and packaging waste recycling, as well as a target on landfill reduction. A handful of EU Member States achieve them already or are close to achieving these targets, while many more are lagging behind.
In order to help these less performing States this paper will assess waste management in each of the most performing Member States. In particular the focus will be on EU waste policy implementation, waste management systems and waste management financing as they are the elements that give the most opportunities of inspiration for other Member States. From this, various factors contributing to a good development of waste management will emerge.
Country Reports
1. Waste management in Europe: State of play 1.1. EU policy
Since 1975 and the first version of the Waste Framework Directive [11], the EU has been active in providing guidance for its Members States regarding waste policy. This guidance gradually developed (amended by Directive 91/156/EEC) by providing de- finitions, new principles – such as waste hierarchy, proximity and polluter-pays – and new obligations.
In 2006 and 2008, a new Waste Framework Directive [15] (WFD) was adopted and amended. It set targets for recycling, introduced an extended producer responsibility and mandatory separate collection of relevant waste streams.
In 1994, the Directive on packaging and packaging waste [12] (PPWD) was adopted. It aimed to reduce the production of packaging waste and to improve re-use and recycling of this waste stream. Recycling targets were adopted for each packaging waste stream.
The Directive was amended in 2004 and 2005.
An important milestone was reached in 1999 with the adoption of the Landfill Direc- tive [13], which included provisions on environmental protection as well as targets for landfill diversion of biodegradable municipal waste.
Two Directives focusing on specific waste streams were adopted in the following years:
one on waste electrical and electronic equipment (WEEE) and one on batteries and accumulators [14].
Since December 2015, these 5 Directives are under review. The European Commission aims to achieve a Circular Economy by strengthening the EU waste legislation: for municipal waste management, the legislative package proposes more ambitious targets for recycling and re-use (65 % by 2030), a landfill diversion goal (10 % maximum by 2030), reinforced extended producer responsibility and a strategy on eco-design. The proposals also include elements to improve the implementation of EU waste policy.
Despite being in application for more than 25 years, EU waste legislation still faces many implementation issues.
1.2. Implementation of EU waste legislation
The implementation of these EU provisions was easier for some Member States than for others. The 2005 report on the national strategies for the reduction of biodegradable municipal waste going to landfills [6] shoes that Austria, Germany, the Netherlands and the Flemish region fulfilled the last (2016) reduction target set by Article 5 of the Landfill Directive (35 % of biodegradable municipal waste going to landfills compared to 1995), eleven years before its due date. These countries are now leaders of recycling in the EU.
On the other hand, the 2006 waste legislation implementation report shows that other Member States experienced early transposition issues of the Landfill Directive [7]. In particular, the European Court of Justice ruled against the United Kingdom and France
Country Reports
for incomplete transposition of the Directive [2] and against Ireland and Greece for systematic failures regarding uncontrolled landfills [3]. Infringement proceedings were started against Spain, Greece, Ireland, Belgium, Italy and France.
The following implementation report [8] focusing on years 2004 to 2006 and published in 2009 notes that ten years after its adoption, the practical implementation of the Landfill Directive remains highly unsatisfactory. Not all of the provisions of the Directive were transposed and a considerable number of infringement cases were still open. Regar- ding the implementation of the first version of the WFD this report highlights that 27 infringement cases were pending, including 10 for bad application.
This situation continued in the following years – in particular for the application of the Landfill Directive, as shown by the 2013 and 2017 implementation reports [9]. One of the most important issues is that according to Article 6(a) of the Landfill Directive only waste that has been subject to treatment is allowed to be landfilled [26].
In this context the legal and technical implications of the European Court of Justice Malagrotta [1] ruling sets main elements according to which Member States must:
• apply the most appropriate treatment of waste prior to landfilling;
• ensure adequate selection of waste streams;
• ensure stabilisation of biodegradable waste;
• and have an adequate network of waste treatment installations.
82 landfill sites have been visited in Member States with high landfill rates and only about a quarter (21) were found to be compliant with pre-treatment requirements.
As for the implementation of the 2008 WFD, the reports focused on this topic show that many Member States – in particular the newcomers from 2004 – rely heavily on landfilling and therefore do not apply the waste hierarchy [34]. Austria, Belgium (Flan- ders), Germany and the Netherlands showed a sufficient capacity for recycling since the first reporting period (report published in 2009, based on 2005 data).
The latest data from Eurostat [30] indicates that five Member States recycle 50 % or more of their municipal waste, thereby achieving already now the 2020 target set by the 2008 WFD. Fifteen countries recycle 40 % or less of their municipal waste, and six countries recycle even less than 20 %.
The recent proposals by the European Commission suggest a 65 % target for municipal waste recycling in the EU by 2030. It is therefore important to study how the most performing Member States – the five over 50 % of recycling – achieved this high rate, in order to highlight what needs to be done by the ones that are lagging behind. The- se five countries are: Germany (recycling: 68 %), Austria (recycling: 58 %), Slovenia (recycling: 58 %), Belgium (recycling: 55 %), and the Netherlands (recycling: 52 %).
This article will assess the situation in these five countries, with information coming primarily from each country’s national factsheet of the European Commission’s 2014 Assessment of separate collection schemes in the 28 capitals of the EU study and each country’s European Environmental Agency 2013 Municipal Waste Management report.
All other sources are indicated separately.
Country Reports
2. Germany
Germany is the leading country in the EU 28 as regards municipal waste recycling rates, with almost 68 % of municipal waste recycled or composted in 2015. It is also the country with the lowest landfill rates in the EU with 0.2 % landfilled 2015, thereby already achieving both 2030 circular economy targets proposed by the European Com- mission in December 2015. Germany’s recycling rate in 1995 was higher than half of EU Member States in 2015. To manage its residual waste, the country was primarily using landfills in the late 1990s but transitioned efficiently to more recycling and a proportional increase in Waste-to-Energy incineration until practically phasing out of landfilling in mid-2005 and reaching 61 % recycling simultaneously. Since 2006 the recycling rate has been further increasing, while the incineration rate has been decreasing.
Table 1: Municipal waste treatment in Germany, 1995 to 2015
1995 1996 1997 1998 1999 2000 2001 2002 2003 2004 2005 %
Landfill/disposal 43 39 37 35 28 26 26 21 19 18 9 Total incineration 18 19 19 20 20 22 22 23 23 26 31 Recycling + composting 39 42 44 46 51 53 52 56 58 56 61 Landfill ban transition period
2006 2007 2008 2009 2010 2011 2012 2013 2014 2015 %
Landfill/disposal 1 1 1 0 0 0 0 0 0 0 Total incineration 37 36 36 37 37 37 35 34 33 32 Recycling + composting 62 63 64 63 63 63 65 65 67 68 Source: Eurostat
Implementation of EU legislation
The implementation of the 1999 Landfill Directive was made easier by having a very similar regulation already in place. In 1993, an administrative regulation (TASi) limiting the organic content in waste going to landfills to less than 3 % Total Organic Carbon (TOC) was adopted, thereby effectively banning landfilling of untreated municipal waste. The transition period to achieve this target would last twelve years, until 1st June 2005. Two ordinances were however adopted (in 2001 [37] and 2002 [38]), aiming to fix the loopholes of the 1993 regulation and to fully transpose the Landfill Directive.
The effect of this national initiative focused on landfill diversion is clearly visible in the waste management data. In ten years, landfilling of municipal waste was reduced to close to 0 % while recycling increased by more than 50 %.
Germany swiftly transposed the following EU waste legislation. The 2008 WFD waste recycling targets were achieved before the Directive was adopted, and a sys- tem of separate waste collection for specific waste streams was already in place.
Country Reports
The Circular Economy Act of 2012 [33] transposed directly most of the other require- ments of the 2008 WFD. It also included a mandatory separate collection of bio-waste as from 1st January 2015.
Other national initiatives For more than 25 years, Germany has had a strategy for increasing recycling and di- verting municipal solid waste away from landfills [17].
In 1991, Germany was the first country in the EU to introduce producer responsibi- lity through a Packaging Ordinance [39]. This was also the first element of a national strategy to reduce landfilling of municipal waste.
The German government committed itself in 1999 to recovering all municipal waste by 2020, which includes recovering the residues from all waste treatment operations, including Waste-to-Energy. Additionally to the 2004 PPWD targets, the paper industry is voluntarily committed to recycle 80 % of waste paper [28].
Organisation of the waste management Responsibility for waste management and environmental protection is shared between the national Government, the Federal States and local authorities. Priorities, strategic planning and requirements for waste facilities are set at the national level. Supplementary regulations to the national law such as regional management concepts and rules on requirement for disposal are adopted in each Federal State as a waste management act.
The main responsibility for separate collection lies with the Federal States and local authorities, therefore there is no unique collection system.
Most of the paper and cardboard waste from private households is collected door-to- door in a separate bin, even though co-mingled collection and collection points exist in very rare cases. Plastic and metal packaging waste are collected together door-to-door [22]. Collection points also exist.
For glass there are bring systems installed, distinguished by colour (white, brown, green).
Bio-waste was collected door-to-door in a separate bin for 52 % of private households in Germany in 2012 [19]. Since 1st January 2015, separate collection of bio-waste is mandatory (if technically and economically feasible).
Waste management financing Municipal Waste collection and disposal systems are generally financed through mu- nicipal payments in the form of usage fees [35]. In practice this means that all estates must be connected to the public waste disposal system. In return for this service, the municipality collects fees as established by the municipal law.
The services provided determine the level of the fees. In general, a basic fee is deman- ded to cover contingency costs. In some areas this fee is based on the number of usage units at one’s premises. The liable person to pay the fee is the owner of the estate, who
Country Reports
is not always the person producing the waste. Some areas, however, apply a stricter pay-as-you-throw scheme and charge inhabitants according to the amount sent for management. If, for instance, the grey bin which contains the residual waste has a bigger size, the price is higher.
3. Austria
With 58 % recycling and 3 % landfilling of municipal waste in 2015, Austria is the se- cond country to recycle the most in EU 28. The recycling rates have been stable around 60 % since 1996. Austria was proactive in waste legislation, adopting provision before the entry into force of EU legislation. Table 2 shows that Austria has a long tradition of high level of recycling, with a high share of bio-waste composting, and highlights that the country was very swift in diverting waste from landfills.
Table 2: Municipal waste treatment in Austria, 1995 to 2015
1995 1996 1997 1998 1999 2000 2001 2002 2003 2004 2005 %
Landfill/disposal 43 33 32 32 32 31 31 30 28 12 12 Total incineration 11 10 10 9 9 10 10 10 11 30 28 Recycling + composting 46 57 58 59 59 58 59 60 60 58 60 Landfill ban 2004 2006 2007 2008 2009 2010 2011 2012 2013 2014 2015
%
Landfill/disposal 10 9 8 6 3 5 4 4 4 3 Total incineration 30 30 28 30 36 36 36 36 38 39 Recycling + composting 60 61 65 64 61 59 60 60 58 58 exemptions
until 2008 Source: Eurostat
Implementation of EU legislation
Austria already adopted a landfill tax in 1989, which provided a financial incentive on treating and recycling waste. Before the implementation of the Landfill Directive, the country already had a long tradition for diverting waste from landfill, as stated in a February 2013 European Environment Agency (EEA) national report. Indeed, a 1992 ordinance introduced separate collection of bio-waste and therefore led to diversion of biodegradable waste from landfills – a key objective of the Landfill Directive. A ban on landfilling of waste with Total Organic Carbon (TOC) content over 5 % came into effect in 2004.
Most of the 2008 WFD requirements were introduced years before its adoption by the Austrian Waste Management Act of 2002. The national legislation is supplemented by Waste Management Acts of the Austrian provinces.
Country Reports
Key national initiatives In 1992, Austria adopted a national separate collection policy on packaging and bio- genic waste, which entered into force in 1995. The results of these policies are very visible in the waste treatment statistics: Austria has had the highest level of municipal waste composting in Europe at least since 1995. In 1996 the country achieved 57 % municipal waste recycling (composting and recycling), a rate which would be reached by only two other EU Member States twenty years later.
The quality of the compost is regulated by the Compost Ordinance, with the aim to improve market competitiveness of the product while limiting environmental impact.
In order to ensure quality of the compost and of the separately collected waste feeds in general, the federal waste management plans acknowledged both in 2011 [31] and in 2017 [32] the strong need for intensive educational and public relations efforts.
The foundation of the national legislation relating to waste is still the 2002 Waste Ma- nagement Act, as demonstrated in the 2015 European Commission report on WFD implementation [22]. This Act came 6 years before the adoption of the reviewed 2008 WFD, and shows that Austria took initiative.
In 2015, the revised Ordinance on the Prevention and Recovery of Packaging Waste and Specific Waste Products entered into force. Additionally to changes regarding packaging waste obligations, it includes new separate collection and recycling targets for household packaging waste:
• paper, cardboard, board and corrugated-board: separate collection 80 %, recycling 95 %,
• glass: separate collection 80 %, recycling 100 %,
• metals: separate collection 50 %, recycling 100 %,
• plastic: separate collection 60 %, recycling 50 %,
• bonded drinks cartons 50 %, recycling 60 %,
• other composite materials 40 %, recycling 40 %.
It makes sense to differentiate between separate collection and the actual recycling rates as these figures can differ, sometimes a lot, depending on the suitability of the collected materials (e.g. their contamination) for recycling. Overall, the figures reported by Member States would be more meaningful if they would distinguish between what is collected separately and what is actually recycled.
Organisation of waste management The responsibility for municipal waste management is split between federal and provin- cial governments. On the one hand, the federal government sets legislation concerning hazardous waste and is in charge only when country-wide provisions are needed. The federal level also drafts a Federal Waste Management Plan. On the other hand, the nine Austrian Federal Provinces regulate independently the collection of non-hazardous municipal waste. They also create their own provincial Waste Management Plans.
Country Reports
Municipalities establish waste collection schemes, based on the regional plan.
In general, paper and cardboard is collected door-to-door. In urban areas, a combined system of door-to-door and collection points is also used. Glass is usually collected in collection points, and secondarily collected in separate bins door-to-door. Light- weight packaging including plastics are collected separately, often door-to-door and sometimes in collection points. In rare cases, plastic and metal fractions are collected together. In general, metallic waste is collected in bring points.
Finally, bio-waste is collected door-to-door in a separate bin except in very rare cases.
Waste management financing
Household waste management is mainly financed by waste collection fees paid by users:
citizens and small companies. A comprehensive range of services can be included in the fee from bulky waste collection to recycling centre and hazardous waste collection, but these fees cannot be compared between different communities as these services vary. In general, fees are calculated based on the estimated costs of investments and operations. Other factors can influence the fee: the organisational structure of waste management in the area, the physical structure of the area, the financial management, and the existing structures.
Fees are then addressed individually to the users, according to different factors. In Vienna for example, the individual fee varies according to the size of the container used for residual waste: the smaller the container, the lower the cost [5].
4. Slovenia
With 58 % recycling in 2015, Slovenia is the third Member State that recycles the most in the EU 28. In contrast to other Member States over 50 % of recycling, the country started only recently to improve its waste management: in 2004, Slovenia was recycling only 24 % of its municipal waste. Slovenia showed as well very slow progress in landfill reduction.
Table 3: Municipal waste treatment in Slovenia, 1995 to 2015
1995 1996 1997 1998 1999 2000 2001 2002 2003 2004 2005 %
Landfill/disposal 97 94 93 90 93 93 96 90 86 75 78 Total incineration 0 0 0 0 0 0 0 1 1 2 0 Recycling + composting 3 6 7 10 7 7 4 9 13 24 22
2006 2007 2008 2009 2010 2011 2012 2013 2014 2015 %
Landfill/disposal 82 75 76 74 71 60 49 43 39 24 Total incineration 0 0 1 2 1 1 2 1 0 18 Recycling + composting 18 25 23 25 28 38 49 56 61 58
Country Reports
A milestone seems to have been reached around 2010/2011, and Slovenia reached al- most 50 % recycling in 2012, while it was achieving only half of that in 2009. The 2015 figures for Slovenia (Eurostat) show suddenly an incineration rate of 18 %. As there is no dedicated incineration plant in Slovenia this figure must refer to co-incineration in industrial plants and/or to export for incineration (e.g. to Austria).
Implementation of EU legislation Slovenia chose to reduce the landfilling of biodegradable waste by pre-treating the waste via Mechanical-Biological Treatment (MBT). Although the country achieved the targets to reduce the landfilled biodegradable municipal waste (including the 2016 target: 35 % biodegradable municipal waste landfilled compared to 1995 levels) Slovenia still fails to ensure that waste landfills operate completely in compliance with EU standards and the European Commission opened an infringement case against Slovenia in 2016 [21].
The Order on the Management of Separately Collected waste (2001), the Decree on the Management of Biodegradable Kitchen and Garden Waste (2010) and the Decree on Waste (2011) are the three laws implementing the Waste Framework Directive into Slovenian legislation.
The 2008 WFD was less challenging to apply for Slovenia, as a report shows that the country implemented it without any important deviation [25]. An assessment by the European Commission shows that Slovenia even transposed some requirements of the WFD with additional requirements such as mandatory separate collection of kitchen and green garden waste, mixing ban of kitchen waste and fines for breaching the said requirements.
After the implementation of the 2008 WFD in 2011, and the adoption of the National Waste Management plan in 2012, the recycling rates increased quickly and reached the second highest level in Europe in only 4 years.
Key national initiatives The 2001 Order introduced mandatory separate collection by 1.1.2003 for non- hazardous fractions of municipal waste for both households and other waste producers.
Despite this early start on mandatory separate collection, the recycling rates increased only slowly comparatively to other countries, as seen earlier.
The 2012 Slovenian Waste Management Plan provides objectives for reuse and recycling of municipal waste: an ambitious 63 % of reuse and recycling by 2020, with a minimum aim of 59.8 % [20, 25]. Specific targets are set on bio-waste: collecting 67,000 tonnes per year of kitchen and green waste, and 8,000 tonnes of home composting by 2020.
Organisation of waste management The 2001 Order on the management of separately collected waste gives the responsibility of separate collection of waste to the municipalities. The 2012 Waste Management Plan sets door-to-door collection as the main collection system for kitchen waste and recycla- ble packaging materials. In some cases, paper and glass are also collected door-to-door.
Country Reports
There are also separate collection points for packaging waste in place since the 2001 or- der, which set up collection points in all residential areas for small paper and cardboard items, small waste glass, small waste plastic/composite materials and small waste metal packaging. Many municipalities decided to go further and to put in place a door-to- door collection. In total, in a municipality with door-to-door collection, citizens have five bins: paper, glass, plastic and metals, bio-waste and residuals [25].
Waste management financing
A landfill tax paid by the landfill operator is in place since 2001. Until 2010, the coll- ected tax went into the state budget; after October 2010 the landfill tax revenue from municipal landfills goes to municipalities and the revenue from industrial landfills to the state budget. According to a 2013 EEA report this landfill tax contributed to an increase in recycling, and most of the revenues were used to finance investment in waste management centres.
The country also made use of European funds in order to develop its waste management infrastructure. In particular, the RCERO Ljubljana project to upgrade the regional waste management of Ljubljana (which produces one third of the Slovenian waste) received more than 77.5 million euros from the EU Cohesion fund [20].
The running cost of waste collection in Ljubljana is funded by a pay-as-you-throw charge for both door-to-door and co-mingled collection. The charge is included in residual waste collection fees and finance the public waste management company Snaga, responsible for waste collection in Ljubljana and surrounding municipalities.
5. Belgium
With over 50 % recycling of municipal waste since 2001 (55 % in 2015), Belgium has been for more than a decade among the most performing EU Member States. Landfill has been steadily decreasing from 1997 to 2007, when it was phased out almost entirely.
Recycling increased swiftly between 1995 and 2000, after which it stayed stable between 50 % and 55 % (with a maximum at 57 % in 2010 and 2011).
2006 2007 2008 2009 2010 2011 2012 2013 2014 2015 %
Landfill/disposal 10 9 4 3 2 1 1 1 1 1 Total incineration 34 36 41 40 41 42 43 45 44 44 Recycling + composting 56 55 55 56 57 57 56 54 55 55 Table 4: Municipal waste treatment in Belgium, 1995 to 2015
1995 1996 1997 1998 1999 2000 2001 2002 2003 2004 2005 %
Landfill/disposal 44 39 27 23 21 19 16 12 11 12 11 Total incineration 36 35 39 36 33 33 33 37 38 36 36 Recycling + composting 19 26 34 41 46 48 50 51 51 52 52
Country Reports
According to a report of the European Environment Agency taxes are deemed as being a significant driver for reducing landfilling in Belgium, especially when […] associated with a landfill ban, even though the report acknowledges that other instruments also influence this change [27].
One key element to keep in mind while reading the data in Table 4 is that all three Bel- gian regions have their own waste management legislation which yield various results, and therefore the regional statistics may differ a lot from the country’s overall figures.
Implementation of EU legislation Flanders The region already met the 2016 target of biodegradable waste diversion from the Landfill Directive in 2005 [6]. A landfill ban on selected waste streams was already in place since 1998. The region achieved further reduction by banning landfilling of unsorted household waste, waste collected for recovery and combustible waste (with a Total Organic Carbon (TOC) over 6 %). The region applies a landfill tax since 2001.
The 2011 Material Decree (implemented via an executive law in 2012) transposes the WFD requirements in Flemish legislation. It implements almost all requirements from the WFD without deviating [23].
Wallonia Wallonia banned the landfilling of separately collected municipal waste and biodegra- dable waste. The region applies a landfill tax since 2008.
All legal requirements from the WFD were implemented without deviation by the 2012 transposition Decree. The only exception is the encouragement of separate collection of bio-waste (even though it exists in some areas) [26, p. 73].
Brussels Capital Region There are no landfills in the region. The WFD was implemented with minor deviations by the 2012 Ordinance on waste prevention and management. Mandatory waste sepa- ration is in place since 2010.
Key regional initiatives Waste management is a regional competency in Belgium, and there are therefore three different ways of managing waste in the country.
Brussels Capital Region This region produces approximately 9 % of the Belgian municipal waste, and relies on the two other regions to treat its waste as it does not have sufficient capacities for treatment and disposal [23].
The 2010 Waste Prevention and Management Plan sets an aim of 50 % separately collected waste by 2020. This is a key element for the region, as it has the lowest recy- cling rates in the country because of high urban density leading to a lack of space for
Country Reports
separate collection and storage, both in buildings and in collection points. The waste management plan tackles this issue by simplifying the information on waste collec- tion, developing a better cooperation between municipalities and starting the separate collection of bio-waste.
Flanders
The region has a long history of waste management plants, starting in 1986 - 1990 with a focus on closing down landfills, developing new ones with better standards. Separate collection of bio-waste and garden waste is in place in Flanders since the second waste management plan of 1991. The following plans introduced waste reduction targets, quality thresholds for separately collected waste, and landfill bans.
In its 2008 Waste Management Plan for households, the Flemish region set as a prio- rity to separately collect 75 % of the relevant household waste fractions by 2010 and to maintain this level until 2015. The authorities planned to achieve this objective by aligning the door-to-door collection systems in the entire region.
The pay-as-you-throw principle is key in the successful implementation of the waste management plan, and is also an incentive to reduce waste production and increase home composting.
Wallonia
The first Walloon waste management plan (1991) promoted waste prevention, energy recovery and separate waste collection. The 1998 waste management plan was the do- cument covering the regional strategy until 2010. The 2010 plan focused on reducing the landfilling of waste (36 % in 2000 down to 2 % in 2012) and improving the recycling rates (15 % in 1998 up to 50 % in 2012).
The plan set specific targets for separate collection of the following waste streams: glass (80 %), paper (55 %), composite materials (20 %), plastic (25 %), metal (90 %), organic waste (60 %) and green waste (60 %).
It was updated in 2016.The region now aims to improve its collection of organic kitchen waste and textile reuse.
Organisation of waste management
The organisation is left to the regions, and therefore varies between them.
Brussels
The collection is organised by the regional agency Bruxelles Propreté, which is also in charge of waste management including sorting and treatment. Paper/cardboard, garden waste are collected door-to-door in separate bags while plastics, composite materials and metals are collected in co-mingled bags. A voluntary door-to-door collection of bio-waste is in place since January 2017. These fractions are collected weekly, while residual waste is collected twice a week. Glass is collected in collection points.
Commercial waste producers can sign a contract with any waste collection company.
Country Reports
Flanders The region aims since 2008 to harmonise the separate collection. The same streams are collected than in Brussels, with a difference in the frequency of the collection. While plastics and metals are collected once a week, paper/cardboard are only collected once a month. Bio-waste is collected biweekly in 2/3rds of the municipalities.
Wallonia The civic amenity sites are the primary collection system for green waste, paper, me- tals, and plastics while separate door-to-door collection is seen as a secondary system.
The fractions are the same as for the other regions, but only 25 % of the municipalities collected bio-waste in 2014.
Waste management financing Belgian municipalities finance their waste management by a household waste tax or environmental tax (fixed amounts, paid yearly), payments for waste bags, containers, or frequency of waste collection [18].
The pay-as-you-throw scheme based on the price of waste bags has shown to be effici- ent, in particular in the Flemish Brabant province where it is the highest. A 1999 study indeed showed that 0.50 EUR increase per residual waste bag would lead to a decrease of 30 kg residual waste production per household [4].
Wallonia introduced another type of fee in 1999, aimed at municipalities: municipa- lities would be charged with a fee if they exceed a threshold of collected waste. This aimed to reduce the waste production and to avoid an increase that was predicted by the authorities.
6. Netherlands
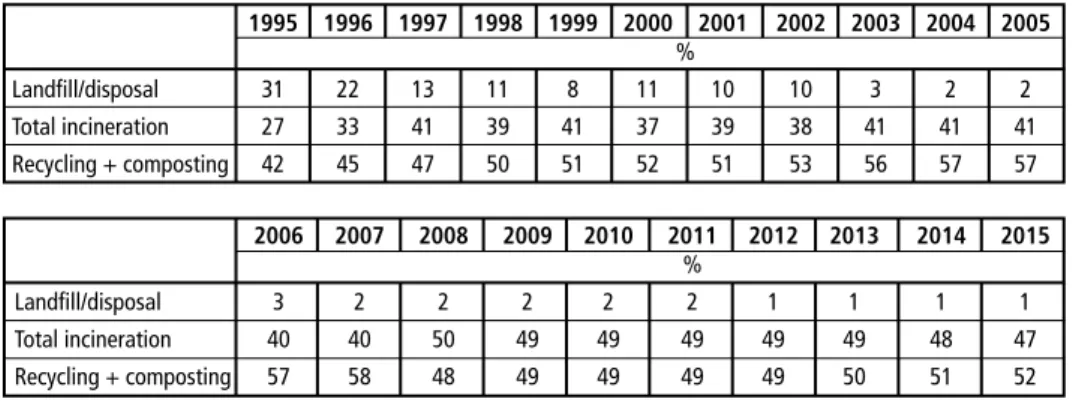
For at least 20 years, the Netherlands have been in the leading countries in the EU for recycling with over 45 % municipal waste recycling. Table 5 shows that the country was a frontrunner in landfill diversion, achieving the European Commission’s proposed 2030 targets already by 2001.
Table 5: Municipal waste treatment in the Netherlands, 1995 to 2015
1995 1996 1997 1998 1999 2000 2001 2002 2003 2004 2005 %
Landfill/disposal 31 22 13 11 8 11 10 10 3 2 2 Total incineration 27 33 41 39 41 37 39 38 41 41 41 Recycling + composting 42 45 47 50 51 52 51 53 56 57 57
2006 2007 2008 2009 2010 2011 2012 2013 2014 2015
%
Landfill/disposal 3 2 2 2 2 2 1 1 1 1 Total incineration 40 40 50 49 49 49 49 49 48 47 Recycling + composting 57 58 48 49 49 49 49 50 51 52 Source: Eurostat
Country Reports
Implementation of EU legislation
The 1979 law on Management of the Environment already set high requirements which correspond to the 2008 Waste Framework Directive. In particular, it included an early proposition of the waste hierarchy (under the name Lansnik’s ladder) which would become law in 1994. This early start contributed heavily to the country’s success in recy- cling. It has even been pointed out in a report by the European Environmental Agency that the concept of waste hierarchy is in fact based on Dutch environmental policy [22].
In 1995, a decree relative to waste and banning landfilling for 35 categories of waste was adopted. It included the ban of biodegradable and combustible waste – with local exemptions if the provincial authorities obtain a certification from the national envi- ronmental agency stating that landfill is the only option in that area. This was a basis for the implementation of the 1999 Landfill Directive, transposed into various decrees in 2001. Accompanied by a landfill tax, the 1995 landfill ban allowed the country to accomplish swift results in its landfill diversion policy: in 2006, Netherlands was among the few Member States that already achieved the biodegradable municipal waste landfill diversion target for 2016 (35 % of 1995 levels) [7].
The WFD implementation law was adopted in 2011. Most of its requirements were already in place in the Netherlands since 1979 with a few deviations. In particular, a distinction was made between households and companies on the economically, techni- cally and environmentally practicable conditions for separate collection.
Key national initiatives
The Netherlands were one of the first European countries to take important steps focu- sing on sustainable waste management. As mentioned above, the concept of waste hie- rarchy was a Dutch policy which inspired EU legislators when drafting the 2006 WFD.
The Netherlands were also one of the first EU countries to adopt a landfill ban, thereby strengthening their landfill diversion policy.
Since 1995, the country also decided to collect waste paper and cardboard from households separately, aiming for 85 % collection rate by 2000 [18].
The 2009-2021 National Waste Management Plan set a target for recovery of municipal waste from households at 99 % by 2015, with a minimum of 60 % to do via recycling.
The strategy also includes a target of 75 % waste separation for 2020 for all household waste [24].
Waste management organisation
A decision was taken in 1997 to centralize waste management. This responsibility of the central government entered into force in 2002.
The three levels of authorities in the Netherlands have clear roles concerning waste ma- nagement: the Ministry regulates, communicates and provides research; the provinces monitor and grant licences to waste treatment plants based on the national plan; the municipalities set up the separate collection systems and communicate to the public.
Country Reports
Each municipality decides of the collection system independently, by ordinance. The only requirements are the frequency of collection at households, the existence of bring points for bulky wastes and other general rules.
In large cities collection points are the norm while door-to-door collection is in practi- ce in towns and smaller cities. Almost all municipalities collect bio-waste separately.
The general rule for source separation of household waste is one bag/bin per stream:
Paper and cardboard, metal, plastic, glass and bio-waste are all collected primarily door- to-door and sometimes in bring points. Beer bottles and plastic bottles are collected through a deposit system.
Waste management financing Dutch municipalities have full capability in determining how to finance their waste collection system. Many apply a pay-as-you-throw scheme, either based on weight or bags of waste produced. Some also pay a collection charge based on the size of their household. As shown in a report from the Organisation for Economic Co-operation and Development (OECD), these systems were already in place by 2000 [36].
7. Conclusions
Through the assessment of the five best performing recycling countries in the EU (Austria, Belgium, Germany, Netherlands, Slovenia), some common drivers can be highlighted.
It is clear that these countries achieved higher recycling rates after implementing a landfill diversion measure. In Austria, where high recycling rates were achieved already since a long time the landfill ban led to a further increase of recycling in the following years. The most stringent measures were landfill bans of waste above a certain Total Organic Carbon (TOC) threshold (Germany, Austria, Flanders). TOC thresholds are a useful tool to implement the Landfill Directive’s requirement to treat the waste before it is allowed to be landfilled. Also landfill bans for certain waste streams, combined with landfill taxes, proved to be efficient, e.g. in the Netherlands. Today, many EU Member States use tools such as landfill bans and taxes [4].
The recycling countries demonstrate a full implementation of the provisions of EU waste legislation and have done so since the adoption of both the Landfill Directive and the WFD, or even before. Only Slovenia has some compliance issues regarding the operation of its landfills, but achieves good results on municipal waste recycling. This shows that in order to achieve better waste management, it is of primary importance to support proper and full implementation of EU waste legislation. In particular, the Landfill Directive proved to be both difficult to implement and the most efficient to yield positive results once properly implemented. Additionally to contributing to higher recycling rates, landfill diversion has a strong positive impact on the environment [16].
The implementation of the Landfill Directive’s provision to landfill only waste that has been subject to treatment requires treatment capacity. Member States that are still lag- ging behind in waste law implementation need careful capacity planning. First, Member
Country Reports
States should invest in source separation for the waste streams which are the most viable for recycling. The five recycling countries have introduced source separation for glass, paper/cardboard, plastic and metals and – for most of them – biowaste/green waste.
However, high source separation rates as such do not yet mean high recycling rates.
In order to avoid contaminated materials that will not make it to recycling, education of citizens and commerce is needed with regard to source separation.
For the residual waste Waste-to-Energy plants were built in the recycling countries, generating heat and electricity from the non-recyclable residual waste. Except Slovenia, which has chosen Mechanical Biological Treatment (MBT) to reduce the amount of waste sent to landfilling. However, parts of the MBT residues are still landfilled and the high calorific portion of the MBT residues needs to be exported to countries with Waste-to-Energy capacity. The draw-back is that this waste cannot be used for local energy production helping the country’s security of energy supply and reducing the import need of fossil fuels for energy production.
In many Member States MBT residues are produced, but do not meet demand (e.g.
Italy): once such MBT capacity is installed, there will be less incentive to improve separate waste collection, which would in turn hamper material and energy recovery, thus running counter to the waste hierarchy of Article 4(1) of the Waste Framework Directive. At the same time, the investment required to install MBT capacity, or simply to stabilise the or- ganic fraction, may not be cost-effective if there is little demand for the resulting recovered or stabilised materials, which would thus be landfilled anyway [26, p. 73]
MBT can be useful in rural areas in order to reduce the amount of waste that is landfilled, but its need should be carefully reflected considering that it is a pre-treatment and the residues still need to be landfilled or incinerated. Also Waste-to-Energy plants produce residues, mainly bottom ash, but from them metals (e.g. aluminium, copper, steel) are recycled and the remaining mineral part can be used for construction purposes, repla- cing gravel and sand. It is self-evident that Waste-to-Energy capacities also need careful planning, and efforts for waste prevention and recycling have to be taken into account.
It is political will and firm legislative actions that are needed to move forward, as they bring reliability and therefore allow long term investments in the necessary waste infrastructure.
Last, but not least good waste management needs financing. The five recycling countries investigated in this article apply basic fees for the waste management services, mostly combined with pay-as-you-throw systems.
The drivers for good waste management in a nutshell are: diversion from landfills, source separation and education, thorough capacity planning, reliable legislation and solid financing.
8. References
[1] Case C-323/13
[2] Cases C-423/02 and C-172/04 respectively [3] Cases C-494/01 and C-502/03 respectively
Country Reports [4] CEWEP: Overview of landfill taxes and bans. http://www.cewep.eu/information/data/landfill/
index.html
[5] City of Vienna: Waste Management in Vienna. https://www.wien.gv.at/umwelt/ma48/service/
publikationen/pdf/abfallwirtschaft-en.pdf [6] COM(2005) 105 final
[7] COM(2006) 406 final [8] COM(2009) 633 final
[9] COM(2013) 6 final and COM(2017) 88 final
[10] COM(2015) 593 final, COM(2015) 594 final, COM(2015) 595 final, COM(2015) 596 final [11] Directive 75/442/EEC on waste
[12] Directive 94/62/EC
[13] Directive 1999/31/EC on the landfill of waste
[14] Directive 2002/96/EC and Directive 2006/66/EC respectively [15] Directive 2006/12/EC, amended by Directive 2008/98/EC
[16] EEA: Big potential of cutting greenhouse gases from waste. August 2011
[17] EEA: Diverting waste from landfill: effectiveness of waste management policies in the European Union. EEA Report No 7/2009; http://www.eea.europa.eu/publications/diverting-waste-from- landfill-effectiveness-of-waste-management-policies-in-the-european-union
[18] Eunomia: Financing and Incentive Schemes for Municipal Waste Management: Report for the European Commission, 2002
[19] European Commission: Assessment of separate collection schemes in the 28 capitals of the EU.
National factsheet – Germany, 2014
[20] European Commission: Capital factsheet – Slovenia, Assessment of separate collection schemes in the 28 capitals of the EU. 2014
[21] European Commission: Commission Staff Working Document Part II: Member States Accom- panying the document Monitoring the application of European Union law 2016 Annual Report (COM(2017(370)). July 2017
[22] European Commission: Final Implementation Report for the Directive 2008/98/EC on Waste.
24 July 2015
[23] European Commission: National factsheet – Belgium, Assessment of separate collection schemes in the 28 capitals of the EU. 2014
[24] European Commission: National factsheet – Netherlands, Assessment of separate collection schemes in the 28 capitals of the EU. 2014
[25] European Commission: National factsheet – Slovenia, Assessment of separate collection schemes in the 28 capitals of the EU. 2014
[26] European Commission: Study to assess the implementation by the EU Member States of certain provisions of Directive 1999/31/EC on the landfill of waste. March 2017
[27] European Environment Agency (EEA): Municipal waste management in Belgium, February 2013
[28] European Environment Agency (EEA): Municipal waste management in Germany. February 2013
[29] Eurostat 2017 data, database env_wasgen. Reference year: 2014 [30] Eurostat 2017 data, database env_wasmun
Country Reports
[31] Federal Waste Management Plan 2011/BAWP – Bundesabfallwirtschaftsplan 2011, Ministry of Agriculture, Forestry, Environment and Water Management, http://www.bundesabfallwirt- schaftsplan.at
[32] Federal Waste Management Plan 2017/BAWP – Bundesabfallwirtschaftsplan 2011, Ministry of Agriculture, Forestry, Environment and Water Management, http://www.bundesabfallwirt- schaftsplan.at
[33] Gesetz zur Förderung der Kreislaufwirtschaft und Sicherung der umweltverträglichen Bewirt- schaftung von Abfällen – Kreislaufwirtschaftsgesetz vom 24. Februar 2012 (BGBl. I S. 212) [34] http://ec.europa.eu/environment/archives/waste/reporting/pdf/Waste_Framework_Directive.
pdf, http://ec.europa.eu/environment/archives/waste/reporting/pdf/Annex%207-1%20WFD.pdf [35] Liebmann, M.: Financing the public waste disposal systems in Germany. August 2015 [36] OECD: Instrument Mixes for Environmental Policy. 2007
[37] Verordnung über Anlagen zur biologischen Behandlung von Abfällen vom 20. Februar 2001 (BGBl. I S. 305, 317), die durch Artikel 3 der Verordnung vom 27. April 2009 (BGBl. I S. 900) geändert worden ist
[38] Verordnung über Deponien und Langzeitlager (Deponieverordnung – DepV 2002) vom 24. Juli 2002 (BGBl. I S. 2807), zuletzt geändert durch Verordnung vom 13. Dezember 2006 (BGBl. I S. 2860)
[39] Verpackungsverordnung (VerpackV). Ordinance on the avoidance of packaging waste from 10 June 1991 (BGBl. I, 1234)
Bibliografische Information der Deutschen Nationalbibliothek Die Deutsche Nationalbibliothek verzeichnet diese Publikation in der Deutschen Nationalbibliografie; detaillierte bibliografische Daten sind im Internet über http://dnb.dnb.de abrufbar
Thomé-Kozmiensky, K. J.; Thiel, S.; Thomé-Kozmiensky, E.;
Winter, F.; Juchelková, D. (Eds.): Waste Management, Volume 7 – Waste-to-Energy – ISBN 978-3-944310-37-4 TK Verlag Karl Thomé-Kozmiensky
Copyright: Elisabeth Thomé-Kozmiensky, M.Sc., Dr.-Ing. Stephanie Thiel All rights reserved
Publisher: TK Verlag Karl Thomé-Kozmiensky • Neuruppin 2017
Editorial office: Dr.-Ing. Stephanie Thiel, Elisabeth Thomé-Kozmiensky, M. Sc.
Janin Burbott-Seidel and Claudia Naumann-Deppe
Layout: Sandra Peters, Anne Kuhlo, Ginette Teske, Claudia Naumann-Deppe, Janin Burbott-Seidel, Gabi Spiegel and Cordula Müller
Printing: Universal Medien GmbH, Munich
This work is protected by copyright. The rights founded by this, particularly those of translation, reprinting, lecturing, extraction of illustrations and tables, broadcasting, micro- filming or reproduction by other means and storing in a retrieval system, remain reserved, even for exploitation only of excerpts. Reproduction of this work or of part of this work, also in individual cases, is only permissible within the limits of the legal provisions of the copyright law of the Federal Republic of Germany from 9 September 1965 in the currently valid revision. There is a fundamental duty to pay for this. Infringements are subject to the penal provisions of the copyright law.
The repeating of commonly used names, trade names, goods descriptions etc. in this work does not permit, even without specific mention, the assumption that such names are to be considered free under the terms of the law concerning goods descriptions and trade mark protection and can thus be used by anyone.
Should reference be made in this work, directly or indirectly, to laws, regulations or guide- lines, e.g. DIN, VDI, VDE, VGB, or these are quoted from, then the publisher cannot ac- cept any guarantee for correctness, completeness or currency. It is recommended to refer to the complete regulations or guidelines in their currently valid versions if required for ones own work.