Proceedings of the International Ocean Discovery Program Volume 376 publications.iodp.org
https://doi.org/10.14379/iodp.proc.376.102.2019
Expedition 376 methods
1C.E.J. de Ronde, S.E. Humphris, T.W. Höfig, P.A. Brandl, L. Cai, Y. Cai, F. Caratori Tontini, J.R. Deans, A. Farough, J.W. Jamieson, K.P. Kolandaivelu, A. Kutovaya, J.M. Labonté, A.J. Martin, C. Massiot, J.M. McDermott, I.M. McIntosh, T. Nozaki, V.H. Pellizari, A.G. Reyes, S. Roberts, O. Rouxel, L.E.M. Schlicht, J.H. Seo, S.M. Straub, K. Strehlow, K. Takai, D. Tanner, F.J. Tepley III, and C. Zhang2
Keywords: International Ocean Discovery Program, IODP, JOIDES Resolution, Expedition 376, Brothers Arc Flux, Brothers volcano, Site U1527, Site U1528, Site U1529, Site U1530, Site U1531, Kermadec arc, submarine arc volcano, hydrothermal systems, volcaniclastics, dacite lava, hydrothermal alteration, borehole fluids, hypersaline brine, fluid inclusions, acidic fluids, alteration mineral assemblages, Upper Cone, Lower Cone, NW Caldera
1de Ronde, C.E.J., Humphris, S.E., Höfig, T.W., Brandl, P.A., Cai, L., Cai, Y., Caratori Tontini, F., Deans, J.R., Farough, A., Jamieson, J.W., Kolandaivelu, K.P., Kutovaya, A., Labonté, J.M., Martin, A.J., Massiot, C., McDermott, J.M., McIntosh, I.M., Nozaki, T., Pellizari, V.H., Reyes, A.G., Roberts, S., Rouxel, O., Schlicht, L.E.M., Seo, J.H., Straub, S.M., Strehlow, K., Takai, K., Tanner, D., Tepley, F.J., III, and Zhang, C., 2019. Expedition 376 methods. In de Ronde, C.E.J., Humphris, S.E., Höfig, T.W., and the Expedition 376 Scientists, Brothers Arc Flux. Proceedings of the International Ocean Discovery Program, 376: College Station, TX (International Ocean Discovery Program). https://doi.org/10.14379/iodp.proc.376.102.2019
Contents
1 Introduction
11 Igneous petrology and volcanology 21 Alteration
26 Structural geology 30 Geochemistry 41 Paleomagnetism 42 Physical properties
47 Downhole logging operations 54 Microbiology
56 References
Introduction
This chapter documents the procedures and methods employed in the various shipboard laboratories on the R/V JOIDES Resolution during International Ocean Discovery Program (IODP) Expedition 376. This information applies only to shipboard work described in the Expedition reports section of the Expedition 376 Proceedings of the International Ocean Discovery Program volume, which used the shipboard sample registry, imaging and analytical instruments, core description tools, and Laboratory Information Management System (LIMS) database. Methods for shore-based analysis of Expedition 376 samples and data will be described in the individual peer-re- viewed scientific contributions to be published in the Expedition re- search results section of this volume and in international scientific journals and books.
All shipboard scientists contributed in various ways to this vol- ume with the following primary responsibilities (authors are listed in alphabetical order; see Expedition 376 scientists for contact in- formation):
•Summary chapter: Expedition 376 Scientists
•Methods and site chapters:
•Background and objectives: de Ronde and Humphris
•Introduction/Operations: de Ronde, Höfig, Humphris, and Operations Superintendent Midgley
•Igneous petrology and volcanology: Brandl, Seo, Straub, Strehlow, Tanner, and Tepley
•Alteration: Y. Cai, Jamieson, Martin, Nozaki, Reyes, Roberts, Schlicht, and Zhang
•Geochemistry: Kutovaya, McDermott, Rouxel, and Straub
•Structural geology: Deans
•Petrophysics (core and downhole): Farough, Kolandaivelu, Massiot, McIntosh, and Reyes
•Paleomagnetism: Caratori Tontini
•Microbiology: L. Cai, Labonté, Pellizari, and Takai
This introductory section covers methods and procedures that apply to most or all of the shipboard laboratory groups. Subsequent sections describe detailed methods used by each laboratory group.
Sites and holes
GPS coordinates from precruise site surveys were used for the general position of the vessel at Expedition 376 sites. Markers were deployed previously by remotely operated vehicles on the seafloor at the three primary sites and three of the four alternate sites at Brothers volcano. A SyQwest Bathy 2010 CHIRP subbottom pro- filer was used to monitor the seafloor depth during the approach to the site to reconfirm the depth profiles from precruise surveys.
Once the vessel was positioned at the site, a camera survey was con- ducted to locate the marker, to ensure no proximal animal commu- nities were present, and to confirm suitable locations for spudding several holes, should they be needed (Table T1). A positioning bea- con was deployed on the seafloor only at Site U1527. While on site, ship location over the hole was maintained using the Neutronics 5002 dynamic positioning (DP) system on the JOIDES Resolution.
DP control of the vessel used navigational input from the GPS (and triangulation to the seafloor beacon at Site U1527). The final hole position was the mean position calculated from the GPS data col- lected over a significant portion of the time the hole was occupied.
Table T1. General shipboard workflow, Expedition 376. FLIR = forward-looking infrared, GRA = gamma ray attenuation, MSL = loop magnetic susceptibility, WRMSL = Whole-Round Multisensor Logger, NGR = natural gamma radiation, NGRL = NGR Logger, SHIL = Section Half Imaging Logger, RSC = reflectance spec- troscopy and colorimetry, MSP = point magnetic susceptibility, SHMSL = Section Half Multisensor Logger, SHMG = Section Half Measurement Gantry, TC = thermal conductivity, ICP-AES = inductively coupled–atomic emission spectrometry, XRD = X-ray diffraction, CHNS = carbon-hydrogen-nitrogen-sulfur, MAD = moisture and density, DRF = drilling depth below rig floor, DSF = drilling depth below seafloor. Download table in CSV format.
Task Agent
Sites and holes
1 Locate and position on site. Ship crew
2 Conduct camera survey. Ship crew
3 Establish hole. Ship crew
Drilling and coring
4 Use nonmagnetic core barrels. Rig floor personnel
5 Use core liners; be prepared to core without liners if considered necessary. Rig floor personnel
6 Core ~9.7 m cores; ~4.5 m half cores if deemed necessary. Rig floor personnel
7 Log cores in sample registry with top and bottom depth of cored interval (m DRF; m DSF). Rig floor personnel Whole-round section preparation
8 Transfer temporary sections to core splitting room. Curatorial staff
9 Measure core temperature with FLIR gun. Physical property specialists
10 Mark pieces with red “X” at the bottom. Curatorial staff
11 Measure length of sections and enter as “recovered length.” Curatorial staff
12 Sum section recovered lengths and enter as total core recovered; compute percent recovery. Curatorial staff
13 Select microbiology sample if appropriate. Designated scientist
14 Wash and space-out pieces in split liners; mark “upward” orientation. Curatorial staff 15 Reconstruct fractured pieces if possible; shrink-wrap fragile pieces. Curatorial staff
16 Add spacers between pieces (no glue yet). Curatorial staff
17 Check binning and draw splitting line on each piece; mark working half. Designated scientist 18 Permanently glue spacers in split liner; angle braces point upcore so top of piece is at top of bin. Curatorial staff
19 Enter spacer offsets in registry for piece log. Curatorial staff
20 Enter final curated section lengths in registry. Curatorial staff
21 Optionally enter piece lengths in registry for piece log. Designated scientist
Whole-round measurements
22 Image whole-round surface (0°, 90°, 180°, and 270° quarter images). Designated technicians, scientists
23 Prepare whole-round composite images. Imaging specialist
24 Measure core temperature with FLIR. Measure GRA and MSL on the WRMSL. Physical property specialists
25 Measure NGR on the NGRL. Physical property specialists
Section half preparation
26 Split sections (i.e., split pieces along the lines indicated by designated scientists). Curatorial staff
27 Label piece halves. Curatorial staff
Archive section half measurements
28 Image dry surface of archive halves with SHIL after imaging working half. Core describers
29 Measure RSC and MSP on archive halves on the SHMSL. Core describers
30 Macroscopic description of archive half (and working half if needed). Core describers
31 Measure paleomagnetic properties on archive halves. Paleomagnetists
Working section half subsampling and measurements
32 Measure P-wave velocity on SHMG if possible. If piece is bigger than 10 cm, measure TC. Physical property specialists 33 Select and flag samples to be taken from working half for shipboard analysis. Designated scientist
34 Cut shipboard and shore-based samples from working halves. Curatorial staff
35 Microscopic description of thin sections. Core describers
36 ICP-AES, XRD, and CHNS analyses. Geochemists
37 Measure paleomagnetic and rock magnetic properties on cube samples. Paleomagnetists
38 Measure MAD on same cube samples. Physical property specialists
Samples for shore-based research
39 Select and flag personal/group samples to be taken from working half for shore-based analysis. Scientists
40 Inspect and approve personal samples. Sample Allocation Committee
41 Cut shipboard and shore-based samples from working halves. Curatorial staff
Final sample storage and shipment
42 Place archive halves in D-tubes when description and paleomagnetic measurements are complete. Store in refrigerator until shipment to designated IODP core repository (i.e., Kochi Core Center).
Curatorial staff 43 Bag and pack personal/group samples in boxes for shipment to designated investigator addresses. Curatorial staff
The site was numbered according to the series that began with the first site drilled by the Deep Sea Drilling Project D/V Glomar Challenger in 1968. Starting with Integrated Ocean Drilling Pro- gram Expedition 301, the prefix “U” designates sites occupied by the JOIDES Resolution. For all IODP drill sites, a letter suffix distin- guishes each hole drilled at the same site. The first hole drilled is
assigned the site number modified by the suffix “A,” the second hole takes the site number and the suffix “B,” and so forth. During Expe- dition 376, five sites were drilled: Site U1527 (Holes U1527A–
U1527C), Site U1528 (Holes U1528A–U1528D), Site U1529 (Holes U1529A and U1529B), Site U1530 (Hole U1530A), and Site U1531 (Holes U1531A–U1531E).
Drilling and coring operations
The drilling strategy for Expedition 376 was to drill, core, and log three primary sites: one situated on the northwest rim of the cal- dera at Brothers volcano, another on the floor of the caldera near the western caldera wall, and a third at the summit of the Upper Cone. Operations at each site began with attempts to drill a pilot hole to ascertain conditions for casing. Except at Site U1530, these attempts were followed by the deployment of casing of different lengths (depending on the site conditions) and an attached reentry funnel drilled-in using a mud motor and underreamer. We used the rotary core barrel (RCB) system for all of the drilling and coring ex- cept for two brief tests of a prototype turbine-driven coring system (TDCS) brought on board by Center for Deep Earth Exploration (CDEX) engineers. The RCB system is the most conventional rotary coring system and is suitable for lithified rock. It cuts a core as long as 9.5 m with a nominal diameter of 5.87 cm. RCB coring can be conducted with or without core liners. Liners are sometimes omit- ted with the RCB system in an attempt to prevent core pieces from getting caught at the edge of the liner, which could lead to a jam and lack of recovery. During Expedition 376, plastic liners were used for all of the cores. Nonmagnetic core barrels were used throughout.
The bottom-hole assembly (BHA) is the lowermost part of the drill string and is configured to provide appropriate strength and tension in the drill string. A typical RCB BHA consists of a 9⅞ inch (~25.1 cm) drill bit, a bit sub, an outer core barrel, a top sub, a head sub, ten stands of 8¼ inch (~21.0 cm) drill collars, a tapered drill collar, two stands of standard 5.5 inch (~14.0 cm) drill pipe, and a crossover sub to the regular 5 inch (~12.7 cm) drill pipe.
During most IODP expeditions, cored intervals are 9.6–9.8 m long, which is the length of a core barrel. The length of the recov- ered core varies based on a number of factors. In igneous rock, the length of the recovered core is typically less than the cored interval.
A common cause of poor recovery is core jamming in the bit or in the throat of the core barrel, which prevents additional core from entering the core barrel. This problem can be partly mitigated by extracting cores at shorter coring intervals; half cores were collected during Expedition 376 in all holes after two or three full-length cores were extracted following initial spud-in of the holes.
Cored intervals may not be contiguous if separated by intervals drilled but not cored. Drilling ahead without coring may be neces- sary or desired because certain intervals are hard or impossible to recover or need to be reamed to the diameter required for coring or because the cored interval is set to target a specific stratigraphic in- terval. For example, during Expedition 376, we drilled ahead with- out coring using a tricone bit for a 22 m interval from the seafloor in Hole U1528C (see Operations in the Site U1528 chapter [de Ronde et al., 2019a]). Holes thus consist of a sequence of cored and drilled intervals, or advancements. These advancements are numbered se- quentially from the top of the hole downward. Numbers assigned to physical cores recovered correspond to advancements and may not be consecutive.
Recovery rates for each core were calculated based on the total length of a core recovered divided by the length of the cored interval (see Core curatorial procedures and sampling). In igneous rocks, recovery rates are typically <100%.
Core curatorial procedures and sampling
Whole-round section preparation
To minimize contamination of the core with platinum group el- ements and gold, all personnel handling and describing the cores or other sample material removed jewelry and wore nitrile gloves.
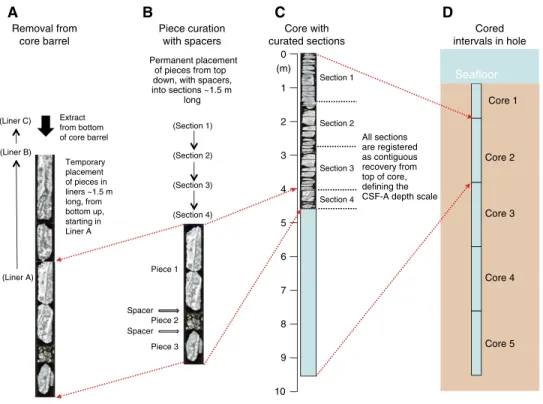
Cores recovered in core liners were extracted from the core bar- rel by rig personnel and carried to the catwalk by JOIDES Resolution Science Operator (JRSO) technicians. Technicians cut the liner and the core, if necessary, into ~1.5 m long sections. The sections were temporarily secured with blue and colorless liner end caps to denote top and bottom, respectively, a convention that was used through- out the curation process. The sections were transferred to the core splitting room, where the core liners were emptied and the pieces were transferred into split core liners for processing.
In cases where core recovery was minimal (i.e., a few small frag- ments), JRSO technicians waited with a 1.5 m long presplit core liner at the end of the catwalk. Once the core barrel was lowered horizontally, each rock piece was removed from the core barrel one by one and placed in consecutive order in the split plastic liner (Fig- ure F1). If a core catcher sample was present, it was taken to the splitting area separately and added to the bottom section of the re- covered core. Once all core material was removed from the core barrel, the split liner sections were transferred to the core splitting area, where the pieces were transferred into split core liners, this time from top to bottom for processing.
The total length of all rock material in each section was mea- sured and entered into the SampleMaster application as recovered length. The sum of all recovered lengths in a core was used to com- pute core recovery as a percentage of the cored interval.
Microbiology samples were taken from selected pieces accord- ing to the expedition sampling plan under supervision of the as- signed Sample Allocation Committee (SAC) representative. Only the necessary 4–5 people wearing face masks and nitrile gloves were in the room for microbiology sampling to minimize contamination, and the samples were immediately transferred to the microbiology preparation laboratory (see Microbiology for information on mi- crobiology sample handling and preparation).
Plastic dividers made from core liner caps were then inserted be- tween core pieces to keep them in place for curation. The spacers may represent substantial intervals of no recovery, to the point of cre- ating a curated core that is longer than the cored interval (see Depth computations). Adjacent core pieces that could be fitted together along fractures, or where other continuous features were observed (e.g., volcanic clast or fabric), were curated as single pieces. JRSO per- sonnel marked the bottom of all oriented pieces (i.e., pieces with a greater length than diameter; approximately >5 cm). Core pieces that appeared susceptible to crumbling were encased in shrink-wrap.
At least one designated scientist (usually the structural geolo- gist) then checked and approved the binning and reconstruction of fractured pieces. The scientist marked a splitting line on each piece with a wax pencil so that the piece could be split into representative working and archive halves, ideally maximizing the expression of dipping structures on the cut face of the core while maintaining rep- resentative features in both archive and working halves. To ensure a consistent protocol for whole-core imaging, the splitting line was drawn so that the working half was on the right side of the line look- ing in the upcore direction. The working half of each piece was marked with a “W” to the right of the splitting line (Figure F2).
Where magmatic/volcanic fabrics or crystal-plastic fabrics (CPFs) were present, cores were marked for splitting with the fabric dip- ping east (090°) or west (270°) in the IODP core reference frame (CRF) (see Core reference frame for sample orientation) (Figure F2). This protocol was sometimes overridden by the presence of specific features (e.g., mineralized areas, filled vugs, or veins) that were divided between the archive and working halves to ensure preservation and/or allow shipboard or postcruise sampling.
Once the split line was drawn, JRSO technical personnel se- cured the plastic spacers permanently with acetone between indi- vidual pieces into matching working and archive half split-core liners. Spacers were mounted into the liners with the angle brace facing uphole. This spacing ensured that the top of each piece had the same depth as the top of the curated interval for each bin. The top and bottom offsets of each bin were entered into SampleMaster.
Based on the calculated bin lengths, the cumulative length of all bins, including spacers, was computed as the curated length of the section (Figure F1). The empty split liner with spacers glued in was then placed over the split liner containing the pieces, and the two
halves were taped together in a few places for temporary storage un- til core pieces were dry and equilibrated to laboratory conditions (usually ~2 h after arrival from the catwalk).
Whole-round section measurements
Once the core sections were deemed thermally equilibrated, the following whole-round measurements were taken:
•Whole-round surface imaging (i.e., four surface quarter image scans orthogonal to angles of 000°, 090°, 180°, and 270° relative to the CRF) using the Section Half Imaging Logger (SHIL) con- figured for whole-round sections;
Figure F1. Core handling during Expedition 376. A. When coring with a core liner, liners and cores were cut on the catwalk into temporary sections ~1.5 m long (not shown). B. After transfer of temporary sections to the core-splitting room, pieces were arranged with dividers, resulting in curated sections. C. Sections were registered and assigned depths contiguously from the top of the core. The position of each piece has an uncertainty proportional to the gaps between pieces plus the remaining nonrecovered interval at the bottom of the core barrel. D. Cored intervals.
Section 1
Section 2
Section 3
C
Core with curated sections
Seafloor Core 1
Core 3
Core 4
Core 5
D
Cored intervals in hole
Section 4
(Liner A) (Liner B) (Liner C)
0
1
4
5
6
7
8
9
10 2
3 Extract
from bottom of core barrel
Temporary placement of pieces in liners ~1.5 m long, from bottom up, starting in Liner A
Core 2 Permanent placement
of pieces from top down, with spacers, into sections ~1.5 m
long
Spacer Piece 1
Piece 2
Piece 3 Spacer
B
Piece curation with spacers
All sections are registered as contiguous recovery from top of core, defining the CSF-A depth scale
A
Removal from core barrel
(Section 1)
(Section 2)
(Section 3)
(Section 4)
(m)
Figure F2. Core reference frame for structural and paleomagnetic orientation measurements used during Expedition 376. A. Primary orientation of each core piece is up and down along the core axis. B. Coordinates in both archive and working (W) halves. C. Conventions for labeling samples and thin sections taken from working half.
0°
180°
90°
90°
Archive Working
270°
W
Working Upcore Upcore
+x +z
+y 270° 90°
180°
z +y
+x
+z
Downcore facing Upcore facing
270°
facing 90°
facing Thin sections
Paleomagnetic sample
W
270°
0°
180°
90°
A B C x x
z z
y z
y x
y x
•Logging using the Whole-Round Multisensor Logger (WRMSL) with the magnetic susceptibility loop (MSL) sensor, the gamma ray attenuation (GRA) detector, and the P-wave velocity logger (PWL); and
• Natural gamma radiation (NGR) logging using the Natural Gamma Radiation Logger (NGRL) when the length of an indi- vidual section was >40 cm.
P-wave velocity measurements using the P-wave caliper (PWC) were also made on discrete whole-round pieces of fractured hard rock cores (that could not be measured using the PWL), which were then returned to the whole-round core prior to splitting. See Physi- cal properties for further discussion of these measurements.
Section-half preparation
After the completion of whole-round measurements, each piece of core was split into archive and working halves with the positions of plastic spacers between pieces maintained in both halves. Piece halves were labeled sequentially from the top of each section, begin- ning with number 1 (Figure F1). Pieces were labeled only on the outer cylindrical surfaces of the core with a plastic label sealed with epoxy.
Archive-half measurements
The following archive-half measurements were taken:
•Imaging of the dry faces of archive halves using the SHIL;
•Automated compilation of a core composite image in which all sections of a core are displayed next to each other in a one-page layout;
•Logging using the Section Half Multisensor Logger (SHMSL) with reflectance spectroscopy and colorimetry (RSC) and the point magnetic susceptibility (MSP) contact probe (see Physical properties);
•Macroscopic core description using the DESClogik data capture program (see Igneous petrology and volcanology, Alteration, and Structural geology);
•Remanent magnetization logging using the superconducting rock magnetometer (SRM) (see Paleomagnetism);
•Close-up images of particular features for illustrations in the summary of each site, as requested by individual scientists; and
•Handheld portable X-ray fluorescence (pXRF) measurements on some core pieces and on crushed rock powders (see Igneous petrology and volcanology and Geochemistry).
Working-half sampling and measurements
The following working-half samples and measurements were taken:
•Dry faces of working halves were imaged using the SHIL and also logged using the SHMSL for RSC and MSP.
•Thin section billets (TSBs) were cut to prepare thin sections for microscopic observations (see Igneous petrology and volca- nology, Alteration, and Structural geology).
•Cube samples (~8 cm3) were taken and shared for paleo- magnetism measurements, moisture and density (MAD) tests, and P-wave velocity measurements using the PWC mounted on the Section Half Measurement Gantry (SHMG) (see Paleomag- netism and Physical properties).
•Slabs or chips were taken and powdered for inductively coupled plasma–atomic emission spectroscopy (ICP-AES), total carbon- nitrogen-sulfur (CNS) elemental analyzer (EA) tests, carbonate- associated carbon contents, loss on ignition (LOI), and pXRF
measurements (see Geochemistry and Igneous petrology and volcanology).
•Fragments were scraped off or chips were taken and powdered for X-ray diffraction (XRD) analyses (see Igneous petrology and volcanology and Alteration).
Samples for shore-based research
Samples for postcruise analyses were taken from the working halves for individual investigators based on requests approved by the SAC. Four sampling parties were held for (1) Sites U1527 and U1529, (2) Site U1528, (3) Site U1530, and (4) Site U1531. For each sampling party, all cores from the designated sites were laid out across the entire core deck and sampled. Scientists viewed the cores, flagged sampling locations, and submitted detailed lists of requested samples. The SAC reviewed the flagged samples and resolved any conflicts as needed. Shipboard staff cut, registered, and packed the samples. A total of 2377 samples was taken for shore-based analyses in addition to the 1563 samples taken for shipboard analysis.
Rock samples were sealed in plastic vials or bags and labeled, and fluid and microbial samples were preserved in suitable sam- pling vessels (see Geochemistry and Microbiology). Each sample cut from the working half was logged into the LIMS database using SampleMaster, including the sample type and either the shipboard analysis (test) conducted on the sample or the name of the investi- gator receiving the sample for postcruise analysis. Records of all samples taken from the cores are accessible online in the LIMS da- tabase at Sample report under Curation and samples (http://web.iodp.tamu.edu/LORE).
Final sample storage
Following shipboard initial scientific observations, measure- ments, and sampling, both core halves were shrink-wrapped in plas- tic to prevent rock pieces from moving out of sequence during transit. Working and archive halves were then put into labeled plastic tubes, sealed, and transferred to cold-storage space aboard the drill- ing vessel. At the end of Expedition 376, cores were transferred from the ship to the Kochi Core Center (Japan) for permanent storage.
Sample identification
Sample names are computer-generated constructs of multiple pieces of information registered in the LIMS database during the course of the various sampling and curation processes that follow specific rules. Understanding the three concepts (text ID, label ID, and printed labels) in use may help users enter the correct informa- tion into SampleMaster to find samples of interest using the avail- able filters in the LIMS Reports applications.
Text ID
Samples taken on the JOIDES Resolution are uniquely identified for use by software applications using the text ID, which combines two elements:
•The sample type designation (e.g., SHLF for section half) and
•A unique sequential number for any sample and sample type added to the sample type code (e.g., SHLF30495837).
The text ID is not particularly helpful to most users. For a more pro- cess-oriented comprehensible sample naming convention, the label ID links a number of parameters, according to specific rules.
Label ID
The label ID is used throughout JOIDES Resolution workflows as a convenient, comprehensible sample identification and nomen-
clature. The label ID is made up of two parts: primary sample iden- tifier and sample name. Label IDs are not necessarily unique.
Primary sample identifier
The primary sample identifier is composed of the following pa- rameters, per decades-long convention:
•Expedition during which the core was taken (e.g., 376);
•Site at which one or more holes were drilled (e.g., U1527);
•Hole at the designated site (e.g., A);
•Core number and type retrieved in one wireline run (e.g., 3R [R
= RCB]);
•Section cut from the core (e.g., 2);
•Section half after splitting, working or archive (W or A, respec- tively); and
•Sample top and bottom offset, relative to the parent sample (e.g., 35/37); also see the label ID offset rules below.
The complete label for the primary sample thus has 2–5 dash-de- limited terms followed by the space-delimited offset/offset element (e.g., 376-U1527A-3R-2-W 35/37).
Specific rules were set for printing the offset/offset at the end of the primary sample identifier:
•For samples taken from the hole, core, or section, offset/offset is not added to the label ID. This rule has implications for the com- mon process of taking samples from the core catcher, which tech- nically is a section (for microbiology and paleontology samples).
•For samples taken from the section half, offset/offset is always added to the label ID. The rule is triggered when an update to the sample name, offset, or length occurs.
•Offsets are always rounded to the nearest centimeter before in- sertion into the label ID (even though the database stores higher precisions and reports offsets to millimeter precision).
Sample name
The sample name is a free-text parameter for subsamples taken from a primary sample or from subsamples thereof. It is always added to the primary sample identifier following a hyphen (-NAME) and populated from one of the following prioritized user entries in SampleMaster:
•Entering a sample type (-TYPE) is mandatory (same sample type code used as part of the text ID; see above). By default, -NAME = -TYPE (examples include SHLF, CUBE, CYL, PWDR, etc.).
•If the user selects a test code (-TEST), the test code replaces the sample type and -NAME = -TEST. The test code indicates the purpose of taking the sample, which does not guarantee that the test was actually completed on the sample (examples include TSB, ICP, PMAG, MAD, etc.).
•If the user selects a requester code (-REQ), it replaces -TYPE or -TEST, and -NAME = -REQ. The requester code represents the initials of the requester of the sample who will conduct post- cruise analysis (examples include CDR, SEH, etc.).
•If the user types a value (-VALUE) in the -NAME field, perhaps to add critical sample information for postcruise handling, the value replaces -TYPE, -TEST, or -REQ, and -NAME = -VALUE (examples include TAK-80deg, CARA-40mT, etc.).
In summary, and given the examples above, the same subsample may have the following label IDs based on the priority rule -VALUE
> -REQ > -TEST > -TYPE:
•376-U1528D-3R-1-W 35/37-CYL,
•376-U1528D-3R-1-W 35/37-PMAG,
•376-U1528D-3R-1-W 35/37-CARA, and
•376-U1528D-3R-1-W 35/37-CARA-40mT.
When subsamples are taken out of subsamples, the -NAME of the first subsample becomes part of the parent sample ID and an- other -NAME is added to that parent sample label ID:
•Primary_sample_ID-NAME and
•Primary_sample_ID-NAME-NAME
For example, a TSB taken from the working half at a 40–42 cm off- set from the section top resulted in the label ID 376-U1528D-3R-1- W 40/42-TSB. After the thin section was prepared (~48 h later), the technician entered it as a subsample of the billet (because additional thin sections could be prepared from the same billet) and entered the value TS08 (because it was the eighth thin section made during the expedition). The resulting thin section label ID was 376- U1528D-3R-1-W 40/42-TSB-TS_8.
Printed labels
The requirements for printed labels have no relationship to the rules applied to create the label ID. A printed label may look like it carries a label ID, and the label ID is encoded in the barcode field, but the rules for what is printed on the label are subject to the label format definition, which emphasizes requester and routing infor- mation.
Depth computations
The bit depths in a hole during deployment of a reentry system or drilling and coring are based on the length of drill pipe added at and deployed beneath the rig floor (to the nearest 0.1 m). These depths are reported on the drilling depth below rig floor (DRF) scale (in meters) (Figure F3). When applicable, these depths are con- verted to the drilling depth below seafloor (DSF) scale by subtract- ing the seafloor depth determined by tagging the seafloor (or some other method) from the current bit depths (both on the DRF scale).
The bit depths (on the DRF and DSF scales) at which a coring ad- vance begins and ends define the cored interval.
Once the recovered core is subjected to curatorial procedures (see Core curatorial procedures and sampling) (Figure F1), the core depth below seafloor, method A (CSF-A), depth scale is used for assigning depths to samples and measurements. The top depth of a core on the CSF-A scale is equal to the top of the cored interval on the DSF scale. However, the bottom depth of the core on the CSF-A scale and the depths of samples and measurements in the core are based on the curatorial procedures and rules applied on the catwalk and in the shipboard laboratory and have no defined rela- tion to the bottom depth of the cored interval on the DSF scale.
Depths of samples and associated measurements on the CSF-A scale were calculated by adding the offset of the sample or measure- ment from the top of its section and the lengths of all higher sec- tions in the core to the top depth of the cored interval. This computation assumes that the recovered material represents a con- tiguous interval, starting at the top depth of the cored interval, even if core pieces are separated by nonrecovered stratigraphic intervals.
If a core is shorter than the full barrel length and/or consists of more than one piece, the true depth of a sample or measurement in the core is unknown and a sample depth uncertainty should be consid- ered when analyzing data associated with the core material.
If cores must be depth-shifted to create a modified depth scale that better represents the stratigraphy at a site or simply to remove artificial overlaps between cores related to natural, drilling, or cura- torial processes, a core composite depth below seafloor (CCSF) scale
is constructed. A simple, single depth offset is defined for each core, and the transform from the CSF-A scale to the CCSF scale for all cores in a hole is given by the affine table. All site reports and figures, except those relating to logging, use the CSF-A depth scale (see the LIMS database for offset values used during Expedition 376).
Additional depth scales are defined for downhole logging opera- tions because those measurements are based on the length of the logging cable deployed beneath the rig floor with specific sources of uncertainly and correction procedures.
In summary, the depth scales used (Figure F3) (IODP Depth Scales Terminology version 2; http://www.iodp.org/top-re- sources/program-documents/policies-and-guidelines/142- iodp-depth-scales-terminology-april-2011/file) and the cor- responding pre-IODP references are as follows:
•Drilling and coring depth scales:
•DRF = meters below rig floor (mbrf).
•DSF = meters below seafloor (mbsf).
•CSF-A = mbsf.
•CCSF = meters composite depth (mcd).
•Logging depth scales:
•Wireline log depth below rig floor (WRF) = mbrf.
•Wireline log depth below seafloor (WSF) = mbsf.
•Wireline log speed-corrected depth below seafloor (WSSF)
= mbsf.
•Wireline log matched depth below seafloor (WMSF) = mbsf.
Core reference frame for sample orientation
Each core piece that has a length exceeding that of the core liner diameter is associated with its own CRF (i.e., oriented; Figure F2).
The primary reference is the axial orientation (i.e., the top and bot- tom of the piece) determined by piece orientation when extracted from the core barrel. The core axis defines the z-direction, where positive is downcore. The secondary reference, the cut line, is an ar-
bitrarily marked axis-parallel line on the whole-round surface of a piece that marks the plane through the cut line and the core axis where the piece will be split. The cut line was selected to maximize the dip angle of planar features on the split surface, which facilitates accurate structural measurements. The x-axis of the CRF is defined orthogonally to the cut plane, positive (000°) into the working half and negative (180°) into the archive half. The y-axis is orthogonal to the x-z plane and, using the right-hand cork-screw rule, is positive (090°) to the right and negative (270°) to the left when looking up- core at the working half (Figure F2).
Cube samples taken from the working half were marked with an arrow pointing in the −z-direction (upcore) on the working half sur- face (y-z plane), which defines the cube’s orientation unequivocally in the CRF. TSBs and thin sections made from billets were also marked with an upcore arrow in the most common case where the thin section was cut from the y-z plane of the working half. If thin sections were cut in the x-y or x-z plane, these directions were marked on the thin sections (Figure F2).
Section graphic summary (visual core descriptions)
For each core section, the most pertinent instrument measure- ment parameters and core description observables were plotted on a section graphic summary (traditionally referred to as a visual core description form [VCD]). An existing template was reviewed by the science party, and JRSO personnel implemented modifications as needed during the course of the expedition to arrive at the final template (Figure F4). JRSO personnel plotted all graphic summaries using the final template and data retrieved from the LIMS database or directly from DESClogik, including symbols, patterns, and line plots with depth, using the commercial plotting program Strater (Figure F5). A key to symbols used on the graphic summaries is given in Figure F6.
Figure F3. Depth scale types generated on the JOIDES Resolution. LRF = logging-while-drilling (LWD) depth below rig floor, LSF = LWD depth below seafloor, MRF = mud depth below rig floor, MSF = mud depth below seafloor, SSL = seismic depth below sea level, SSF = seismic depth below seafloor. Depth scales used during Expedition 376 are defined in the text.
Rig floor depth (m) Sea level
Seafloor
Target
Water depth (m)
Seafloor depth (multiple methods)
Tool-specific depth scale types
Seafloor referenced depth scales
(“mbsf”)
WSSF
Scales based on curatorial or science procedures
(“mbsf”, “mcd”)
SSL SSF
Primary depth measurements
(“mbrf”)
DRF DSF
LRF LSF
WRF WSF
MRF MSF
WMSF Core samples and measurement depths:
m CSF-A
= Core top depth DSF = CSF-A + sum of section lengths + offset in section m CSF-B
= CSF-A
(if core length <= cored interval)
= CSF-A/(core length/cored interval) (if core length > cored interval)
m CCSF
= CSF-A + affine offset of core
CSF-A CSF-A
CCSF
Figure F4. Example VCDs for (A) volcaniclastic lithologies and (B) igneous lithologies, Expedition 376.
376-U1527C-14R-2-A, 0-25 cm UNIT: 2 SUBUNIT 2b LITHOLOGY: lapilli-tuff COLOR: light olive gray TEXTURE: matrix-supported, polymict
CLASTS: altered volcanic clasts, subrounded, slightly altered black volcanic clasts, subangular, lapilli tuff clasts, subangular UPPER CONTACT: not recovered LOWER CONTACT: planar ALTERATION: Intensely altered (clay, Mt)
VEINS: None.
STRUCTURE: Weak volcanic fabric defined by vesicles within individual volcanic clasts that do not share a common orientation.
376-U1527C-14R-2-A, 25-139 cm UNIT: 2 SUBUNIT 2b LITHOLOGY: tuff-breccia COLOR: greenish gray TEXTURE: matrix-supported, polymict
CLASTS: altered volcanic clasts, subrounded, greenish tuff, subrounded, black slightly altered volcanic, subrounded UPPER CONTACT: not recovered LOWER CONTACT: not recovered
ALTERATION: Intensely altered (clay, silica)
VEINS: None.
STRUCTURE: Weak volcanic fabric defined by vesicles within individual volcanic clasts that do not share a common orientation.
XRD
PMAG
TS XRD TSB
2b 01
02 0
10
20
30
40
50
60
70
80
90
100
110
120
130 206.50 206.40 206.30 206.20 206.10 206.00 205.90 205.80 205.70 205.60 205.50 205.40 205.30 205.20
Description Reflectance
b*
a*
L*
52.0
32.0
12.0
Magnetic susceptibility
SHMSL (SI)
2100
1600
1100
600
100
Matrix volume (%)
100
75
50
25
0
Grain size AVG,MAX
1Clay SiltSandGranuleSmall pebbleMedium pebbleLarge pebbleVery large pebbleCobble
Sorting
1Poor Moderate Well
Grading
Fractures and veins
Major minerals (from XRD) Sulfide
abundance (%)
15
10
5
0Alteration rank
Graphic lithology Core image Shipboard samples
Orientation
Igneous lith. unit
Piece number
Core length (cm)
Depth (m)
Hole 376-U1527C-14R Section 2, Top of Section: 205.17 m (CSF-A)
A
B
376-U1527C-10R-1A, 0-56 cm UNIT: 1
LITHOLOGY:
plagioclase-pyroxene phyric dacite lava COLOR: black TEXTURE: phyric, glomeroporphyritic PHENOCRYSTS: 20 % plagioclase, 1 % pyroxene GROUNDMASS: vitric, microcrystalline VESICLES: moderately vesicular UPPER CONTACT: not recovered LOWER CONTACT: not recovered
ALTERATION: Unaltered except local minor FeO(OH) VEINS: None.
STRUCTURE: Moderate volcanic fabric defined by vesicles and plagioclase phenocrysts.
TS TSB
ICP
1 01 02 03 04 05
06 07
08
09
10 0
10
20
30
40
50 176.10 176.00 175.90 175.80 175.70 175.60
Description Reflectance
b*
a*
L*
28.0
18.0
8.0
-2.0
Magnetic susceptibility
SHMSL (SI)
1500
1000
500
Vesicle size MAX,MODE (mm)
20
15
10
5
0
Groundmass grain size
(mm)
1
0.75
0.5
0.25
0
Phenocrysts PLAG,CPX volume
(%)
2520151050
Fractures and veins
Major minerals (from XRD) Sulfide
abundance (%)
15
10
5
0Alteration rank
Graphic lithology Core image Shipboard samples
Orientation
Igneous lith. unit
Piece number
Core length (cm)
Depth (m)
Hole 376-U1527C-10R Section 1, Top of Section: 175.6 m (CSF-A)
Figure F5. General data flow and software tools used during Expedition 376. The JOIDES Resolution toolbox includes a mixture of custom-built software appli- cations (blue), commercial software programs (pink), and combinations of both (green). All data are loaded to the LIMS database and can be downloaded in various ways as text files or Excel workbooks (yellow). QC = quality control, SEM = scanning electron microscope.
Core description Imaging Sample
Master Register
samples Measure, observe Store
information
Display and retrieve information
Review and report results
Analytical instruments Section-half images Whole-round images
Structural geology Alteration Volcanology Chemistry Paleomagnetism Physical properties
Microbiology Whole-round composites
Section-half composites
Thin sections Microphotographs SEM
Close-up
LIMS database
LIMS Reports (LORE) HTML view of all data
DESClogik export to Excel workbooks Excel workbooks
CSV files
l e c x E 2 S M I L
SCORS Downloader LIMSpeak
CSV files
Section graphic summaries
Strater Custom graphics
Data tables User applications QC displays
TS form reports TS Form Reporter
Figure F6. VCD legend with symbols following USGS geologic map symbolization, Expedition 376.
Major minerals (from XRD) Alunite Anhydrite Augite Barite Chlorite Clay Cristobalite Diaspore Fe-Ti oxide Goethite Plagioclase Gypsum Illite
Iron oxyhydroxide Magnetite Opal Oxide Prehnite Pyrite Pyrophyllite Quartz Silica Smectite Sphalerite Zeolite Alteration style
Brecciated Recrystallized Fracture controlled Corona
Pseudomorphic Patchy Coating Infilling Pervasive
Alteration degree Completely altered Intensely altered Highly altered Moderately altered Slightly altered Unaltered
Volcanic Dacite lava Altered volcanic
Volcaniclastic Epiclastic Clay Mudstone Siltstone Sandstone
Ash Lapilli ash Tuff
Lapilli-tuff Lapillistone Tuff-breccia Pyroclastic breccia Altered volcaniclastic rock
Grading Normally graded Reversely graded
Structures Fault
Vein Fracture Lapilli tephra
The VCDs summarize the shipboard observations for the sec- tion, starting with a summary from each description team (igneous petrology and volcanology, alteration, and structural geology) across the top. All other information is plotted by depth in the main report area, starting with an image of the archive half and followed by the identification of pieces recovered; the lithologic units de- fined; the shipboard samples analyzed; the most significant ob- served igneous, alteration, and structural parameters; magnetic susceptibility (MS) measurements; and reflectance (Figure F4).
Thin section reports were created to summarize the most signif- icant information for each thin section, which is extracted with a program from the extensive observation workbooks exported from DESClogik in a single-page PDF (Figure F7). JRSO personnel cre- ated the report definition in the report builder custom tool, updated the definition with input from scientists during the course of the ex- pedition, and generated batches of PDF reports on request using the report writer tool.
Software tools and databases
LIMS database
The JRSO LIMS database is an infrastructure to store all opera- tional, sample, and analytical data produced during a drilling expe- dition (Figure F5). The LIMS database consists of an Oracle database and a custom-built asset management system, along with
numerous web services to exchange data with information capture and reporting applications.
Sample registry tool
All samples collected during Expedition 376 were registered in the LIMS database using SampleMaster. The program has work- flow-specific interfaces to meet the needs of different users. Sample registration begins with the driller entering information about the hole and the cores retrieved from the hole. IODP personnel enter additional core information, sections, pieces, and any other sub- samples taken from these cores, such as cubes or TSBs. One inter- face is designed for scientists to autonomously enter subsample information according to the sampling plan.
Imaging systems
The following highly integrated and workflow-customized im- aging systems were used during Expedition 376:
•The SHIL captured section-half surface images; it also captured whole-round section surface (360°) images using a special con- figuration that images four swaths at 90° angles to cover ~90% of the surface.
•A manual compositing process for the whole-round section im- ages produced a quasi-360° presentation of features on the core surface.
Figure F7. Example of a thin section summary (output from DESClogik), Expedition 376.
THIN SECTION LABEL ID: 376-U1528D-4R-1-W 92/94-TSB-TS_43 TS no.: 43
Description
Group Summaries
Igneous petrology:
Completely altered clast-supported polymict lapillistone. Some clasts are pervasively altered so that original clast-matrix boundaries are blurred. No primary igneous minerals remain. A few clasts preserve a porphyritic texture with the shape of pseudomorphed tabular minerals ranging from 0.8-0.2 mm
(presumably plagioclase phenocrysts). In a few cases, fine-grained secondary tabular sulfate minerals were aligned, suggesting that they may have replaced plagioclase microlites. Pyrite is preferentially enriched in some clasts over others. Some clasts contain filled vugs (up to 2 mm) that are unlikely to be vesicles based on their morphology. The matrix is fine grained and completely replaced by secondary alteration minerals.
The matrix also contains a higher proportion of minerals plucked out of the thin section during polishing.
Alteration:
Clasts are strongly resorbed but still distinguishable. Grayish matrix is replaced by clay minerals, anhydrite, alunite, and minor native sulfur and gypsum. Plagioclase is completely pseudomorphed by alunite, anhydrite, and minor gypsum. Euhedral pyrite crystals are disseminated in the matrix. Minor magnetite grains with a skeletal texture, which are partially dissolved and replaced by pyrite are disseminated in the matrix. Veins (< 0.1 mm) are filled with anhydrite and pyrite. Vugs are filled with alunite and anhydrite.
Anhydrite is partially dissolved.
Structure: Some volcanic clasts have a shape-preferred orientation defined by elongate plagioclase (pseudomorphed), especially in the rim of the clast.
Plane-polarized
47173781
Cross-polarized
47173801
•An automated compositing process for all section-half images of a core produced a virtual core table view.
•Close-up images were taken to meet special imaging needs, typ- ically requested by shipboard scientists, not covered with rou- tine linescan images.
•A custom-built imaging system captured whole-area high-reso- lution thin section images.
•Commercial cameras mounted on all microscopes took photo- micrographs.
•The scanning electron microscope (SEM) captured high-resolu- tion images.
All images were uploaded to the LIMS database immediately af- ter capture and were accessible via browser-based reports. Images were provided in at least one generally usable format (JPG, TIFF, or PDF) and in multiple formats if appropriate.
Core description
Descriptive and interpretive information was entered and stored using DESClogik, and all information was stored in the LIMS data- base. The main DESClogik interface is a spreadsheet with extensive data entry and data validation support. The columns (observables), worksheets (sets of observables logged in context), and workbooks (sets of worksheets used in conjunction with each other) are entirely configurable by JRSO personnel based on experience from past ex- peditions and specific requirements defined by Expedition 376 sci- entists.
Teams were formed for each 12 h shift to describe volcanology, rock alteration, and structural geology for all core sections and thin sections prepared on board (see Igneous petrology and volcanol- ogy, Alteration, and Structural geology). This approach ensured that interdisciplinary teams worked collaboratively on all recovered material. Consistency in descriptions between teams was moni- tored during shift changes when time was available to jointly look at recovered material and exchange information.
At the beginning of the expedition, each group reviewed existing workbook templates for fresh and altered volcanic rocks and speci- fied expedition-specific modifications that were implemented in the DESClogik application by JRSO personnel. Observable parameters were of three types: controlled values, free text, and numbers. For the controlled-value columns, subject matter experts defined spe- cific value lists that were configured in DESClogik as drop-down lists to facilitate consistent data entry. These values are defined in each description team’s section of this chapter. Free text fields had no constraints and were used for comments and summaries.
Instrumented measurement systems
Physical property, paleomagnetic, and geochemistry analytical systems in the shipboard laboratories were used to capture instru- mental data, as described in the corresponding sections below, us- ing dozens of commercial and custom-built software applications.
In cases where no user interaction was required after data capture, data upload to the LIMS database was triggered automatically. In cases where quality control or data processing was needed before upload, the user triggered the upload to the LIMS database when the data were ready.
Data retrieval
All data used for analysis, interpretation, and report preparation were downloaded using the latest version of LIMS Reports (Figure F5), where the user selects the type of desired information from ~50 available reports, selects a hole (and optionally cores, sections, or
samples), and uses additional report-specific filters, if desired, to view a report online or download information in a standard comma-separated value (CSV) file.
Alternatively, data could also be retrieved using applications built for more specific purposes with various filtering and configu- ration options:
•LIMS2Excel, a highly configurable Java-based data extractor in which users can save a specific configuration for any combina- tion of data parameters and export it into a Microsoft Excel workbook, and
•SCORS Downloader, which is designed to download certain data sets iteratively for stratigraphic analysis programs and can be used for any data and purpose.
Many data sets could also be viewed in LIVE, a browser-based application that plots cores, sections, and samples along with a user- selected data set, including images, against depth. The application is particularly useful for monitoring core logging data acquisition, performing real-time quality control, and browsing images.
Igneous petrology and volcanology Lithology
Igneous and volcaniclastic rocks were the common primary lithologies encountered during Expedition 376. Most igneous and volcaniclastic rock description procedures used were adapted from Integrated Ocean Drilling Program Expeditions 330 and 344 (Expe- dition 330 Scientists, 2012; Harris et al., 2013) and IODP Expedi- tions 349, 350, 351, and 352 (Li et al., 2015; Tamura et al., 2015;
Arculus et al., 2015; Reagan et al., 2015). Data for the macroscopic and microscopic descriptions of recovered cores were entered into the LIMS database using DESClogik.
Our shipboard studies sought to systematically describe the physical appearance, petrology, and alteration of the cored rocks.
First, phenocryst abundance and appearance, lithologic compo- nents (for volcaniclastic sediments), and characteristic igneous tex- tures and vesicle distribution were described at a macroscopic level and investigated in more detail by thin section and SEM imaging.
Second, the recovered and described material was divided into co- herent units. Igneous and volcaniclastic lithologic unit boundaries were defined using complementary information including petro- graphy, volcanic and sedimentary structure/textures, chemical composition, and physical properties such as MS.
Core description workflow
The procedures used to document the composition, texture, and structures of rocks recovered during Expedition 376 included visual core description [VCD only refers to the form, not the process (see dictionary)], petrographic thin section analysis, digital color imag- ing, SEM imaging, color spectrophotometry, pXRF (see Geochem- istry), XRD, and ICP-AES. (Note that data produced on the Agilent 5110 inductively coupled plasma–optical emission spectrometer [ICP-OES] were collected in AES mode and are referred to as “ICP- AES” in the online LIMS/LIMS Reports [LORE] database. Thus, in this volume, “ICP-AES” is used to refer to these data.) Before the core was split into working and archive halves, nondestructive mea- surements of physical properties were implemented (see Physical properties). Whole-round images of >10 cm long pieces of core were generated by stitching together images taken at four distinct angles (0°, 90°, 180°, and 270°). All cores were processed following the established shipboard procedure for hard rocks. Prior to split-