N-loss isotope effects in the Peru oxygen minimum zone studied using a mesoscale eddy
as a natural tracer experiment
Annie Bourbonnais1, Mark A. Altabet1, Chawalit N. Charoenpong2,3, Jennifer Larkum1, Haibei Hu1, Hermann W. Bange4, and Lothar Stramma4
1School for Marine Science and Technology, University of Massachusetts Dartmouth, New Bedford, Massachusetts, USA,
2Department of Marine Chemistry and Geochemistry, Woods Hole Oceanographic Institution, Woods Hole, Massachusetts, USA,3Department of Earth, Atmospheric and Planetary Sciences, Massachusetts Institute of Technology, Cambridge, Massachusetts, USA,4GEOMAR Helmholtz Centre for Ocean Research Kiel, Kiel, Germany
Abstract
Mesoscale eddies in Oxygen Minimum Zones (OMZs) have been identified as importantfixed nitrogen (N) loss hotspots that may significantly impact both the global rate of N-loss as well as the ocean’s N isotope budget. They also represent“natural tracer experiments”with intensified biogeochemical signals that can be exploited to understand the large-scale processes that control N-loss and associated isotope effects (ε; the‰deviation from 1 in the ratio of reaction rate constants for the light versus heavy isotopologues).We observed large ranges in the concentrations and N and O isotopic compositions of nitrate (NO3), nitrite (NO2), and biogenic N2associated with an anticyclonic mode-water eddy in the Peru OMZ during two cruises in November and December 2012. In the eddy’s center where NO3was nearly exhausted, we measured the highestδ15N values for both NO3and NO2(up to ~70‰and 50‰) ever reported for an OMZ.
Correspondingly, N deficit and biogenic N2-N concentrations were also the highest near the eddy’s center (up to
~40μmol L1).δ15N-N2also varied with biogenic N2production, following kinetic isotopic fractionation during NO2reduction to N2and, for thefirst time, provided an independent assessment of N isotope fractionation during OMZ N-loss. We found apparent variableεfor NO3reduction (up to ~30‰in the presence of NO2).
However, the overallεfor N-loss was calculated to be only ~13–14‰(as compared to canonical values of
~20–30‰) assuming a closed system and only slightly higher assuming an open system (16–19‰). Our results were similar whether calculated from the disappearance of DIN (NO3+ NO2) or from the appearance of N2 and changes in isotopic composition. Further, we calculated the separateεvalues for NO3reduction to NO2 and NO2reduction to N2of ~16–21‰and ~12‰, respectively, when the effect of NO2oxidation could be removed. These results, together with the relationship between N and O of NO3isotopes and the difference inδ15N between NO3and NO2, confirm a role for NO2oxidation in increasing the apparentεassociated with NO3reduction. The lowerεfor N-loss calculated in this study could help reconcile the current imbalance in the global N budget if representative of global OMZ N-loss.
1. Introduction
Bioavailablefixed nitrogen (N) is an essential macronutrient for phytoplankton that limits marine primary productivity throughout much of the surface ocean. The interplay between sources, mainly N2fixation by diazotrophic organisms and sinks, i.e., denitrification and anammox, controls the ocean’sfixed N inventory. N sinks occur under low oxygen (O2) conditions (typically≤5μmol L1) through the conversion offixed N to predominately N2 with a small proportion to N2O, a potent greenhouse gas. It is still a matter of debate whether the global ocean N cycle is in balance at present [Gruber,2004, 2008;Codispoti, 2007;DeVries et al., 2013].Codispoti[2007] suggested significant imbalances despite huge uncertainties in rate estimates, with more sedimentary and water-column N-loss than N2fixation, which would globally impact primary productivity over time and, ultimately, the capacity of phytoplankton to sequester CO2in the ocean. WhileGroßkopf et al.
[2012] suggested that N2fixation rates by direct measurements might have been significantly underestimated, their revised N2fixation rates are still insufficient to balance global N-loss inCodispoti’s [2007] budget.
A large portion of the ocean’sfixed (i.e., bioavailable) N-loss to N2gas takes place in oxygen minimum zones (OMZs) of the eastern tropical North and South Pacific (ETNP and ETSP) and the Arabian Sea, even though
Global Biogeochemical Cycles
RESEARCH ARTICLE
10.1002/2014GB005001
Key Points:
•Large N-loss signals were observed in a mesoscale eddy
•Nitrite oxidation increases the overall isotope effect of nitrate reduction
•Low isotope effects for net N-loss were estimated
Supporting Information:
•Supporting information
Correspondence to:
A. Bourbonnais,
abourbonnais@umassd.edu
Citation:
Bourbonnais, A., M. A. Altabet, C. N. Charoenpong, J. Larkum, H. Hu, H. W. Bange, and L. Stramma (2015), N-loss isotope effects in the Peru oxygen minimum zone studied using a mesoscale eddy as a natural tracer experiment,Global Biogeochem. Cycles, 29, 793–811, doi:10.1002/2014GB005001.
Received 1 OCT 2014 Accepted 23 APR 2015
Accepted article online 25 APR 2015 Published online 6 JUN 2015
©2015. American Geophysical Union. All Rights Reserved.
they represent only ~1% (O2≤20μmol L1) of the total oceanic volume [Lam and Kuypers, 2011]. These regions are characterized by high primary productivity and low O2supply from source waters. Recent observations suggest an intensification of the world’s OMZs over the past few decades [Stramma et al.,2010] and perhaps into the future as a consequence of global warming [Keeling and Garcia, 2002], which underscores the need to better constrain the processes and mechanisms that drive N-loss in these regions. There is now geochemical evidence that mesoscale eddies can act asfixed N loss hotspots in OMZs [Altabet et al.,2012;
Stramma et al.,2013]. Eddies are present in all OMZs during all seasons [Chaigneau et al.,2009;Chelton et al.,2011]. An eddy frequency of ~40% was estimated for our study region off Peru, confirming the common occurrence of eddies in this area, with maximal activity occurring during austral fall [Chaigneau et al., 2008]. Since eddies lead to heterogeneity in OMZ N-loss processes, a reevaluation of N-loss pathways and rates as well as the impact of eddies on the global N cycle is required. While the exact mechanism of enhanced N-loss in eddies is still largely unclear, near-coastal eddies could transport and concentrate organic material (OM) from highly productive shelf waters as is speculated for the Peru coastal upwelling region [Altabet et al.,2012]. As organic matter input is likely limiting for heterotrophic denitrification in OMZs [Babbin et al.,2014], such transport would enhance N-loss offshore. Alternatively, cyclonic and mode-water eddies are characterized by the uplifting of the upper thermocline which can inject nutrients into the euphotic zone, thereby fueling primary productivity and downward organic matterflux locally [e.g.,McGillicuddy et al.,2007].
Uncertainties in estimating global ocean N-loss rates lie in our lack of understanding of both the spatial and temporal variability of these processes as well as estimating the relative contribution from sedimentary N-loss.
The ratio of sedimentary versus water-column N-loss is typically constrained using a global isotope mass balance.
Only minor isotope fractionation is imparted during N2fixation, theδ15N from newlyfixed N being approximately 2 to 0.5‰[Wada and Hattori, 1976]. In contrast, relatively large kinetic isotope effects (ε) have been reported for water-column NO3reduction (~20–30‰) [Brandes et al.,1998;Voss et al.,2001;Granger et al.,2008] and NO2reduction (~15‰) [Bryan et al.,1983;Brunner et al.,2013] during denitrification and anammox. The netε of sedimentary NO3reduction is generally much lower (generally ≤3‰), mostly due to diffusion limitation (i.e., NO3is all consumed within the sediments) [Lehmann et al.,2007;Alkhatib et al.,2012], although a recent study reports higher values in surface sediments from the coastal Baltic Sea (up to 19‰) [Dähnke and Thamdrup, 2013]. These processes and isotope effects set theδ15N of mean ocean NO3, which represents the bulk of the dissolved inorganic nitrogen (DIN = NO3+ NO2+ ammonium (NH4+)) in the ocean, at ~5‰ [Sigman et al.,2009]. Based on isotope mass-balance and directly measured or modeled N2fixation and N-loss rates, a ratio of at least 3:1 between sedimentary and water-column N-loss has been estimated [e.g.,Brandes and Devol, 2002], indicating large imbalances in the global N budget.
Many uncertainties exist in current environmental estimates of the overallεassociated with OMZ N-loss.
Some recent studies suggest a lower than canonical value forεat the organism-level for NO3reduction during water-column denitrification in OMZs [Kritee et al.,2012;Casciotti et al.,2013] or lower overallε for N-loss due to local large NO3drawdown and the contribution from organic N via remineralization and anammox to N2production [Altabet, 2007]. A lower overallεfor OMZ N-loss could reduce current estimates of sedimentary denitrification and thus bring the global N budget more in balance.
Here we address several limitations in previous studies. First, all prior studies were only able to examine substrate pools (mainly NO3) and could not resolve the relatively small variations expected (due to the large atmospheric background) in the isotopic composition of the product N2. Second, Rayleigh equations are typically used to calculate εbased on observed changes in isotopic composition as a function of fractional substrate drawdown (f ). To determine f, it is necessary to know the DIN expected (Nexp) in the absence of N-loss, or initial NO3:
f¼Nobs=Nexp (1)
The DIN deficit (Ndef;) then is a measure of the amount offixed N converted to N2,
Ndef¼NexpNobs (2)
Nexpis typically calculated assuming the Redfield ratio of 16 NO3to 1 phosphate (PO43) in the absence of N-loss, and Nobsis the [DIN] observed [e.g.,Devol et al.,2006;Chang et al.,2010]. This assumption is likely to
be violated in the near-coastal OMZ environment as significant PO43fluxes can be released from iron and manganese oxyhydroxides under anoxic conditions [Wallmann, 2010;Reed et al.,2011]. Third, complications from water-mass mixing can also confound estimates if they vary in end-member composition.
Other assumptions usually include identification of dominant N cycle processes. The dual NO3(N and O) isotopic composition can be used to disentangle NO3consumption and production processes in marine environments [Lehmann et al.,2005; Sigman et al.,2005;Bourbonnais et al., 2009, 2013;Casciotti, 2009].
NO3 consumption by autotrophic uptake or dissimilatory reduction generally fractionates N and O isotopes equally with a15ε:18εof 1 [Granger et al.,2004, 2008]. In contrast, theδ15N andδ18O of NO3are affected differentially during NO3 generation such as remineralization/nitrification of organic material leading to a decoupling of N and O NO3isotopes (i.e. deviation from a 1:1 relationship), when there is simultaneous NO3 consumption and production as explained in more detail below (section 3.3.1.2).
Parallel measurement of the isotopic composition of NO2 further evaluates the influence of NO2 oxidation. NO2 oxidation to NO3, even at low or nondetectable [O2], has been proposed to explain differences in co-occurringδ15N-NO3andδ15N-NO2(up to ~40‰) that are much larger than expected from NO3 reduction alone [Casciotti and McIlvin, 2007; Casciotti et al., 2013]. This follows from NO2 oxidation incurring an unusual inverse kineticε(13 to31‰, i.e., the residual NO2is depleted in15N), caused by the reversibility of NO2oxidation at the enzymatic level [Casciotti, 2009].
In this study, we measured NO3, NO2, and biogenic N2isotopes across a mesoscale eddy in the Peru OMZ during two research cruises in November and December 2012 and located in deep waters adjacent to the continental slope (Figure 1).
As an anticyclonic mode-water eddy, shallow isopycnal surfaces shoaled and denser surfaces deepened toward its center resulting in an interior of fairly homogenous hydrographic properties [McGillicuddy et al., 2007]. We exploited this eddy, with its simplified history and hydrography as well as intense N-loss signals, as a natural tracer experiment to better constrain the net environmental εof N-loss in OMZs (see Figure 2 for the terminology used to define the different ε’s estimated in this study). We also used the dual isotopic compositions (N and O) of NO3and NO2to investigate the impact of NO2 oxidation on these isotope effects.
10 9 8 7 6 5 4 3 2 1 0 -1 -2 -3 -4 -5 -6 -7 -8 -9 -10 -11 -12
12.0oS
14.0oS
16.0oS
18.0oS
20.0oS
84.0oW 80.0oW 76.0oW 72.0oW
12.0oS
14.0oS
16.0oS
18.0oS
20.0oS
84.0oW 80.0oW 76.0oW 72.0oW
Figure 1.Maps showing stations sampled (black dots) during the (a) M90 and (b) M91 cruises. Contours indicate the delayed time, 7 day, mean sea surface height anomaly (SSHA, in cm) for (a) 21 November 2012 and (b) 19 December 2012. The transects of Eddy A (black rectangles) used for our analysis are shown. SSHA data are from AVISO (http://www.aviso.oceanobs.com).
Figure 2.Terminology used for the differentε’s derived in this study.
15εNARis theεassociated with the NO3reduction to NO2(1),15εNIR is theεassociated with NO2reduction to biogenic N2(2),15εNXRis the isotope effect associated with NO2oxidation to NO3(3),15εNO3- red is the net observedεassociated with NO3reduction, which is also influenced by NO2oxidation (4), and15εDIN-lossand15εbN2(see section 3.2.3) are the netεvalues associated with overall N-loss and biogenic N2production (5), and influenced by all processes (1 to 3).
2. Sample Collection and Methods
2.1. Sampling Regime and Hydrographic Data
The impact of mesoscale eddies on the Peru OMZ was studied during two research cruises aboard the R/V Meteor on 24 to 25 November (M90) and 22 to 24 December (M91) 2012 (Figure 1), as part of the German projects SFB 754 (Climate-Biogeochemistry Interactions in the Tropical Ocean: www.sfb754.de) and SOPRAN (Surface Ocean Processes in the Anthropocene: www.sopran.pangaea.de). The presence and locations of the several eddies surveyed were confirmed by satellite data for sea surface height anomaly (SSHA; Figure 1), sea surface temperature, and chlorophyllα[Stramma et al.,2013]. In this study, we only consider the most coastal anticyclonic mode-water eddy observed during both cruises (corresponding to eddy A in Stramma et al.[2013]) to investigate the εof N-loss because it had the most intense N- loss signals.
Water samples were collected at every station close to or within the eddy (transects shown in Figure 1) using 12 L Niskin bottles (~23 depths/profile) on a CTD rosette equipped with pressure, conductivity, temperature, and O2 sensors. Oxygen and nutrients (NO3, NO2, NH4+, and PO43) concentrations were measured onboard as described inStramma et al.[2013]. Ndefwas calculated according to equation (2) where Nexp was calculated as inChang et al.[2010]:
Nexp¼15:8 PO43 0:3
(3) which takes into account preformed Ndefin the eastern tropical South Pacific Ocean.
Samples for N and O isotopic composition of NO3were collected in 125 mL plastic bottles and acidified with preloaded 1 mL of 2.5 mmol L1sulfamic acid (Sigma S-5643) in 25% HCl for preservation and NO2removal.
Any NO2present (at afinal concentration below 20μmol L1) would be removed at the time of sample collection [Granger and Sigman, 2009]. For NO2isotopic analysis, a separate set of samples was collected and preserved with NaOH (2.25 mL of 6M NaOH in 125 mL, pH = 12.5) and frozen upon analysis to prevent oxygen isotope exchange with water during storage [Casciotti et al., 2007]. N2/Ar and δ15N-N2 samples were collected in 60 mL serum glass bottles and preserved with 100μL HgCl2[Charoenpong et al.,2014].
Duplicate or triplicate samples were collected either at all stations (M90) or every other station (M91).
2.2. N and O Isotopic Composition of Dissolved Inorganic N
The stable isotopic compositions (δ15N andδ18O) of NO3and NO2were analyzed using the“azide method” as described inMcIlvin and Altabet[2005], with 10% of the total number of samples analyzed as duplicates.
For NO3isotopic analysis, cadmium wasfirst used for the reduction of NO3to NO2. For both NO3and NO2isotopic analysis, NO2was converted to nitrous oxide (N2O) using sodium azide in acetic acid. N2O gas was automatically extracted, purified, and analyzed online using a purge-trap preparation system coupled to an IsoPrime continuous-flow, isotope ratio mass spectrometer (CF-IRMS). The target sample and standard size was 15 nmol N2O. N and O isotope ratios are reported in per mil (‰), relative to N2in air forδ15N:
δ15N¼ Rsample=RAIR1
1000 (4)
where R =15N/14N, and relative to Vienna Standard Mean Ocean Water (V-SMOW) forδ18O:
δ18O¼ Rsample=RVSMOW1
1000 (5)
where R =18O/16O. Isotope values were calibrated using the following international references: IAEA N3 (δ15N = 4.7‰andδ18O = 25.6‰), USGS 34 (δ15N =1.8‰andδ18O =27.9‰), USGS 35 (δ15N = 2.7‰and δ18O = 57.5‰), and an in-house standard (LABmix, δ15N = 38.9‰) for NO3 isotopic analysis. For NO2 isotopic analysis, we used several in-house (MAA1, δ15N =60.6‰; MAA2, δ15N = 3.9‰; Zh1, δ15N =16.4‰) and other standards (N23, δ15N = 3.7‰ andδ18O = 11.4‰; N7272, δ15N =79.6‰ and δ18O = 4.5‰; N10219, δ15N = 2.8‰ andδ18O = 88.5‰; see Casciotti and McIlvin [2007]). Reproductibility was generally better than 0.2‰forδ15N and 0.5‰forδ18O.
2.3. N2/Ar andδ15N-N2Measurements
High-precision measurements of N2/Ar andδ15N-N2were made on septum sealed samples using on-line gas extraction system coupled to a multicollector CF-IRMS as described inCharoenpong et al.[2014]. O2 was removed from the samples prior toδ15N-N2analysis using a CuO/Cu reduction column placed in a 500°C
furnace to prevent interferences caused by interaction between O2, N2, and their fragments within the IRMS ion source. Excess N2concentration ([N2]excess) inμmol L1, the observed [N2] minus the equilibrium [N2] at in situ temperature and salinity, was calculated as inCharoenpong et al.[2014] and calibrated daily against seawater standards equilibrated with air atfixed temperature. Excess N2concentrations determined using the O2and no O2modes agreed well and the average is reported here. Precision of the measurements (standard deviation) for the samples was generally better than 0.7 μmol L1 for [N2]excess and 0.03‰ forδ15N-N2.
2.4. Derived Parameter Calculations 2.4.1.Δ(15,18) andΔδ15N
We calculated NO3isotope anomalies, i.e., the deviation from a 1:1 relationship expected during NO3 assimilation or denitrification, followingSigman et al.[2005]:
Δð15;18Þ ¼δ15Nδ15Nm 18ε=15ε
δ18Oδ18Om
(6) whereδ15Nm= 5.5‰andδ18Om= 2.5‰are the meanδ15N andδ18Οvalues of the deep waters for this region [this study andCasciotti et al.,2013] and18ε/15εis the ratio of N versus O isotope enrichment of 1:1 observed during assimilatory or dissimilatory NO3reduction [Granger et al.,2004, 2008;Lehmann et al.,2005].Δδ15N, defined as the difference betweenδ15N-NO3andδ15N-NO2[Casciotti et al.,2013], was calculated when δ15N-NO2data were available.
2.4.2. Biogenic N2andδ15N-N2
We calculated biogenic [N2] ([N2]biogenic), the [N2] produced by denitrification or anammox, by subtracting the [N2]excessat a background station unaffected by N-loss ([O2]>10μmol L1) located north of the OMZ (1.67°N, 85.83°W, M90 cruise) from the observed [N2]excess at corresponding σθ (see supporting information). This corrects for non-local biological N-loss as well as physically produced deviations in equilibrium N2/Ar [e.g., bubble injection at remote water mass outcrop regions; see Hamme and Emerson, 2002].
Theδ15N of biogenic N2(δ15N-N2 biogenic, in‰) was calculated by mass balance:
δ15N-N2 biogenic¼ ½ N2equilþ½ N2biogenic
Δδ15N-N2=½ N2biogenic (7)
where [N2]equil is the equilibrium [N2] at in situ temperature and salinity, andΔδ15N-N2 is theδ15N-N2 anomaly, i.e., the difference between δ15N-N2 observed and at equilibrium for in situ temperature and salinity.
We also calculated the expectedδ15N-biogenic N2(δ15N-N2 biogenic exp) from our DIN isotope data to assess isotopic mass balance between DIN loss and [N2]biogenicproduction (see section 3.2.3):
δ15N-N2 biogenic exp¼ Nexp5:5½NO3 δ15N-NO3½NO2 δ15N-NO2
=Ndef (8)
where 5.5 is theδ15N in‰of DIN prior to N-loss.
2.5. Isotope Effect Calculations
We calculated isotope effectsfirst assuming a closed system where there is mass balance between the consumption of NO3or DIN (the sum of NO3and NO2) and the accumulation of biogenic N2over time (e.g., no external sources or sinks), using Rayleigh equations:
δ15Nsubstrateð Þ ¼f δ15Nsubstrateðf¼1Þ εln f½ (9) δ15Nproductð Þ ¼f δ15Nsubstrateðf¼1Þ þεfln f½ =½1f (10) where f is the fraction of remaining NO3or DIN.
In addition, we calculated isotope effects assuming a steady state open system, as is the case where the substrate is continually replenished by mixing, using modified Rayleigh equations [Mariotti et al., 1981;
Altabet, 2005]:
δ15Nsubstrateð Þ ¼f δ15Nsubstrateðf¼1Þ þε½1f (11) δ15Nproductð Þ ¼f δ15Nsubstrateðf¼1Þ εf (12)
f was calculated for NO3(f1) or DIN removal (f2) by either (1) assuming Redfield stoichiometry to calculate the initial [NO3] or [DIN] (see equation (2)):
f1red¼½NO3obs=½ Nexp (13) f2red¼½NO3þNO2obs=½ Nexp (14) or (2) using the sum of observed [DIN] and [N2]biogenic:
f1bN2¼½NO3obs= ½NO3obsþ½NO2obsþ½ N2biogenic2
(15) f2bN2¼½NO3þ NO2obs= ½NO3obsþ ½NO2obsþ ½ N2biogenic2
(16)
3. Results and Discussion
3.1. An Eddy N-Loss Hot Spot
The formation of near-coastal eddies south of 15°S off San Juan (Peru) during the austral spring has been associated with a reduction in coastal upwelling and northward advection of warmer and saltier subtropical waters. Eddy A first appeared on the shelf after 13 September 2012 and was thus about 2 (M90) to 3 (M91) months old at the time of sampling. In November 2012 (M90 cruise), it had already separated from the shelf-break and stayed stationary at ~16°S and ~76°W until mid-December 2012. This anticyclonic eddy was up to 2°C warmer and 0.2 saltier at its center relative to its edges and had a swirl velocity of up to 35 cm s1[Strammaet al., 2013]. The vertical density distribution showed lens-shaped isopycnals, characteristic of a mode-water eddy, i.e., the isopycnals were uplifted and deepened above and below 110 m, respectively (Figure 3). The largest differences in physical and chemical properties between the center and the edges of the eddy were observed in the upper 600 m. Near real-time satellite data for November 21, supported by density, velocity, O2, nutrient, and chlorophyllαdata, confirmed that the core of the eddy was located at ~76.30°W during the M90 cruise (station 162) though the delayed time SSHA data in Figure 1a suggest it was located east of the transect used in this study. In mid-December, the eddy started to move northwestward at 6.6 cm s1and on 22 to 24 December 2012, during the M91 sampling campaign (see Figure 1), its core was located at ~16.5°S, ~76.5°W [Stramma et al.,2013]. SeeStramma et al.[2013] for a Figure 3.Section plots of Eddy A showing [O2] (μmol L1) and temperature versus salinity for transects made during the (a, b) M90 and (c, d) M91cruises.σθ(kg L1) contours are shown in overlay in Figures 3a and 3c. Black dots represent sampled depths for each station. Station numbers are indicated above Figures 3a and 3c.
more detailed analysis of the physical and chemical properties (e.g., O2and pH) associated with this near-coastal eddy for the M90 cruise.
Remarkably, NO3was completely depleted by N-loss processes near the eddy’s center. Concentrations were
~0μmol L1in the upper part of the OMZ (between ~50 and 150 m depth) at stations 162 (M90) and 87/88 (M91; Figures 4a and 4b), and no NO3isotope data could be obtained for these depths. As expected during dissimilatory NO3reduction [Brandes et al.,1998;Voss et al.,2001;Granger et al.,2008], NO3δ15N andδ18O increased to up to ~70‰and ~58‰at ~200 m depth (σθ= 26.3) with decreasing concentration. These are the highest values reported to date for marine environments (Figures 4c–4f ).
NO2, produced as an intermediate during NO3reduction, accumulated to up to ~11μmol L1at 200 to 250 m depth near the core of the eddy (Figures 5a and 5b).δ15N-NO2increased to up to ~53‰(60 m depth, M90) and ~26‰ (75 m depth, M91) where NO3 was completely consumed, consistent with isotopic fractionation during NO2reduction by denitrification and/or anammox. The lowestδ15N-NO2 values (31‰to34‰) were observed deeper, close to the anoxic/oxic transition at ~400 m depth (i.e., station 160, M90; station 89/90, M91), and suggest aerobic or anaerobic NO2oxidation, associated with inverse kinetic isotope effects [Casciotti, 2009;Brunner et al., 2013; Figures 5c and 5d]. The δ18O-NO2 remained fairly constant at ~15‰ (Figures 5e and 5f ), similar to the value of +14‰ for abiotic NO2 oxygen isotope exchange with water at in situ temperature reported in Casciotti et al. [2007]. This observation implies a residence time for NO2in the eddy of at least several weeks.
Extreme values for Ndef(equation (1)) of up to ~44μmol L1was also observed near the core of the eddy at
~50 m depth (Figures 6a and 6b). Biogenic N2-N, which is simply [N2]biogenic(see section 2.4.2) multiplied by 2 to facilitate direct comparison with Ndef, only reached 35μmol L1, but otherwise generally agreed well with Ndef, within analytical errors, as inChang et al.[2010, 2012] (Figures 6c and 6d).δ15N-N2 biogenic(equation (7)) ranged from 13.3‰ to 4.6‰ when considering [N2]biogenic≥2 μmol L1 (our mean propagated analytical error; Figures 6e and 6f ) and increased with decreasing [NO3], following isotopic fractionation Figure 4.(a, b) [NO3], (c, d)δ15N-NO3, and (e, f )δ18O-NO3for transects made during the M90 (Figures 4a, 4c, and 4e) and M91 (Figures 4b, 4d, and 4f ) cruises (see Figure 1).
during NO3conversion to NO2and N2. The highestδ15N-N2 biogenicvalue (4.6‰) was observed near the core of the eddy at ~80 m depth during the M90 cruise. This high δ15N-N2 biogenicwas consequently associated with complete NO3 consumption, low residual NO2 (~0.6 μmol L1), and the highest δ15N-NO2, and was similar to meanδ15N-NO3(~5‰) in the ocean.
Altabet et al.[2012] interpreted unusually high N-loss at one station in the Peru OMZ as reflecting stimulation by an adjacent eddy. We clearly confirm thisfinding with our more highly resolved observations of intense N-loss and associated isotopic signals in Eddy A. A chlorophyllαmaximum, most likely transported from the coast, was observed during the M90 cruise at the center of the eddy (up to ~6.1μg L1at ~50 m depth) [Stramma et al., 2013]. It is possible that such transport may be the organic“fuel”for N-loss within the eddy [Altabet et al.,2012].
Different studies have attributed N-loss in OMZs to either anammox, fueled by the breakdown of OM to NH4+ [Kalvelage et al.,2013], or denitrification [Ward et al.,2009]. An increase in the quantity of exported OM has recently been found to significantly enhance N-loss [Babbin et al.,2014]. In this study, we also observed the most intense N-loss signals near the core of the anticyclonic coastal eddy, where uplifting of isopycnals extended the OMZ into shallower and more productive waters transported from the coast with higher OM content [Stramma et al.,2013]. Irrespective of the specific N-loss process at play (i.e., denitrification versus anammox), the large N deficits and extreme isotopic signatures associated with the anticyclonic coastal eddy, coupled with our extensive sampling program, represents an ideal natural tracer experiment to examine, for thefirst time, the environmentalεvalues associated with specific N processing steps (Figure 2) as well as overall net N-loss (15εDIN-lossor15εN2; see sections 3.2.1 and 3.2.3) in this OMZ.
3.2. Comparing Approaches for Evaluatingε
Temperature-salinity plots support a single water mass for low-O2waters in the eddy (Figures 3b and 3d).
Consequently, changes in salinity and temperature for selected isopycnal ranges in Tables 1 and 2 were relatively small, and this simplified hydrography suggests both a single set of initial conditions and little influence from mixing of distinct water masses. This setting is ideal for applying closed system Rayleigh equations for calculatingε. Nevertheless, rapid mixing along isopycnal surfaces may not be reflected in the Figure 5.(a, b) [NO2], (c, d)δ15N-NO2, and (e, f )δ18O-NO2for transects made during the M90 (Figures 5a, 5c, and 5e) and M91 (Figures 5b, 5d, and 5f ) cruises (see Figure 1).
T-S diagram and would result in underestimates of ε using the closed system approach. Alternatively, the Rayleigh open system model mimics the effects of mixing as a mechanism for continual resupply of NO3 [Altabet, 2005; also see section 2.5]. Below, we compare closed and open system approaches for estimatingεusing both source (δ15N-DIN) and product (δ15N-N2 biogenic) versions of these equations as a double check. We also take advantage of eddy’s simple hydrography to test the assumption of Redfield stoichiometry for calculating f by comparison with f based on [N2]biogenic(fredversus fbN2). Last, to consider overall isotope fractionation effects, we calculate apparentε using f values based on NO3removal (f1) and DIN removal (f2) (equations (9) and (11)) in comparison toεbased on the changes inδ15N-N2 biogenic (equations (10) and (12)).
3.2.1. Comparingεfor Closed Versus Open System Models
First we examine the apparentεassociated with the disappearance of NO3(15εNO3- red, Figure 2). Assuming a Rayleigh closed system model, 15εNO3- red significantly increased (p-value<0.05, t-test) from 12‰ for the shallowest potential density range (26.2<σθ≤26.3) to up to 24‰(26.3<σθ≤26.5) and then to up to 31‰ closer to the anoxic/oxic transition zone deeper in the water column (26.5<σθ≤26.8) for the M90 transect (Table 1). No such clear relationship was observed for the M91 transect, although the highest15εNO3- red
(26‰) was also observed for a higher potential density range of 26.5>σθ≤26.7. NO3 assimilation by phytoplankton in the OMZ, with an ε of ~5‰ [Altabet, 2001], could lower theε for shallower potential density range in the ETSP. We still observed lower than expected15εNO3- red, despite only using data points deeper than 100 m (the peak in chlorophyllαbeing at ~50 m depth) to minimize NO3assimilation effects (Table 1). One explanation could be partial suppression of15εNO3- redat low [NO3] within the OMZ as the system approached nearly complete substrate consumption (NO3 and NO2), as suggested by previous studies [Granger et al., 2008; Kritee et al., 2012;Frey et al., 2014]. However, the onset of this asymptotic behavior betweenδ15N-NO3(or DIN) and ln[f] was observed in this study at lower substrate concentrations ([NO3] or ([NO3] + [NO2])<~13μmol L1) as compared to the threshold of ~35μmol L1reported by Kritee et al.[2012] for laboratory experiments. Depressedεat low [NO3] was explained by these authors as Figure 6.(a, b) Ndef, (c, d) biogenic N2-N, and (e, f )δ15N-N2 biogenicfor transects made during the M90 (Figures 6a, 6c, and 6e) and M91 (Figures 6b, 6d, and 6f ) cruises (see Figure 1). For Figures 6e and 6f, only samples with [O2]<10μmol L1and biogenic N2-N≥4μmol L1(equivalent to the size of the propagated analytical error on our measurements) are shown.
a decrease in NO3efflux into the microbial periplasm relative to the fraction of gross NO3uptake into the cell where it is reduced to NO2by the membrane-bound NO3reductase (Nar).Narhas been identified as being responsible for the majority of cellular NO3 reduction and is the dominant driver of isotope enrichment during denitrification [Granger et al.,2008]. We thus only considered the linear portion of the relationship ([NO3] or ([NO3] + [NO2])>13μmol L1,σθ>26.3), which represented>80–90% of the data, to estimate the overall15εNO3- redor15εDIN-loss(see below) in the OMZ (Figures 7a and 7b). We estimated a overall15εNO3- redfor Eddy A of ~20‰, with no significant difference between the M90 and M91 transects (Table 1), which is in the lower range of15εNO3- redfrom previous studies (20–30‰) [Brandes et al., 1998;Voss et al.,2001;Granger et al.,2008].
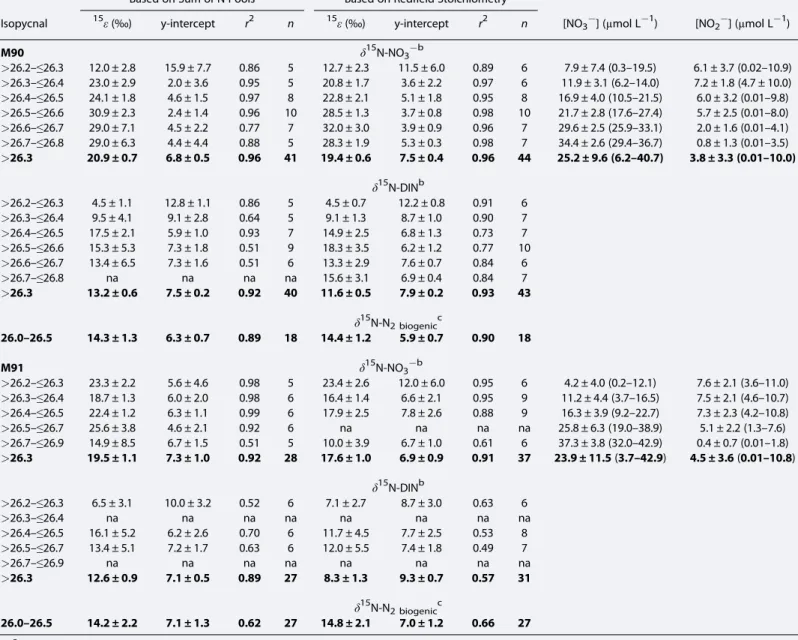
Table 1. Isotope Effects for NO3Reduction (15εNO3red) and Net N-loss Calculated Using Closed System Rayleigh Equations for Both Substrate (NO3and NO2; Equation (9),15εDIN-loss) and Product (Biogenic N2; Equation (10),εbN2). Also Shown Are Average [NO3] and [NO2] (and Their Ranges in Brackets) for Different Isopycnal Ranges During the M90 (November 2012) and M91 (December 2012) Cruisesa
Based on Sum of N Pools Based on Redfield Stoichiometry
Isopycnal 15ε(‰) y-intercept r2 n 15ε(‰) y-intercept r2 n [NO3] (μmol L1) [NO2] (μmol L1)
M90 δ15N-NO3b
>26.2–≤26.3 12.0 ± 2.8 15.9 ± 7.7 0.86 5 12.7 ± 2.3 11.5 ± 6.0 0.89 6 7.9 ± 7.4 (0.3–19.5) 6.1 ± 3.7 (0.02–10.9)
>26.3–≤26.4 23.0 ± 2.9 2.0 ± 3.6 0.95 5 20.8 ± 1.7 3.6 ± 2.2 0.97 6 11.9 ± 3.1 (6.2–14.0) 7.2 ± 1.8 (4.7 ± 10.0)
>26.4–≤26.5 24.1 ± 1.8 4.6 ± 1.5 0.97 8 22.8 ± 2.1 5.1 ± 1.8 0.95 8 16.9 ± 4.0 (10.5–21.5) 6.0 ± 3.2 (0.01–9.8)
>26.5–≤26.6 30.9 ± 2.3 2.4 ± 1.4 0.96 10 28.5 ± 1.3 3.7 ± 0.8 0.98 10 21.7 ± 2.8 (17.6–27.4) 5.7 ± 2.5 (0.01–8.0)
>26.6–≤26.7 29.0 ± 7.1 4.5 ± 2.2 0.77 7 32.0 ± 3.0 3.9 ± 0.9 0.96 7 29.6 ± 2.5 (25.9–33.1) 2.0 ± 1.6 (0.01–4.1)
>26.7–≤26.8 29.0 ± 6.3 4.4 ± 4.4 0.88 5 28.3 ± 1.9 5.3 ± 0.3 0.98 7 34.4 ± 2.6 (29.4–36.7) 0.8 ± 1.3 (0.01–3.5)
>26.3 20.9 ± 0.7 6.8 ± 0.5 0.96 41 19.4 ± 0.6 7.5 ± 0.4 0.96 44 25.2 ± 9.6 (6.2–40.7) 3.8 ± 3.3 (0.01–10.0) δ15N-DINb
>26.2–≤26.3 4.5 ± 1.1 12.8 ± 1.1 0.86 5 4.5 ± 0.7 12.2 ± 0.8 0.91 6
>26.3–≤26.4 9.5 ± 4.1 9.1 ± 2.8 0.64 5 9.1 ± 1.3 8.7 ± 1.0 0.90 7
>26.4–≤26.5 17.5 ± 2.1 5.9 ± 1.0 0.93 7 14.9 ± 2.5 6.8 ± 1.3 0.73 7
>26.5–≤26.6 15.3 ± 5.3 7.3 ± 1.8 0.51 9 18.3 ± 3.5 6.2 ± 1.2 0.77 10
>26.6–≤26.7 13.4 ± 6.5 7.3 ± 1.6 0.51 6 13.3 ± 2.9 7.6 ± 0.7 0.84 6
>26.7–≤26.8 na na na na 15.6 ± 3.1 6.9 ± 0.4 0.84 7
>26.3 13.2 ± 0.6 7.5 ± 0.2 0.92 40 11.6 ± 0.5 7.9 ± 0.2 0.93 43 δ15N-N2 biogenicc
26.0–26.5 14.3 ± 1.3 6.3 ± 0.7 0.89 18 14.4 ± 1.2 5.9 ± 0.7 0.90 18
M91 δ15N-NO3b
>26.2–≤26.3 23.3 ± 2.2 5.6 ± 4.6 0.98 5 23.4 ± 2.6 12.0 ± 6.0 0.95 6 4.2 ± 4.0 (0.2–12.1) 7.6 ± 2.1 (3.6–11.0)
>26.3–≤26.4 18.7 ± 1.3 6.0 ± 2.0 0.98 6 16.4 ± 1.4 6.6 ± 2.1 0.95 9 11.2 ± 4.4 (3.7–16.5) 7.5 ± 2.1 (4.6–10.7)
>26.4–≤26.5 22.4 ± 1.2 6.3 ± 1.1 0.99 6 17.9 ± 2.5 7.8 ± 2.6 0.88 9 16.3 ± 3.9 (9.2–22.7) 7.3 ± 2.3 (4.2–10.8)
>26.5–≤26.7 25.6 ± 3.8 4.6 ± 2.1 0.92 6 na na na na 25.8 ± 6.3 (19.0–38.9) 5.1 ± 2.2 (1.3–7.6)
>26.7–≤26.9 14.9 ± 8.5 6.7 ± 1.5 0.51 5 10.0 ± 3.9 6.7 ± 1.0 0.61 6 37.3 ± 3.8 (32.0–42.9) 0.4 ± 0.7 (0.01–1.8)
>26.3 19.5 ± 1.1 7.3 ± 1.0 0.92 28 17.6 ± 1.0 6.9 ± 0.9 0.91 37 23.9 ± 11.5(3.7–42.9) 4.5 ± 3.6(0.01–10.8) δ15N-DINb
>26.2–≤26.3 6.5 ± 3.1 10.0 ± 3.2 0.52 6 7.1 ± 2.7 8.7 ± 3.0 0.63 6
>26.3–≤26.4 na na na na na na na na
>26.4–≤26.5 16.1 ± 5.2 6.2 ± 2.6 0.70 6 11.7 ± 4.5 7.7 ± 2.5 0.53 8
>26.5–≤26.7 13.4 ± 5.1 7.2 ± 1.7 0.63 6 12.0 ± 5.5 7.4 ± 1.8 0.49 7
>26.7–≤26.9 na na na na na na na na
>26.3 12.6 ± 0.9 7.1 ± 0.5 0.89 27 8.3 ± 1.3 9.3 ± 0.7 0.57 31 δ15N-N2 biogenicc
26.0–26.5 14.2 ± 2.2 7.1 ± 1.3 0.62 27 14.8 ± 2.1 7.0 ± 1.2 0.66 27
aResults from calculations based on the sum of N pools (i.e., substrates (NO3, NO2) and product (biogenic N2) of N-loss processes) or Redfield stoichiometry to calculate Nexpandεare shown. The standard errors of the slope and y-intercept, which respectively representεand the initialδ15N-NO3orδ15N-DIN, are indicated.
Mean values of all isopycnals are shown in bold.
bOnly data with [O2]<10μmol L1and deeper than 100 m were considered.
cOnly data with≥7.5μmol L1biogenic N2were considered.
The unrealistically high15εNO3- red(up to 128‰), as well as the extremely low intercept (down to63‰, which should equal the initialδ15N of the substrate; see equation (11)), calculated for the shallowest potential density ranges suggest the inadequacy of the open system model, especially at low [NO3], in this setting. Overall
15εNO3- redwas twice as high for the open system model (~40‰, for both M90 and M91 transects; Table 2). A higherεfor an open system scenario is expected since NO3with a lowδ15N is assumed to be continuously resupplied; thus,εmust be larger to account for the observed isotopic enrichment.
Using DIN as the basis to calculateε(15εDIN-loss, see Figure 2), while not representative of NO3reduction per se, provides better estimates of overall isotope fractionation for N-loss and is more comparable toεcalculated using δ15N-N2 biogenic. We used f2-bN2or f2-red(equations (14) and (16)) in the Rayleigh equations, andδ15N was calculated from the concentration-weighted averageδ15N-DIN (fromδ15N-NO3andδ15N-NO2values). The overall15εDIN-lossestimated using a closed system model (13‰, Figures 7a and 7b) was also significantly lower Table 2. Isotope Effects for NO3Reduction (15εNO3- red) and Net N Loss Calculated Using Open System Rayleigh Equations for Both Substrate (NO3and NO2; Equation (11),15εDIN-loss) and Product (Biogenic N2; Equation (12), εbN2) During the M90 (November 2012) and M91 (December 2012) Cruisesa
Isopycnal Ranges 15ε y-intercept r2 n
M90
δ15N-NO3b
>26.2–≤26.3 127.9 ± 22.8 62.8 ± 19.5 0.91 5
>26.3–≤26.4 87.9 ± 14.0 30.6 ± 9.6 0.93 5
>26.4–≤26.5 55.8 ± 4.6 6.2 ± 2.5 0.96 8
>26.5–≤26.6 53.8 ± 3.1 3.1 ± 1.4 0.97 10
>26.6–≤26.7 38.2 ± 9.6 3.3 ± 2.6 0.76 7
>26.7–≤26.8 35.7 ± 7.4 3.8 ± 1.4 0.89 5
>26.3 38.8 ± 1.6 3.4 ± 0.7 0.94 41
δ15N-DINb
>26.2–≤26.3 13.3 ± 2.3 9.1 ± 1.5 0.91 5
>26.3–≤26.4 18.4 ± 7.9 6.5 ± 3.8 0.65 5
>26.4–≤26.5 26.7 ± 3.4 4.2 ± 1.3 0.94 7
>26.5–≤26.6 22.7 ± 7.5 6.0 ± 2.2 0.53 10
>26.6–>26.7 22.7 ± 7.3 5.7 ± 1.6 0.71 6
≤26.8 na na na na
>26.3 19.3 ± 0.8 6.7 ± 0.2 0.94 40
δ15N-N2 biogenicc
26.0–26.5 17.3 ± 1.3 4.9 ± 0.5 0.91 18
M91
δ15N-NO3b
>26.2–≤26.3 161.0 ± 32.8 92.6 ± 27.7 0.89 5
>26.3–≤26.4 78.4 ± 13.5 25.5 ± 10.1 0.87 6
>26.4–≤26.5 60.8 ± 3.2 9.0 ± 1.9 0.99 6
>26.5–≤26.7 43.2 ± 6.1 0.8 ± 2.6 0.93 6
>26.7–≤26.9 16.5 ± 10.3 6.7 ± 1.6 0.46 5
>26.3 41.7 ± 2.6 2.8 ± 1.3 0.91 28
δ15N-DINb
>26.1–≤26.3 17.7 ± 8.0 5.4 ± 5.1 0.55 6
>26.3–≤26.4 na na na na
>26.4–≤26.5 27.6 ± 8.1 3.4 ± 3.1 0.74 6
>26.5–≤26.7 17.9 ± 6.6 6.6 ± 1.9 0.65 6
>26.7–≤26.9 na na na na
>26.3 19.1 ± 1.1 6.1 ± 0.4 0.92 27
δ15N-N2 biogenicc
26.0–26.5 15.7 ± 2.5 5.1 ± 1.0 0.78 28
aResults from calculations based on the sum of N pools (i.e. substrates and product of N-loss processes) to calculate Nexpandεare shown. The standard errors of the slope and y-intercept are indicated. Mean values of all isopycnals are shown in bold.
bOnly data with [O2]<10μmol L1and deeper than 100 m were considered.
cOnly data with≥7.5μmol L1biogenic N2were considered.

![Figure 10. (a, b) δ 18 O-NO 3 versus δ 15 N-NO 3 for transects M90 and M91. Linear regressions are shown for [O 2 ] < 10 μ mol L 1](https://thumb-eu.123doks.com/thumbv2/1library_info/5498247.1685517/16.918.258.861.755.1065/figure-δ-versus-transects-linear-regressions-shown-mol.webp)
