Francis G. Castles
The Growth of the Post-war Public Expenditure State:
Long-term Trajectories and Recent Trends
TranState Working Papers No. 35
Sfb597 „Staatlichkeit im Wandel“ − „Transformations of the State“
Bremen, 2006
[ISSN 1861-1176]
Francis G. Castles
The Growth of the Post-war Public Expenditure State: Long-term Trajectories and Recent Trends
(TranState Working Papers, 35)
Bremen: Sfb 597 „Staatlichkeit im Wandel“, 2006 ISSN 1861-1176
Universität Bremen
Sonderforschungsbereich 597 / Collaborative Research Center 597 Staatlichkeit im Wandel / Transformations of the State
Postfach 33 04 40 D - 28334 Bremen Tel.:+ 49 421 218-8720 Fax:+ 49 421 218-8721
Homepage: http://www.staatlichkeit.uni-bremen.de
The Growth of the Post-war Public Expenditure State:
Long-term Trajectories and Recent Trends
A
BSTRACTThis Working Paper has two principal objectives. The first is to describe the main tra- jectories of development of public expenditure aggregates in OECD countries during the period 1960-2001. The second is to provide a more detailed analysis of expenditure trends in these countries in the period since 1980, with a view to establishing the extent and sources of expenditure retrenchment in this latter period. The aggregates examined include total outlays of general government, total social expenditure and the core spend- ing of general government, including expenditures on defence, public order, education, general public services, economic affairs, community services and environmental pro- tection. The headline stories of the general survey of expenditure trajectories include the massive overall expansion of public spending, the declining importance of military ex- penditures and the increased salience of spending on social policy objectives and, most recently, a shift within the latter category from cash benefit spending to spending on service provision. Significant findings of the analysis of trends include the pronounced convergence of aggregate expenditure levels, the role of slow economic growth in pro- moting the measured growth of public expenditure and the continuing importance of the partisan complexion of government in shaping spending patterns. The analysis also suggests that post-1980 retrenchment tendencies were restricted to core spending, were only marginally influenced by developments in the global economy and were driven almost entirely by a conjuncture of high levels of public indebtedness and high real in- terest rates which is unlikely to be repeated in the near future.
C
ONTENTSINTRODUCTION...1
PART ONE:LEVELS AND COMPOSITION OF EXPENDITURE...5
Theories... 5
Trajectories... 13
Outlays ... 13
Social Expenditure ... 17
Core Expenditure... 21
Relativities ... 25
Guns versus Butter ... 25
Social Functions versus Core Functions... 28
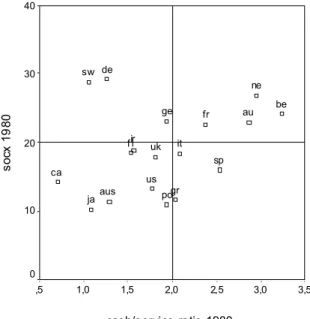
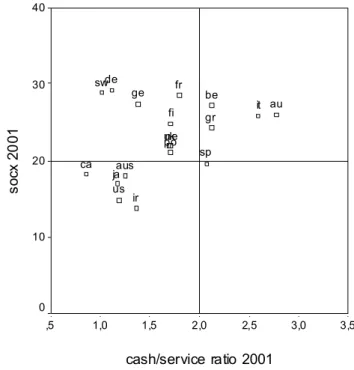
Welfare Transfers versus Welfare Services... 31
PART TWO:EXPENDITURE CHANGES SINCE 1980 ...36
Trends ... 37
Hypotheses... 45
Findings... 52
Conclusions... 62
REFERENCES...64
BIOGRAPHICAL NOTE...69
The Growth of the Post-war Public Expenditure State:
Long-term Trajectories and Recent Trends
I
NTRODUCTIONThis Working Paper has two principal objectives, which serve to structure its presen- tation. In Part One, I seek to describe the main trajectories of post-war public expen- diture development in 18 member countries of the OECD over the period 1960-2001, showing how these developments reflect the influence of a range of factors high- lighted by theories from across the social sciences. This survey of post-war expendi- ture development also seeks to assess how the composition of government spending has been transformed over this period, with the main focus on the rise of the welfare state and how spending for social purposes has come to assume a larger and larger role vis-à-vis other types of expenditure.
In Part Two, I focus on expenditure trends over the period 1980-2001, with a view to testing hypotheses purporting to account for the much reduced rate of growth [and, in some instances and areas, cut-backs] characterising public expenditure develop- ment during the past quarter of a century. These hypotheses inform contemporary debate on public policy development and highlight a range of factors identified as having the potential to modify the expansionary growth trends of the early post-war decades. Prominent among these factors are the supposed impacts of an increasingly internationalised economy, a shift in politics from a social democratic to a neo-liberal hegemony, the reform imperative supplied by population ageing and the deindustriali- sation of Western labour markets. Other factors located here as important in account- ing for recent trends are increased deficit spending, programme convergence and de- clining rates of economic growth.
In the analysis that follows, I use data for the big aggregates of public spending – the total of what governments spend on all their programmes, what they spend on welfare objectives and what they spend on their core tasks - as a means of comparing the changing role and reach of the modern state in different countries. In order for democratic governments to do many of the things demanded of them by their elector- ates, it is necessary for them to tax and spend. This, in turn, means that aggregates of taxing and spending capture, to some degree at least, the changing size and aspirations of the modern state. Arguably, and the reason that this study focuses on expenditure rather than taxation, expenditure aggregates and shifts in the composition of govern- ment spending are a better guide to aspirations than are taxation totals. What govern- ments spend their money on tells us something about what they are attempting to a- chieve and what their electorates expect of them. How the composition of spending changes tells us something about how such expectations alter over time. This is not
true of taxation. There is no automatic linkage between how taxes are raised and how they are disbursed.
Although expenditure is important, it provides only a ‘rough guide’. That is for, at least, two reasons. First, governments can sometimes achieve their objectives by means other than taxing and spending, with regulation in some instances a favoured alternative. Moreover, certain countries have systematic preferences for intervening in ways that do not involve the use of public monies. The quite pronounced tendency demonstrated throughout this study for English-speaking countries to manifest lower social spending levels than other groupings of nations is, at least, in some part, attrib- utable to such preferences. It is perfectly sensible to interpret such large-scale and consistent differences in spending as strong evidence of a diversity of national strate- gies of policy intervention, but wrong to assume that governments that spend less in a given policy area are necessarily less committed to shaping policy outcomes in that area. A possible usage indicative of this distinction might be to describe the English- speaking countries as favouring less ‘statist’, but not always less interventionist, so- cial policies than the majority of other Western nations.
A second reason for seeing spending patterns as only a rough guide is that cross- national expenditure measures are rarely reliable enough to allow fine-grained com- parison. When reported differences in cross-national aggregate spending levels or in single-country expenditure levels over time amount to just a few points of GDP, the sensible default option is to assume an absence of significant difference or of signifi- cant change. The reliability of public expenditure data for earlier periods has some- times been adversely affected by the fact that governments contributing spending data to international agencies like the United Nations, the OECD, Eurostat and the IMF have taken time to conform fully to the accounting conventions used by these agen- cies to ensure cross-national comparability. The possibility of reliable comparison across decades is also strongly affected by the changing expenditure definitions used by such agencies and by the diverse design of expenditure programmes in different countries. What is counted as unemployment insurance expenditure in one country may well be counted as disability spending in another. What is counted as public ex- penditure at one point in time may subsequently be defined as private spending and vice versa.
Such measurement difficulties mean that any discussion of long-term trajectories needs to focus on the more substantial differences among countries and on changing averages of groups of countries rather than on minor differences between individual nations that are quite possibly a consequence of measurement error. In this Working Paper, I offer a broad-brush account of cross-national differences in aggregate expen- diture levels for the years 1960, 1970, 1980, 1990 and 2001, but only provide a de-
tailed statistical analysis of changes from 1980 onwards. This is because it is only from 1980 onwards that the data are sufficiently reliable to attempt a modelling of the factors associated with aggregate expenditure trends. Even then, it is important to be circumspect in interpreting the findings of such models. In Part Two, I take pains to identify where conclusions concerning the determinants of expenditure variation are dependent on the inclusion of particular countries in the analysis and report alterna- tive and more robust specifications of the findings where this is the case.
The three main aggregates of public expenditure analysed in this Working Paper are total outlays of general government as reported in successive editions of OECD Economic Outlook, total public social expenditure as reported in various OECD publications culminating in what is now the OECD Social Expenditure Database [SOCX] and what I here describe as the core expenditure of general government, which is a residual obtained by subtracting total social expenditure from total outlays.
Total outlays and total social expenditure denote familiar concepts: the overall size or reach of the state as captured by the overall extent of public spending and that part of state expenditure devoted to social protection or welfare state functions, which the OECD has most recently defined as covering the categories of spending on old age, survivors, incapacity related spending, health, family, active labour market pro- grammes, unemployment, housing and other social policy areas (see OECD, 2004a).
Growth in the total outlays of general government [often simply referred to as pub- lic expenditure] has been an important focus of the study of public finance for more than a century, while analysis of the factors shaping social spending has been a key testing ground for rival socio-economic and political accounts of public policy forma- tion over the past three or four decades. By contrast, the concept of core expenditure is a new one introduced in this Working Paper for the first time, with the descriptor
‘core’ warranted by the fact that, leaving aside social spending [the aggregate of health and social protection programmes]1, the significant expenditure programmes remaining are either integral to the state’s role as the agency of legitimate power or pivotal to its continuing economic viability. The distinction between social and core expenditure is essentially a functional one, distinguishing between programmes which serve the needs of individual citizens and those required for the maintenance of the state as such.
The further distinction between legitimacy preserving and economy maintaining programmes is also functional. The first set of programmes includes the traditional
‘night watchman’ functions of the state: spending on general public services, on de-
1 The ten expenditure categories italicised in this and the following paragraph are those featuring as top-level
fence and on the maintenance of public order and safety, together with the spending required to service the public debt and hence maintain the nation’s economic integ- rity. The second set of programmes includes spending on economic affairs and physi- cal infrastructure as well as on human capital building through education and training.
Because, for reasons that will be explained subsequently [see pages 21-25 below], core expenditure is calculated as a residual, it also includes spending on other pro- grammes, including housing and community amenities, environmental protection [perhaps, in this era of global warming, a component of the core in any case] and rec- reation, culture and religion. As compared to the night watchman and economic func- tions of the state, these programmes involve only relatively modest spending, and their inclusion only marginally derogates from the notion of spending vital to the maintenance of the core activities of the state.
The findings reported here are based on an analysis of 18 OECD countries over the period 1960-2001. The countries in alphabetical order are Australia, Austria, Bel- gium, Canada, Denmark, Finland, France, Germany, Greece, Ireland, Italy, Japan, the Netherlands, Portugal, Spain, Sweden, the United Kingdom and the United States. I would also have liked to include data for New Zealand, Norway and Switzerland, countries frequently compared in studies of OECD policy development. However, data for the total outlays of general government were missing for both New Zealand and Switzerland for much of the period under analysis here. In the Norwegian case, data on all relevant expenditure aggregates were available. However, because Nor- way’s substantial overseas investment of North Sea Oil revenues effectively reduces measured domestic public expenditure levels compared to those of other countries, these data have become increasingly misleading in recent decades, making it neces- sary to exclude Norway from the analysis.
Finally, the reader is advised that a key narrative device of the description of ex- penditure trajectories and trends in this study is a contrast between groups or ‘fami- lies’ of nations, defined loosely as countries characterised by common historical, cul- tural and linguistic affinities (see Castles, 1993 and 1998). The families featuring here – and clearly identified in tables in the text below – are an English-speaking grouping of nations [Australia, Canada, Ireland, the UK and the USA], a Scandinavian group- ing [Denmark, Finland and Sweden], a continental Western European grouping [Aus- tria, Belgium, France, Germany and the Netherlands] and a Southern European group- ing [Greece, Italy, Portugal and Spain]. Data for Japan are also analysed, but that country is not included as part of any wider family of nations grouping. The family of nations concept is a useful scoping device for cross-national analysis, permitting us to identify similarities and differences in patterns of policy development amongst coun- tries and to locate potential explanatory factors associated with such patterns.
P
ARTO
NE: L
EVELS ANDC
OMPOSITION OFE
XPENDITURETheories
As the tables in the next section make abundantly clear, the period of 1960-2001 was one of spectacular public expenditure growth. Over these four decades, average total outlays of general government in the 18 OECD countries analysed here went up from 26.9 to 45.6 per cent of GDP, an increase of very nearly 70 per cent [see Table 1].
The main contributor to this development was a more than doubling of social spend- ing from 10.6 to 22.7 per cent of GDP [see Table 2]. By contrast, although core spending grew significantly, the pace of change was less hectic: from 18.0 per cent of GDP in 1960 to 22.9 per cent in 2001, an increase of just over a quarter [see Table 3].
Expenditure growth was also differentially distributed across time. Much the larger part of the expenditure increase occurred in the initial decades of the period, some- times described as the ‘golden age’ of Western capitalism (Maddison, 1991) and of the welfare state in particular (Esping-Andersen, 1996). Since 1980, overall spending has marked time, disguising a continuing, if much slower, rate of social expenditure growth and a standstill, or even, perhaps, the beginnings of a general decline, in core spending. Commentators seeking to understand the nature of this temporal disjuncture and to capture the distinguishing characteristics of the recent expenditure slowdown have talked variously of “a new era of austerity” (Pierson, 2001) or of a “silver age of the welfare state” (Taylor-Gooby, 2002).
With a lag of something like ten years, a similar temporal disjuncture can be iden- tified in scholarly commentary on the factors shaping expenditure development. For much of the post-war period, debate was almost entirely about the causes of expendi- ture growth, with economists focusing on the forces promoting increased state spend- ing in general and sociologists and political scientists on those shaping the extraordi- nary expansion of the welfare state. By the early 1990s, however, the focus of public expenditure and welfare state scholarship had altered, with the bulk of attention now devoted to factors seen as capable of reversing the previous dynamic of expenditure development. I begin my Part I survey of overall expenditure trajectories by referring to theories from across a range of disciplines to generate a checklist of factors likely to have influenced post-war expenditure growth. The aim of Part Two is to model post-1980 expenditure change, and I leave discussion of specific hypotheses seeking to account for the expenditure dynamics of the ‘silver age’ until that point in the ana- lysis.
Given the magnitude of public spending by the end of the 20th Century and its steep growth trajectory in the immediate post-war decades, it is scarcely surprising that the causes of this phenomenon have attracted so much theoretical attention from across the social sciences. Social historians have been interested in what has been an
epochal shift in the reach of the modern state, economists in the emergence of an in- creasingly larger public realm in the context of a capitalist mechanism supposedly driven exclusively by private interest, sociologists and social policy scholars in the state’s assumption of responsibility for alleviating the needs of its citizens and extend- ing the realm of social rights and political scientists in the way in which political de- mands and institutions have shaped the expansion of the public sector. Moreover, within each of the disciplines, competing analytical perspectives and subject special- isms have been concerned to demonstrate their relevance to understanding one of the great transformations of the modern era. Nor has theory development been able to stand still. The pace of expenditure development has altered over time, as have the countries in which spending has been greatest and least. Old theories have had to be rejected or modified because they no longer fitted the facts and new ones have emer- ged because there were new facts to fit.
All of this has meant a vast proliferation of theories of public expenditure and wel- fare state growth, with the main emphasis on the latter, because that was where growth was greatest. An early elaboration of explanations in the field identifies nine modes of explanation and no less than 25 specific hypotheses of public sector growth (see Tarshys, 1975). A much later survey of the ‘causes of big government’, focussing particularly on factors influencing the growth of the welfare state, locates 21 hypothe- ses, many quite different from those featuring in the earlier account (see Castles, 1998). If these theories were used in different combinations to account for different policy outcomes at different times, this proliferation might be seen as evidence of the progress of the disciplines seeking to understand public policy development. In real- ity, though, much theorising has taken the form of rival hypotheses purporting to lo- cate the main engine of public expenditure growth or of the post-war expansion of the welfare state. In other words, theory development has been competitive rather than complementary, often representing attempts to assert the primacy of particular social science perspectives rather than to combine those perspectives in a more cumulative and comprehensive account of public expenditure development.
Interestingly, the competitive thrust of this literature is in stark contrast to the ap- proach of the founding father of public expenditure research, Adolf Wagner, whose
‘law of increasing expansion of public, and particularly state, activities’ provides the first scholarly rationale for the ineluctable growth of government in the modern era.
Although ‘Wagner’s Law’ is generally seen as a contribution to economic reasoning, his analysis makes reference to a wide range of factors today regarded as the province of other distinct disciplines. He suggests, contrary to the thrust of much of the later literature, that political decentralisation enhances demands for spending, notes how
“the desire for development of a progressive people” will “always overcome” the de-
mands of financial stringency and points to the role of industrialization and urbanisa- tion in producing needs to which the state is forced to respond (Wagner, 1883, 8).
Trying to comprehend the growing role of government in 19th Century Western Euro- pe and, in particular, late 19th Century Germany, Wagner felt it necessary to supple- ment economic analysis with insights concerning the role of institutions, political de- mands and the evolution of social needs. In this attempt to survey the main trajecto- ries of public expenditure development in the latter half of the 20th Century, a similar complementary approach seems appropriate. Thus, in what follows, I do not discuss the claims and counterclaims of particular theories and specific hypotheses, but rather seek to highlight the kinds of factors together likely to have influenced overall spend- ing trajectories in the post-war era. Given that the big aggregates of spending that are under review here involve an historical accretion of myriad choices of how and whether to spend public monies in areas as diverse as defence, economic affairs, so- cial policy and the environment, the notion that trajectories of expenditure are likely to have been predominantly shaped by any one factor operating in an invariant fash- ion over a period of many decades seems improbable in the extreme.
The kinds of factors listed below have strong disciplinary resonances, but should not be regarded as the exclusive preserve of any one of them. At least as far as ex- plaining the growth of public expenditure is concerned, the contention here is that all have a potential bearing on trajectories of development over the past half century: that the study of public finance is intrinsically an area of interdisciplinary enquiry.
¾ Inertial Forces. This factor highlights the historical context and conjunctural character of policy development. Often the simplest explanation of the fact that expenditure is high or low is that it has been has been high or low for a long while, and often the proper explanation of why a programme takes the shape it does is that this was a shape favoured by the context in which the policy was adopted or was consciously chosen by those adopting the policy in the first instance. Explanations of the former type point to the fact that ex- penditure programmes rarely emerge fully-fledged, but rather tend to grow gradually from small beginnings, with coverage, generosity and range of ser- vices extended in stages and building incrementally on what has gone before.
This is an argument featuring prominently in one of the earliest modelling exercises in the area, with findings demonstrating that the age of a country’s social security system is the strongest predictor of its subsequent level of so- cial expenditure (Aaron, 1967). Explanations of the latter type have become increasingly familiar as arguments that policy development is ‘path depend- ent’, with outcomes often determined by choices made at ‘critical junctures’
in decades or centuries gone by (see Pierson, 2000). The logic here is one of
‘policy pre-emption’: of existing policies having an in-built and often in- creasing advantage against alternative policy options, which can usually be seen off with the claim that they are not the accustomed or ‘proper’ ways of doing things. Arguments from inertia usually imply that what is, will con- tinue to be so, but this need not always be the case. Combined with a notion of programme maturity or ‘growth to limits’ (Flora, 1986, xxiii), an inertial spending trajectory implies eventual ‘catch-up’ by late programme adopters.
The possibility that such catch-up processes can explain public expenditure trends over recent decades will be explored in some detail in Part Two.
¾ Resource Availability. Stated formally, Wagner’s Law points to a link be- tween rising real income and an increase in the size of the public sector rela- tive to the private sector (Larkey et al, 1981). The argument that economic resource availability is a prerequisite for public expenditure growth has also been an axiom of moderate Social Democratic thinking since, at least, the early 1960s (see Crosland, 1963) and similarly underlies the contemporary claims of Third Way politicians that further expansion of public services is dependent on high rates of economic growth (see Giddens, 1998). Yet, on re- flection, these are accounts, which are more persuasive in explaining differ- ences in rates of expenditure development over time than differences amongst nations. Certainly, there are particular instances and periods in which the rapid economic growth has been a stimulus to expenditure devel- opment and others when declining growth has been a disincentive to pro- gramme development, with the immediate post-war ‘golden age’ of welfare capitalism, arguably, an instance of the former and the post-oil shock era of the 1980s an instance of the latter. Nevertheless, the normal logic of the rela- tionship as manifested in cross-national comparison is quite different, with relatively higher rates of economic growth permitting the satisfaction of a given level of demand for services with a lower proportion of national in- come (see Wildavsky, 1975 for an early formulation of this argument). This is, moreover, a logic hard-wired into the methodology of comparative ex- penditure research, which measures national spending levels as percentages of GDP, a procedure automatically inflating the income denominator at the expense of the spending numerator the higher is the rate of economic growth.
The expectation, therefore, is that the relationship between resource avail- ability and spending will be negative rather than positive. Contrary to Wag- ner’s Law, it would appear that a significant reason why Sweden has been in the public spending vanguard for much of the post-war era has been that country’s relatively weak economic growth performance, and that, by the
same token, Japan’s status as an expenditure laggard owes much to economic growth rates far higher than elsewhere in the OECD.
¾ Fiscal Feasibility. The notion that the expansion of government may be con- strained by the availability of resources can be seen not only as a question of a society’s affluence and rate of economic growth, but also as one of the availability of the fiscal means to pursue favoured expenditure plans. The no- tion of a ‘tolerable burden of taxation’ and the circumstances under which citizens may change their perceptions of what is tolerable is at the core of Peacock and Wiseman’s (1961) research on the ‘displacement effect’, which they saw as accounting for the growth of public expenditure in the United Kingdom after World War Two. In this interpretation, the vital requirement of devoting greater resources to national defence under wartime circum- stances displaces existing perceptions of what is a tolerable fiscal burden, al- lowing governments to expand peacetime spending when hostilities have ceased. How well this hypothesis actually accounts for post-war expenditure development is doubtful (see Henrekson, 1993), but the notion of a supply- side restraint on spending provided by an evolving conception of tolerable taxation levels is extremely interesting in light of debates in the 1970s and 1980s on whether, in a period of economic crisis, Western welfare states could any longer finance ‘golden age’ expenditure levels (see OECD, 1981).
A feature of this period was the choice of some OECD governments to side- step any fiscal barriers by extensive resort to debt financing. An important question in Part Two is whether that strategy had adverse effects on subse- quent expenditure development.
¾ Need. Central to Wagner’s identification of the processes of industrialization and urbanisation as stimuli to public sector growth was the insight that major structural changes in society and the economy could lead to social disloca- tion giving rise to ameliorative action by the state. This view of the ulti- mately progressive impact of industrialization became the early orthodoxy of research comparing expenditure development in communist and capitalist nations (see Pryor, 1968; Rimlinger, 1971) and levels of welfare state devel- opment in Western nations (Wilensky and Lebeaux, 1958; Cutright, 1965).
Central to the industrialization argument was the concept of need. Structural change alters economic and social relationships, creating advantages for some and diminished circumstances for others. Those finding themselves in need as a consequence of such changes are likely to seek redress through state intervention. Although this is an idea with a long pedigree in commen- tary on economic development (see, for instance, Polanyi, 1957), it was
seized upon by the sociology of the early post-war decades as an explanation of public expenditure growth nicely consistent with its structural-functional account of the modernisation process. To Wilensky (1975), the key source of welfare-related need was demographic change consequent on industrializa- tion and increasing affluence, which, in creating a rising demand for age pen- sions, began to fashion a constituency of support for what was to become the largest and most expansive programme of the welfare state. Although the po- tential expenditure impact of future population ageing remains the headline story of much governmental thinking about the fiscal future of advanced wel- fare states (see, for instance, World Bank, 1994), contemporary theory has tended to decouple the idea of need from the process of industrialization, now, arguably, in reverse in many of the countries of Western welfare capi- talism. The concept, however, retains much of its explanatory thrust, al- though now sometimes morphed into one of ‘risk’ (Taylor-Gooby, 2004;
Bonoli, 2005), featuring implicitly in accounts relating the ebb and flow of welfare spending variously to processes of ‘post-industrialization’ (Esping- Andersen, 1999) and ‘de-industrialization’ (Iversen, 2000), with a new source of structural dislocation identified as the shift from manufacturing to service employment. In these accounts, the catalysts for policy change are the needs of a huge new stratum of female employees and of those dispos- sessed by the rundown of manufacturing employment.
¾ Political Actors. Although the idea of need or risk is important, and al- though it can be readily extended well beyond the realm of social policy spending which has been its natural home, it does not, by itself, provide any- thing like a sufficient account of the sources of public expenditure develop- ment. That is because the existence of a demonstrable need does not translate automatically through to an expressed or effective demand for the use of public monies. This is the insight provided by the scholars - some from soci- ology, but, understandably, most from political science - who, from the late 1970s onwards, insisted that one could not comprehend cross-national pat- terns of expenditure development without realising that ‘politics matters’.
For needs [or, more generally, interests and preferences] to be transformed into spending outcomes, they must be enacted as policy, and that, in the con- text of most Western democracies, involves mobilization by political actors through political institutions. The key actors identified in the literature are political parties, with the partisan strength and ‘power resources’ of the Left (see, from a huge literature, Korpi, 1978; Esping-Andersen, 1990; Schmidt, 1996), the Right (Castles, 1978; Hicks and Swank, 1984; Imbeau, 1988) and
Christian Democracy (Wilensky, 1981; Huber, Ragin and Stephens, 1993;
Van Kersbergen, 1995) variously seen as determining the overall size and shape of spending programmes, with the Left identified as a force promoting redistributive expenditures, Christian Democracy as one encouraging the growth of welfare transfers and the Right generally opposed to the growth of taxing and spending. Analogous in its policy implications to the left partisan hypothesis, but with an emphasis on the role of voters as actors exerting in- dependent pressure though the democratic process, it has also been argued that, by effecting a reduction in the income level of the median voter, the progressive extension of the suffrage has served to encourage the growth of public spending for redistributive purposes (Mueller, 1989). Clearly, this democratic actor hypothesis provides an alternative to the ‘displacement ef- fect’ account [see pp. 9 above] of the impetus to post-war expenditure growth, with the victory of democracy in 1945 serving as the crucial take-off platform for the steeply upward trajectory of spending in the decades thereaf- ter. The high point of the ‘politics matters’ interpretation was probably the mid-1980s to the early 1990s. Since that time, there has been an extremely active debate about whether the perceived slowdown in public sector devel- opment after 1980 has been a consequence of a ‘new politics of the welfare state’ (see Pierson 1996) and whether this means that traditional partisan dif- ferences no longer impact on policy in the same way as previously (see Stephens, Huber and Ray, 1999; Ross, 2000; Green-Pedersen, 2002). This will be a central topic of discussion in Part Two.
¾ Institutional Design. Politics matters not just because the partisan complex- ion of government differs from country to country, but also because institu- tions take different forms in different nations. Two aspects of institutional variation are of particular relevance in seeking to understand the growth of government expenditure programmes. The first is that programmes in differ- ent countries are designed according to different principles with differential potentials for expenditure growth. In education, for instance, programmes of- fering comprehensive access are likely to be more expensive than those of- fering only selective access, while, in the area of social transfers, universal programmes and those based on insurance principles are likely to be more costly than means-tested or exchequer-financed programmes. While national benefits programmes rarely manifest a single, coherent institutional design (see Bolderson and Mabbett, 1995), writers in the ‘power resources’ tradition argue for a linkage between institutional designs and political actors, with governments of the Left favouring universal provision as a means of enhanc-
ing citizen social rights (Korpi, 1989; Esping-Andersen, 1990). The second aspect of institutional variation potentially relevant to expenditure outcomes is differences in the institutional rules by which political demands are trans- formed into authoritative policies. Even where demands are similar and ac- tors are of comparable salience, outcomes may differ because institutions process expenditure demands in different ways. Diverse constitutional and electoral arrangements may make it harder or easier to get legislative ap- proval for new spending programmes. It has been suggested, for instance, that institutions favouring negotiation and consensus lead to higher spending levels and a “kinder, gentler” sort of democracy (see Lijphart, 1999, 275).
However, the longest-standing finding in the literature relating expenditure growth to institutional design is that welfare state spending is inversely re- lated to federalism (see Wilensky, 1975; Cameron, 1978; Castles and McKinlay, 1979), a regularity generally seen as arising from the way in which federalism multiplies veto-points for obstructing new spending pro- posals (Immergut, 1992; Tsebelis, 2002). Recent research employing a
‘qualitative comparative’ methodology has challenged that finding on two counts, arguing that the historically inverse relationship between spending and federalism only applied where the welfare state evolved under democ- ratic auspices [i.e. not in late 19th Century authoritarian Austria and Ger- many], and that, under present circumstances, where governments are press- ing for expenditure retrenchment, federal veto-points can serve as ratchet mechanisms, limiting the speed and extent of expenditure cutbacks (see Ob- inger, Leibfried and, Castles, 2005).
¾ External Influences. An enumeration of the factors shaping public expendi- ture trajectories in terms of historical inertia, resource availability, fiscal fea- sibility, the evolution of needs and their transformation into policies through the political system offers a more or less complete, if somewhat broad-brush, account of potential domestic influences on expenditure development.
Whether such an account is sufficient obviously depends on the extent to which such trajectories are influenced from outside. Three potential avenues of external influence can be identified. First are historical events in which connections with other nations can be located as sources conditioning or transforming subsequent trajectories of development. The historical affinities linking families of nations are one instance of this phenomenon as also is the imputed ‘displacement’ effect of engagement in wartime hostilities. A sec- ond kind of influence is diffusion of ideas from one country to another through a process of policy learning, with the impetus for expenditure
growth supplied by policy innovations bench-tested in other nations. Argua- bly, the Bismarckian institutional design for social insurance was an early in- stance of this phenomenon (Collier and Messick, 1975). Arguably, too, cur- rent initiatives for pension reform across the western world are similar in character (Orenstein, 2003). Finally, and of greatest importance theoretically, has been the notion that public expenditure development is strongly influ- enced by a country’s location in the international economy. In earlier vari- ants of the theory (see Cameron, 1978; Katzenstein, 1985), the hypothesis was that exposure to the international economy made domestic political ac- tors – trade unions and parties of the Left – press for protective measures to defend their constituents against external vulnerability. More recently, the proposition has been recast as an aspect of contemporary globalisation theory to suggest that increased exposure to international trade and to high levels of footloose capital provide incentives to governments to engage in a ‘race to the bottom’ in social spending. Because this is an account with the potential to explain changed trajectories of spending from the 1980s onwards, it has received enormous attention in comparative literature, (see, amongst many others, Garrett, 1998; Huber and Stephens, 2001; Swank, 2002; Rieger and Leibfried, 2003; Castles, 2004), with some recent studies suggesting that the public expenditure effects of openness to the international economy are con- tingent on mediating factors such as the degree of democratic mobilization (Adserà and Boix, 2001) and the partisan composition of government (Stephens, 2005). However, as already noted, total outlays and core expendi- ture have suffered more conspicuous cutbacks than social spending over re- cent decades, and an important task of the analysis in Part Two is to establish whether increased exposure to the international economy accounts for trends in these aggregates better than it does in respect of welfare spending alone.
The theories discussed in this section identify a range of factors that, in various com- binations, help to account for important aspects of post-war public expenditure devel- opment. The next section focuses on the trajectories of growth of the main public spending aggregates, pointing to some of the cross-national evidence on which these theories rest.
Trajectories Outlays
The data appearing overleaf in Table 1 on total outlays of general government as a percentage of GDP are from OECD Economic Outlook (various years) and constitute the only series of expenditure figures reported here providing complete coverage of
all 18 countries featuring in this analysis at each of five time-points between 1960 and 2001. When commentators discuss the size of government, it is generally this aggre- gate that they have in mind.
The headline figure of an average increase in total spending of almost 70 per cent from 26.9 to 45.6 per cent of GDP over four decades [getting on for two per cent growth per annum] has already been noted. However, this overall picture of very sub- stantial growth in the size of government disguises enormous national diversity in initial and final levels of spending and in the pace, timing and direction of change.
There was, in fact, not a single OECD trajectory of expenditure growth during this period, but a wide variety of national trajectories. Here, I discuss changing levels of expenditure over the long-term; in Part Two, I focus on changes occurring from 1980 onwards.
In terms of overall change in the size of government, the two extremes are repre- sented by Ireland and the USA at one end of the spectrum and Denmark at the other.
From 1960 to 2001, the size of the Irish public sector increased from 28.0 of GDP to just 33.5 per cent and US public spending increased from 27.8 per cent to 35.1 per cent of GDP. By contrast, Danish outlays grew from 24.8 per cent of GDP in 1960 to 55.3 per cent in 2001. Ireland and the USA started out as average spenders and ended up as conspicuous laggards with the two smallest public sectors in the OECD. Den- mark’s trajectory was the reverse, starting out with below average spending and fin- ishing the period with a public sector second only in size to that of Sweden.
Ireland and the US also feature as the countries in which the pace of change was slowest over four decades, with spending growing by an average of less than one per cent per annum over these years. Here, however, the contrasting countries were not in Northern but in Southern Europe, with Greece and Spain almost tripling spending as a percentage of GDP over the period. Timing also differed. Some countries manifested their ‘great leaps forward’ [increases of as much as ten per cent of GDP in a decade]
in the 1960s [Denmark, Ireland, the Netherlands and Sweden], others [plus two Scan- dinavian repeat performers] in the 1970s [Belgium, Denmark, Germany, Japan, Por- tugal, Spain and Sweden] and others still in the 1980s [Greece and Italy]. None of the countries featuring in this analysis experienced their greatest expenditure increases in the 1990s, but two – Ireland and the Netherlands - experienced cutbacks in this period of a magnitude almost comparable to their earlier expenditure spurts.
In terms of directions of change, the Irish case is again instructive, although this time in marked contrast to the American experience. As already noted, Ireland’s ex- penditure growth over four decades was extremely modest. However, Ireland ac- quired its 2001 status as a country of exceptionally small government by a route quite different to that of the USA. Of the 18 countries analysed here, the USA was the only
Table 1: Post-war Public Expenditure Development [Total Outlays of General Government as a Percentage of GDP in 18 OECD Countries, 1960-2001]
1960 1970 1980 1990 2001 Australia
Canada Ireland
United Kingdom United States
Family Mean Denmark
Finland Sweden
Family Mean Austria
Belgium France Germany Netherlands
Family Mean Greece1
Italy Portugal Spain
Family Mean Japan
--- Summary Statistics:
Overall Mean
Coefficient of Variation Correlation with 1960
22.1 28.9 28.0 32.6 27.8 27.9 24.8 26.7 31.1 27.5 32.1 30.3 34.6 32.0 33.7 32.5 17.4 30.1 17.0 13.7 19.6 20.7
26.9 23.3
25.5 35.7 39.6 39.3 32.2 34.5 40.2 31.3 43.7 38.4 39.2 36.5 38.9 37.6 45.5 39.5 22.4 34.2 21.6 22.2 25.1 19.3
33.6 24.0 .88
31.4 38.8 49.3 43.0 31.4 38.8 56.2 38.1 60.1 51.5 48.1 58.3 46.1 47.9 55.8 51.2 30.4 41.9 34.4 32.2 34.7 32.0
43.1 23.5 .66
35.0 46.0 41.2 39.9 32.8 39.0 58.6 45.3 59.1 54.3 48.6 55.0 49.8 45.1 54.1 50.5 48.3 53.2 41.8 42.0 46.3 31.3
46.0 18.0 .39
37.2 41.8 33.5 41.0 35.1 37.7 55.3 49.1 57.0 53.8 50.9 49.3 52.5 48.3 46.7 32.5 50.2 48.7 46.3 39.6 46.2 37.7
45.6 15.3 .29 Sources and Notes: All data from OECD, Economic Outlook (various dates). Data for 1960 and 1970 from Vol- ume 32, data for 1980 and 1990 from Volume 59 and data for 2001 from Volume 74. Data from 1960 to 1990 inclusive are based on the SNA68 system of national accounts and data for 2001 on SNA93. At the present time, and probably into the future, it is impossible to obtain a consistent SNA93 based series from before 1990. 1The Greek figures for 1960 and 1970 are for current disbursements of general government rather than total outlays and, therefore, somewhat underestimate total spending as compared with the other countries featuring in the analysis.
Means subject to rounding errors.
country never to experience a decade in which spending increased by as much as five per cent of GDP. Ireland, in contrast, experienced public outlays growth of close on ten per cent of GDP in both the 1960s and 1970s, but then suffered cutbacks of almost comparable magnitude in the 1980s and 1990s. The US expenditure path departed only slightly from the horizontal, while that of Ireland, and, to a lesser extent, the Netherlands, followed what may best be described as a boomerang trajectory, tending to return from whence they came. Ireland, in fact, turns out to be a highly significant case for our later analysis, not just because of its dramatic changes in spending pat- terns over four decades, but also because its exceptional level of exposure to the in-
ternational economy, high rates of deficit spending in the 1970s and 1980s and high rates of economic growth thereafter make it a pivotal instance for several of the most influential theoretical accounts of post-war public sector growth.
An analysis in terms of changing family of nations means provides a stronger sense of how change was patterned and some indication of the kinds of factors influ- encing trajectories of development over time. In 1960, the big state was a largely con- tinental Western European affair, with all the countries in that family of nations hav- ing outlays in excess of 30 per cent of GDP, and only Italy, Sweden and the United Kingdom manifesting spending of a similar order. With the exception of Sweden, these were the OECD countries most centrally involved as combatants in World War Two, a fact giving at least some surface plausibility to Peacock and Wiseman’s ‘dis- placement effect’ hypothesis [see above, page 9]. Interestingly, in light of later devel- opments, in 1960, the average size of the state in the English-speaking family of na- tions was marginally larger than that in Scandinavia, with Southern Europe – bar Italy – well in the rearguard. The position of the poor Southern European countries in the distribution is as might be expected on the basis of Wagner’s Law. The fact that that the affluent overseas English-speaking countries, Australia, Canada and the USA, were not in the public expenditure vanguard at the beginning of the period fits much less well, but might possibly be attributable to the policy impact of federal institu- tional designs played out in a democratic context [see above, page 11].
Over the following decades, family of nations relativities changed radically. Al- ready by 1970, Scandinavia had nearly caught up with continental Western Europe and, from 1980 onwards, constituted the lead, spending group in the OECD area. Af- ter 1980, the big mover was the Southern European grouping, shifting towards the middle of the distribution and leaving a quite significant gap between itself and the English-speaking family of nations, the spending levels of which grew far more slow- ly than other groupings. This temporal sequence fits nicely with the changing empha- sis of the theoretical literature. In the 1970s, when the Scandinavian and continental groupings were roughly on a par in respect of spending levels, sociological ap- proaches emphasised the impact on spending of catering to the needs of an ageing population, a factor clearly contrasting the experience of these families of nations from that of the English-speaking and Southern European families with far more youthful age profiles. From the late 1970s onwards, scholars began emphasising the relevance of the partisan control of government to expenditure outcomes just as the Scandinavian Social Democracies [including Norway, with spending levels akin to those of Denmark and Sweden] began spending more than the immediate post-war continental European leaders. Initially, the case for a ‘politics matters’ account based on the negative impact of parties of the Right was as strong or stronger than one
premised on the ‘power resources’ of the Left, since, in the former case, the big spending Benelux countries could be grouped together with those countries in which a
‘Social Democratic image of society’ had now become hegemonic (see Castles, 1978). An alternative interpretation of the rapid growth of spending in the Benelux countries in the 1960s and 1970s, is that these were exemplar nations of the use of government spending as a shield against trade induced external vulnerability [see above, page 11].
The shift of the Southern European family of nations towards the middle of the dis- tribution clearly fits with notion that recent public expenditure change has been highly convergent in character. The presence of a strong catch-up trend from 1980 onwards is also confirmed by the summary statistics reported in the final rows of Table 1.
While the overall mean of spending was rocketing up during the ‘golden age’, the coefficient of variation remained almost unchanged, but, after 1980, as spending lev- els stabilised, the coefficient of variation declined quite markedly. In 2001, OECD public spending levels are much more similar than they were in 1980. Convergence, however, necessarily implied change in cross-national expenditure relativities. In 1980, the distribution of cases had clear similarities to the universe of public spending variation of two decades earlier [a correlation of .66]. By 2001, that universe of varia- tion had become almost unrecognisable [a correlation of just .29]. We are accustomed to thinking that all the really big developments in public spending took place in the immediate post-war decades. In reality, the decisive transformation of cross-nation patterns of spending occurred later. Whether that delay is a function of historical iner- tia or whether the fact of so great a transformation is a refutation of the impact of such forces is a matter of interpretation.
Social Expenditure
Since total outlays are the sum of total public social expenditure and of expenditure on the core functions of government, many of the regularities noted in the discussion of total outlays in the preceding sub-section apply in some measure to its component elements discussed separately in this sub-section and the next. For instance, since social expenditure provided much of the impetus for total outlays growth throughout the period, cross-national differentials in the timing of the growth of the two aggre- gates are broadly similar [exceptions are Ireland in the 1960s and Japan in the 1970s].
A clear implication is that many of the factors identified as potential determinants of total outlays trajectories are also likely to emerge as factors shaping social expendi- ture development. In what follows, I shall not dwell unduly on patterns and potential determinants located previously. Rather the emphasis in this sub-section and the next
is on pointing up ways in which the long-term trajectories of development of social and core spending differ from those of total outlays and from each other.
Table 2: Post-war Social Expenditure Development [Total Public Social Expendi- ture as a Percentage of GDP in 18 OECD Countries, 1960-2001]
1960 1970 1980 1990 2001
Australia Canada Ireland2
United Kingdom United States
Family Mean Denmark
Finland Sweden
Family Mean Austria2
Belgium1 France2 Germany Netherlands
Family Mean Greece
Italy Portugal Spain
Family Mean Japan
--- Summary Statistics:
Overall Mean
Coefficient of Variation Correlation with 1960
7.4 9.1 8.7 10.2
7.3 8.5 n.a.
8.8 10.8
9.8 15.9 12.7 13.4 18.1 11.7 14.4 7.1 13.1
n.a.
n.a.
10.1 4.1
10.6 34.8
7.4 11.8 11.9 13.2 10.4 10.9 19.1 13.6 16.8 16.5 18.9 19.3 16.7 19.5 22.4 19.4 9.0 16.9
n.a.
n.a.
13.0 5.7
14.5 33.6 .86
11.3 14.3 19.0 17.9 13.3 15.2 29.1 18.5 28.8 25.5 22.9 24.1 22.6 23.0 26.9 23.9 11.5 18.4 10.9 15.9 14.2 10.2
18.8 33.0 .72
14.2 18.6 18.6 19.5 13.4 16.9 29.3 24.8 30.8 28.3 24.1 26.9 26.8 22.8 27.6 25.6 20.9 24.8 13.9 19.5 19.8 11.2
21.5 27.1 .65
18.0 18.2 13.8 21.8 14.8 17.3 29.2 24.8 28.9 27.6 26.0 27.2 28.5 27.4 21.8 26.2 24.3 25.8 21.1 19.6 22.7 16.9
22.7 21.8 .69 Sources and Notes: Data for 1960 and 1970 are for total social protection as a percentage of GDP as reported in OECD (1994). Data for 1980, 1990 and 2001 are for total social expenditure as a percentage of GDP as reported in OECD (2004a). 1Data for Belgium in 1960 is for government expenditure on subsidies and transfers and is from Tanzi and Schuknecht (2000), 31. 21980 unemployment cash benefits for Austria, Belgium and Ireland interpo- lated from OECD (1985). Although pre- and post-1980 figures come from the same evolving OECD social expen- diture database, figures from 1980 onwards may be regarded as somewhat more reliable for comparative purposes.
Means subject to rounding errors.
The data on total public social expenditure appearing in Table 2 come from an evolv- ing OECD dataset on social spending, which first reported reasonably complete fig- ures on expenditure on public income maintenance programmes in the mid-1970s (OECD, 1976). The figures reported here for years prior to 1980 come from a mid- 1990s source (OECD, 1994), which was later to become the basis for the OECD So- cial Expenditure Database [SOCX], from which our data from 1980 onwards are drawn (OECD, 2004a). In Table 2, pre-1980 data for Portugal and Spain are missing,
as also are data for Denmark in 1960. The OECD source from which these pre-1980 data come, in some instances, reports expenditure totals excluding spending on unem- ployment benefits and this missing data has been interpolated from other sources. The OECD does not regard its own pre- and post-1980 figures as fully comparable. This is an important reason why the statistical analysis of expenditure change in Part Two of the Working Paper focuses exclusively on trends in the period commencing in 1980.
As has already been pointed out, average levels of social expenditure more than doubled between 1960 and 2001, while core spending increased far more slowly.
Two-thirds of total outlays growth in the period was constituted by social expenditure.
This clearly signified a major shift in the post-war functions of government. In 1960, welfare provision was a subsidiary task of modern government; today, such provision is equivalent to all the other functions of government combined. This change, which has attracted far less scholarly attention than it deserves, is of the greatest possible significance, both substantively and theoretically, and provides a major analytical focus for the remainder of this Working Paper.
Diverse national trajectories of expenditure development are no less apparent in re- spect of social expenditure than of total outlays. Ireland was once again the most ex- treme laggard in terms of overall expenditure growth measured as a percentage of GDP and, again, its boomerang-shaped trajectory of development contrasted radically with the consistently modest growth pattern of the USA. In the case of total outlays, the leading country in GDP growth terms was Denmark, although, in 2001, Sweden’s spending level was higher. The picture is apparently reversed in respect of social spending. Over the period as whole, Sweden experienced the greatest expenditure growth, with resources devoted to social purposes tripling in size from 10.8 per cent of GDP in 1960 to over 30 per cent in 1990. However, it was Denmark, which had marginally the highest level of welfare spending by 2001, and lacking data for that country’s 1960 spending level, we cannot actually be certain that it post-war growth was any less dramatic than Sweden’s. Together with Norway, these countries’ expen- diture growth profiles constitute a significant element in the Nordic area’s post-1970s reputation as the homeland of a distinctive and superior model of social policy provi- sion (Esping-Andersen, 1990; Kautto, 1999). That these three nations were simulta- neously the OECD countries with much the longest and strongest records of democ- ratic socialist political incumbency provides much of intellectual rationale for an in- terpretation of post-war social expenditure growth as primarily a function of Left par- tisan control of government.
They were not, however, the countries, which experienced the fastest expenditure growth in percentage terms. Between 1960 and 2001, Japanese social spending as a percentage of GDP increased fourfold and that of Greece [and, quite probably, Portu-
gal and Spain] by only a somewhat smaller margin. Japan is frequently singled out as a continuous and conspicuous post-war welfare state laggard, but by this criterion of measurement, and even more so in terms of the rate of increase in real spending on social policy programmes, Japan has actually been the country with much the fastest post-war welfare spending growth in the OECD. This is simultaneously an illustration of how much comparison depends on the type of measure employed and of the nega- tive impact of economic growth on expenditure development measured in the conven- tional manner as a percentage of GDP. Japan is an extreme instance of why Wagner’s Law does not work in cross-national comparison. If Japan had experienced the same post-war expenditure growth in real terms as it manifested in the period 1960 to 2001, but an economic growth rate equivalent to the OECD average over these four dec- ades, Japan would now be amongst the OECD social spending vanguard.
A family of nations focus reveals important differences between the total outlays and total public social expenditure distributions. In 1960, both the English-speaking and Scandinavian total outlays levels were somewhat above the overall mean, but somewhat below the mean in respect of levels of social spending. By contrast, the continental Western European grouping was well above the mean for total outlays and still further above in respect of social expenditure. In other words, family differences had a rather different character in respect of the two aggregates and were rather more pronounced in respect of social spending. Admittedly, these differences in means are partly a function of missing cases, but, nevertheless, they underline the key point that, at the beginning of the period, the big states of continental Western Europe were big almost entirely because of their massive commitment to social spending. Leading the way were Germany and Austria, countries whose exceptionally high spending could be seen as a function of their early social policy innovation, with the region’s overall expenditure leadership arguably a product of the diffusion of the Bismarckian social insurance model. Thus, even as early as 1960, it is reasonable to talk of the ‘social states’ of continental Western Europe and of the emergence of a distinctive ‘European social model’. In ensuing decades, the other European families of nations either out- matched continental Western European expenditure growth [the countries of Scandi- navia] or kept pace with it [the countries of Southern Europe], leaving an increasingly wider gap between all these groupings and the English-speaking countries other than the UK itself, which remains at least within shouting distance of the average OECD social expenditure level.
Summary statistics confirm these impressions. The more pronounced differences in levels of social than of total outlays spending show up in a coefficient of variation for social expenditure that starts out much higher than that for outlays and continues so until around 1980, before declining quite rapidly over recent decades. Clearly, the
OECD social expenditure distribution has converged over time, but not in such a way as to make the immediate post-war distribution unrecognisable, as in the case of out- lays. As late as 2001, the correlation with initial social spending levels was as high as .69, a finding, which, for the 15 countries to which it applies, means that about half of the variation visible in 1960 is preserved to the present day, arguably suggesting that the role of path dependency may be greater for social spending than for public expen- diture as a whole.
Core Expenditure
The core spending series reported in Table 3 overleaf is different in character from the series reported previously in that it is a residual obtained by subtracting total social expenditure from total outlays. This procedure is necessary if we are to get any coher- ent idea of the overall development of spending in areas other than of social expendi- ture. This is because, despite a long-term commitment to collecting functional public expenditure data and an evolving internationally standardised classification of such functions [COFOG], international agencies such as the OECD, the IMF and Eurostat, have either not been supplied with the necessary information by member nations [with blank returns for the majority of countries in OECD National Accounts], or have been supplied with information which does not allow cross-national comparison of these categories of spending [data reported in IMF Finance Statistics has only rare- ly been consolidated across levels of government]. Eurostat and the OECD (see OECD, 2004c) now report COFOG data for member nations from 1990 onwards, but, while that will be invaluable for future research in this area, it does not allow us to say anything significant about expenditure development in the period under analysis here.
Admittedly, there are longer series relating to particular categories of government spending: defence expenditures reported by the Stockholm Peace Research Institute [SIPRI], education spending by both the OECD and UNESCO and debt interest pay- ments routinely reported in OECD Economic Outlook. However, because data for important functional categories of spending, including public services, public order, and economic affairs, are missing for many or most countries, no even faintly accu- rate long-term series can be constructed by aggregating what is known about these functional categories of spending. Going down the residual route is an indirect way of obtaining some intellectual purchase on what has been happening to those aspects of spending unrelated to health and social protection. Obviously, earlier warnings relat- ing to over interpretation of small differences between countries and over time should be kept in mind [see page 3 above], but, essentially, there is no more reason to suspect the series reported here of being flawed than the earlier series from which it has been constructed and which have routinely been the subject of cross-national research.
![Table 1: Post-war Public Expenditure Development [Total Outlays of General Government as a Percentage of GDP in 18 OECD Countries, 1960-2001]](https://thumb-eu.123doks.com/thumbv2/1library_info/4973782.1642189/21.892.129.752.166.731/public-expenditure-development-outlays-general-government-percentage-countries.webp)
![Table 2: Post-war Social Expenditure Development [Total Public Social Expendi- Expendi-ture as a Percentage of GDP in 18 OECD Countries, 1960-2001]](https://thumb-eu.123doks.com/thumbv2/1library_info/4973782.1642189/24.892.132.762.207.777/social-expenditure-development-public-expendi-expendi-percentage-countries.webp)
![Table 3: Post-war Expenditure on Core Functions of Government [Total Non- Non-social Expenditure as a Percentage of GDP in 18 OECD Countries, 1960-2001] 1960 1970 1980 1990 2001 Australia Canada Ireland United Kingdom United States Family Mean](https://thumb-eu.123doks.com/thumbv2/1library_info/4973782.1642189/29.892.133.757.199.754/expenditure-functions-government-expenditure-percentage-countries-australia-ireland.webp)
![Table 4: Guns versus Butter [Ratio of Military Expenditure as a Percentage of GDP to Total Social Expenditure as a Percentage of GDP]](https://thumb-eu.123doks.com/thumbv2/1library_info/4973782.1642189/33.892.127.760.332.914/table-butter-military-expenditure-percentage-social-expenditure-percentage.webp)
![Table 5: Social Functions versus Core Functions [Ratio of Total Social Expendi- Expendi-ture as a Percentage of GDP to ExpendiExpendi-ture on the Core Functions of Government as a Percentage of GDP] 1960 1970 1980 1990 2001 Australia Canada Irelan](https://thumb-eu.123doks.com/thumbv2/1library_info/4973782.1642189/36.892.132.756.273.834/functions-functions-percentage-expendiexpendi-functions-government-percentage-australia.webp)
![Table 6: Welfare Transfers versus Welfare Services [Ratio of Cash to In-kind [Ser- [Ser-vice] Provision in 18 OECD Countries, 1980-2001]](https://thumb-eu.123doks.com/thumbv2/1library_info/4973782.1642189/38.892.132.753.442.996/table-welfare-transfers-versus-welfare-services-provision-countries.webp)