Negative impacts of realistic doses of spherical and irregular
microplastics emerged late during a 42 weeks-long exposure experiment with blue mussels
Thea Hamm ⁎ , Mark Lenz
GEOMAR Helmholtz Center for Ocean Research Kiel, Germany
H I G H L I G H T S
• Effects of microplastics on Mytilus spp.
were assessed over the course of 42 weeks.
• Effects were seen even at the lowest MP concentration (15 particles/individual/
week).
• At the highest PS dose, clearance rates decreased significantly only after 36 weeks.
• SOD and MDA concentrations declined as a consequence of exposure to microplastics.
G R A P H I C A L A B S T R A C T
a b s t r a c t a r t i c l e i n f o
Article history:
Received 1 December 2020
Received in revised form 19 February 2021 Accepted 20 February 2021
Available online 26 February 2021 Editor: Henner Hollert
Keywords:
Long-term exposure Microplastics Mytilus Irregular particles Spherical particles
Microplastics have been found in all compartments of the environment, and numerous life forms are known to take up the anthropogenic particles. Marinefilter feeders are particularly susceptible to ingest suspended microplastics, but long-term studies on the potential effects of this uptake are scarce. We exposed juvenile Mytilusspp. to environmentally realistic doses of irregularly shaped polyvinylchloride (PVC) particles (15, 1500, 15,000, 150,000, 1,500,000 particles/individual/week calibrated in the size range 11–60μm) and regularly shaped polystyrene (PS) beads (15, 1500, 15,000 particles/individual/week, 40μm) over 42 weeks. During this period, we monitored physiological traits such as clearance rate, byssus production, growth rate, superoxide dis- mutase (SOD) activity, malondialdehyde (MDA) concentrations, and the condition index (CI). Negative effects of the tested microplastics on mussel performance emerged late in the experiment and were rather weak. Interest- ingly, even after having received the lowest particle dose of PS, SOD activity in the gill was significantly lower in mussels exposed to microplastics compared to a group of conspecifics that were kept in clean water. However, growth and CI, which are both closely related to thefitness of the mussels, were not found to be impaired at the end of the exposure phase. This is the so far longest laboratory microplastic exposure study on mussels and we worked with particle doses that reflect todays pollution levels. The small effect sizes we observed for the response variables assessed suggest that these specific microplastics pose only a minor threat to blue mussel populations.
© 2021 The Authors. Published by Elsevier B.V. This is an open access article under the CC BY license (http://creativecommons.org/licenses/by/4.0/).
1. Introduction
As plastic production continues to rise globally since the start of its mass production in the 1940s (Cole et al., 2011;Smith et al., 2018),
⁎ Corresponding author at: Marine Ecology Department, Düsternbrooker Weg 20, 24105 Kiel, Germany
E-mail address:thamm@geomar.de(T. Hamm).
https://doi.org/10.1016/j.scitotenv.2021.146088
0048-9697/© 2021 The Authors. Published by Elsevier B.V. This is an open access article under the CC BY license (http://creativecommons.org/licenses/by/4.0/).
Contents lists available atScienceDirect
Science of the Total Environment
j o u r n a l h o m e p a g e :w w w . e l s e v i e r . c o m / l o c a t e / s c i t o t e n v
plastics have not only become ubiquitous in human daily life but, mostly due to insufficient waste management, also in the ocean (Eriksen et al., 2014). Plastic pieces are found on the surface, in the water column and in deep sea sediments (Avio et al., 2016), while the frequency of poly- mer types in environmental samples roughly reflects industrial produc- tion levels with polyethylene (PE) being the most widely used kind of plastic material (Bråte et al., 2014). PVC and PS are also produced in large quantities for the global plastic market (GESAMP, 2015) and, hence, can often be found in the marine environment (Katsuhiko et al., 2011;Law et al., 2010;Phuong et al., 2016). Due to UV radiation, wave action and other physical, chemical and biological processes, large plastic items fragment with time to smaller particles (Cole et al., 2011), what makes them available for a wide range of marine organ- isms. Over 800 species have been reported to interact with plastics and of these 220 are known to ingest microplastics when present in their natural environment (Werner and O'Brien, 2018). Apart from size, one of the key factors for the bioavailability of microplastics is their physical density (Wesch et al., 2016b). Polymers with a low den- sity (<1 g/cm3) such as polyethylene (PE) or polypropylene (PP), are initially positively buoyant and thereforefloat on the sea surface. They only sink when they got fouled by bacteria or diatoms (Murray and Cowie, 2011), while microplastics with a higher physical density, e.g.
polyvinylchloride (PVC) and polystyrene (PS), sink readily to the sea- floor, where they can accumulate in sediments and/or get in contact with benthic organisms such as mussels (Browne, 2007).
Blue mussels are a group of globally abundant bivalves that play an important role in many marine coastal ecosystems (Koivisto, 2011). In the brackish Baltic Sea, in which species diversity is generally low due to the stressful salinity levels, blue mussels are the only reef-forming habitat engineers (Norling and Kautsky, 2008) that form beds with large biomasses and a rich associated fauna andflora (Kautsky, 1981).
Any adverse influence of environmental stressors on mussel popula- tions in the Baltic Sea can therefore have profound consequences for the affected benthic systems (Norling and Kautsky, 2008). In the Baltic Sea, the genusMytilusforms a species complex that consists ofMytilus trossulusandMytilus edulisand the two species also hybridise in this semi-enclosed sea area. The Kiel Fjord is located within a zone in whichM. edulis andM. trossulusshow low reproductive isolation, what facilitates the interbeeding between them. Uterman et al.
(2018), for example, found four different hybrids among a total of 19 ex- aminedMytilusindividuals from the fjord. This is why we refer to the blue mussel here asMytilusspp.
Their mode of life asfilter feeders makes mussels particularly sus- ceptible to microplastics as a new type of environmental pollution (Bråte et al., 2018;Wesch et al., 2016b;Wright et al., 2013). They are likely to inhale, for instance, PVC and PS particles, either when they are on their way to the seafloor or when they get resuspended by water movements or bioactivity (Phuong et al., 2016;Haegerbaeumer et al., 2019). Due to this, mussels were used as test organisms in many laboratory studies of which some also showed that the ingestion of microplastics can have negative consequences for the affected individ- uals (e.g.Anbumani and Kakkar, 2018;Avio et al., 2015;Wesch et al., 2016a). As suspension feeders, mussels capture food particles from the water column (Jørgensen, 1996), which they can select based on particle size, shape, nutritional value, and edibility (Kiørboe et al., 1980;Ward and Shumway, 2004). However, their capacity to identify and reject non-food particles is limited, since it is known that mussels frequently ingest microplastics (Van Cauwenberghe et al., 2015;Ward et al., 2019). Their uptake is a two-step process: First, the particles are inhaled into the mantle cavity, while, in the second step, they are moved through the mouth-opening into the digestive tract of the mus- sel (Ward and Shumway, 2004).
Some of the reported consequences of the ingestion of microplastics for blue mussels are reproductive disruption (Sussarellu et al., 2016), re- duced attachment strength of byssus threads (Green et al., 2019), in- flammatory responses (Von Moos et al., 2012), impairedfiltration
activity (Paul-Pont et al., 2016) and transcriptional changes in genes that are involved in controlling immunomodulation in adult mussels (Avio et al., 2015), as well as in larvae (Capolupo et al., 2018). This is more in depth reviewed byAnbumani and Kakkar (2018)andde Sá et al. (2018). However, others studies found that mussels are surpris- ingly tolerant even to high loads of microplastics (Gonçalves et al., 2018; Li et al., 2020; Yap et al., 2020). Van Cauwenberghe et al.
(2015), as a further example, recorded no effect on the overall energy budget after exposing mussels to high concentrations of PS micro- spheres. Due to this heterogenous picture, a clear answer to whether and how microplastics harm blue mussels is still missing. The majority of exposure studies that so far focused on the impact of microplastics onMytilusspp. (e.g.Paul-Pont et al., 2016;Sussarellu et al., 2016 reviewed byFoley et al., 2018;Haegerbaeumer et al., 2019) did not cover more than several days. However, mussels are long-living organ- isms that can persist for longer than a decade (Sukhotin et al., 2007), and duration of experiments therefore need to be of adequate length to reliably assess the potential impacts of microplastics on their health.
Furthermore, the particle concentrations realized in many of the expo- sure studies were presumably by several orders of magnitude higher than the concentrations that have so far been reported for environ- ments inhabited by blue mussels (Kirstein et al., 2018;Magara et al., 2019;Nobre et al., 2020). Additionally, plastic particles found in the environment usually have a broad size distribution, while their concen- trations increase with decreasing particle size (Covernton et al., 2019;
Erni-Cassola et al., 2017;Lambert and Wagner, 2016). In contrast to this, spherical PS beads, which are homogenous with regard to shape and size, are the type of microplastic particles that have often been used in laboratory exposure studies (Lehtiniemi et al., 2018). Their uni- formity makes them convenient to handle, while, at the same time, they can easily be obtained from several manufacturers. However, they are certainly not representative of the majority of microplastic particles in the marine environment.
Due to these shortcomings, i.e. short experimental duration, exag- gerated pollution levels and the use of non-representative particle types, it was so far not possible to identify reliably how and after which time span microplastics affect the performance of mussels when they, as it presumably is the case in most marine environments, occur in low concentrations. Hence, we lack information about the con- sequences of realistic microplastic pollution scenarios.
In this study, we applied two types of microplastics in partly very low concentrations over the course of 42 weeks. Although, the latter is still far from the exposure times mussels can experience in the wild, we believe that our experiment allows a more reliable assessment of the influence that microplastics can have on the animals than many pre- vious studies. To mimic realistic microplastic pollution scenarios, we used a PVC powder that consists of irregular particles in a size range be- tween 1 and 60μm. When suspended in seawater, the PVC particles' concentration increases with decreasing particle size. We compared them to spherical PS beads of the kind that are commonly used in labo- ratory exposure experiments. The beads were within the size spectrum that was covered by the PVC powder, but were uniform in diameter. We monitored proxies for the health of the mussels, e.g. clearance, growth and byssus production rates, every sixth week during the course of the experiment.
2. Material and methods
2.1. Mussel collection
Juvenile blue mussels (Jacobs et al., 2015) with a size of 10 mm ± 0.5 mm were collected at the GEOMAR pier (54°19′47.4″N 10°08′57.6″ E) in the Kiel Fjord, Western Baltic, on the 9thand 10thof January 2018. The mussels were recruits of the previous year and approximately 4–10 months old (Hiebenthal et al., 2013;Tedengren et al., 1990). We decided to use juveniles for this study, since the majority of exposure
experiments, which were done with mussels so far, focussed on adults (Avio et al., 2015;Browne et al., 2008;Paul-Pont et al., 2016). Juvenile mussels, however, represent a key life stage and they are usually consid- ered as more vulnerable to environmental stress than adults (Wu et al., 2017). In all systems, any adverse influence on the development of juve- niles has the potential to translate into a disruption of adult population structure (Arnold, 2008). In the nutrient-rich Western Baltic Sea, juve- nile mussels are usually increasing their biomass and shell length at a fast rate and this allows the reliable assessment of growth rates. Prior to the experiment, we assessed individual growth rates during a period of twelve weeks before the exposure to microplastics began. During this time, the mussels were kept in aflow-through aquarium with natural seawater at the currently prevailing ambient habitat temperature (4–7 °C) and were fed with the microalgaRhodomonas baltica. These data were used to standardize the individual growth rates that were then measured during microplastic exposure. This allowed us to reduce the unexplained variation in our data by eliminating a part of the inter- individual differences in the capacity to grow and, by this, to decrease the probability of a Type II error. We considered this necessary, because we partly applied very low particle concentrations, which we did not expect to cause large effects.
2.2. Husbandry
To avoid the contamination of the experiment with laboratory plas- tics, glassware was used whenever possible. During acclimation of the mussels to laboratory conditions and exposure to microplastics, 1.7 l round glass jars with a glass lid served as experimental units and within each we kept one mussel in 1.5 l of seawater. A 25 cm glass tube with a 0.4 mm syringe cannula (Sterican, Braun) was inserted through the lid of each jar until the bottom of the jar and was connected to a central pressured air supply to ensure constant aeration and mixing of the water. Seawater was taken from Kiel Fjord, was led through six car- tridgefilters (Knaub Trading GmbH & Co. KG) with a nominal pore size of 0.5μm for the lastfilter and was then stored in 300 l containers to reach lab temperature (15 °C, ±1.5 °C) before usage. Water quality was checked regularly by measuring NH3, NO2, NO3and PO4(with JBL Test Kits), pH, salinity and temperature (with WTW Oxi 23105 and WTW Cond 3310), while the water volume in each experimental unit was completely renewed once a week. Salinityfluctuated between 12 and 21 in the experimental period from January 2018 to January 2019, as it is common for Kiel Bight. The experiment comprised 12 weeks of acclimating the mussels to the laboratory conditions in the absence of particles and a 42 weeks-long exposure phase. During the latter, particle doses were applied immediately after every water exchange. In thefirst six months of the experiment (acclimation and three months of expo- sure), mussels were fed twice a day and once a day during weekends with an end concentration of 7500 cells/ml ofR. balticaper experimen- tal unit. During the remaining six months, the mussels were fed at the same intervals, but with an end concentration of 10,000 cells/ml to meet their increased food demand.
2.3. Particle suspensions
Spherical (40μm ± 10μm) PS beads (bs-partikel GmbH) with a physical density of 1.05 g/ml (as indicated by the producing company) were applied in three doses, i.e. 15, 1500 and 15,000 particles/individ- ual/week and the corresponding target concentrations were adjusted by diluting a stock suspension, which was provided by the company, withfiltered seawater (0.5μm). The irregularly shaped PVC particles (www.pyropowders.de), which had a physical density of 1.38–1.41 (Enders et al., 2015;Hidalgo-Ruz et al., 2012), were applied infive doses, i.e. 15, 1500, 15,000, 150,000 and 1,500,000 particles/individ- ual/week. A dose of 150 particles/individual/week was omitted for both particle types to broaden the range covered by the realized particle doses. The PVC particles came in the form of a powder and therefore,
different from the PS beads, varied substantially in shape and size (1–60μm) (Fig. S4). To allow for a minimum degree of comparability between the two particle types, we decided to characterize the treat- ment levels for both of them on the base of particle numbers. Since no data are available about the abundance of microplastics smaller than 11μm in the marine environment, we had no indication in which con- centrations such small particles should be applied. Due to technical con- straints, we were also not able to remove the fraction <11μm and, as a consequence, it was present in each of the PVC concentration levels (Table S6). However, when calculating the particle doses that were used in the experiment, the size fraction below 11μm was ignored and, hence, the indicated doses only refer to particles in the size range 11–60μm. We consider this legitimate, since particles between 11 and 60μm accounted for 99% of the total volume (100% between 30 and 50 μm for PS) of the PVC powder. Furthermore, the number of microplastic particles in environmental samples commonly increase with decreasing particle size following an exponential relationship (Haave et al., 2019), and this was also the case for the PVC particles used in this study. If we would have considered the particles in the size range <11μm when adjusting the different concentration levels, this would have resulted in extremely low amounts of PVC per level, what, in turn, presumably would have increased the probability of a Type II error.
To adjust the target concentrations, wefirst prepared an initial suspension with 9 g of PVC powder and 10 l offiltered seawater (0.5μm) to which 2 ml of Tween 20 were added to prevent clumping.
From this,five stock suspensions were derived by adding the appro- priate amounts offiltered seawater. This was done in separate Erlen- meyer flasks and the end concentrations were checked with a Multisizer Z3 (Beckman Coulter Counter). For injecting thefive targeted doses into the experimental units during the experiment, we used 10 ml from each of the stock suspensions. Doses of both polymer types, i.e. PVC and PS, were applied once a week directly after the water exchange by pipetting 10 ml of the respective stock suspension into an experimental unit. Hence, particles in our exper- iment were applied in pulses and particle concentrations in the ex- perimental units decreased following the administration mainly due to uptake by the mussel (A. Laubscher, unpublished data). To en- sure that mussels as small as 10 mm can actually ingest the offered microplastic particles, we inspected the faeces of mussels that were exposed to the same microplastic concentrations that were later used in the experiment (Fig. S5). Mussels from these pilot studies were not used again in the main experiment.
A group of mussel individuals, which were kept under the same ex- perimental conditions, but were not exposed to particles, served as a control group (n = 8 per time point) that allowed to assess mussel per- formance in a clean environment. In addition to this, we sampled eight mussel individuals per treatment combination (particle type x particle concentration x time point) whenever we measured destructive re- sponse variables. The latter were obtained at three time points during the course of the experiment: after 16 weeks, 32 weeks and 42 weeks.
During the last measurements in week 42, we assessed 16 instead of 8 replicates per group and therefore had a total of 296 test individuals in our study.
2.4. Response variables
2.4.1. Growth and byssus production
During acclimation and exposure to microplastics, we measured the shell lengths of all mussels as a proxy for growth. This was done with a calliper every six weeks after having detached the mussels from the glass walls of the experimental units by scratching off the byssus.
After the measurements, mussels were placed back into the experimen- tal units. This was done approximately 36 h after the last particle dose was applied, while, after another 24 h, the newly generated byssus threads were counted.
2.4.2. Condition index
This destructive response variable was assessed at the start of the ex- posure phase as well as 16 and 32 weeks later. For this, the shell length was measured with a calliper, and then the individual mussels were heated for 20 s in a microwave. This allowed the fast and complete re- moval of the soft body, which was then dried for 24 h at 60 °C. The con- dition index was calculated afterRiisgård et al. (2014):
CI¼dryweight mg½ =shell length cm½ 3
2.4.3. Clearance rate
Clearance rates were assessed afterCoughlan (1969) by measuring the decline in microalgae concentrations over time in the experimental units. We usedR. balticafor the measurements, because cells of this spe- cies are usually >4μm and this is sufficiently large to ensure a 100% up- take by the gills ofM. edulis(Riisgård and Larsen, 2001). Measurements started 16 h after a new particle dose was added. In this moment, a con- centration of 10,000 cells/ml was adjusted in the experimental units and upon this every 30 min a volume of 15 ml was taken from the cen- tral part of a unit with a pipette. This was repeated for three tofive times, while cell concentrations in the extracted volumes were subse- quently determined using a Z2 Coulter particle count and size analyser (Beckman Coulter, Krefeld, Germany) with a 100μm orifice tube. Clear- ance rates were calculated as the decrease inR. balticacell numbers over time and were visualized as straight lines in semi-log plots. We only in- cluded those measurements in the analysis in which the regression of cell numbers as a function of time yielded R2≥0.9. The slopes of these straight lines were then standardized by the shell lengths of the corre- sponding mussel individuals. Due to time constraints, the groups of mussels (n = 8 per treatment combination) that were exposed to PVC and PS, respectively, were processed in two consecutive weeks. During this time, we also measured the clearance rates in those mussels that were not exposed to particles (i.e. the control group).
2.4.4. Superoxide dismutase activity and malondialdehyde concentration At the end of the exposure phase, 16 mussels per treatment combi- nation were opened by cutting the anterior adductor muscle, and then the gills and the digestive system were removed, weighed andflash fro- zen in liquid nitrogen. Superoxide dismutase activity (SOD) was mea- sured according toLivingstone et al. (1992)using a xanthine oxidase/
cytochrome C assay. In this assay, one unit of SOD reduces the increase in extinction during the reduction of oxidized Cytochrome C by 50%. The protein content of the homogenized tissue of the gills and the digestive system was determined with a Bradford Assay. Due to time constraints only the reference group, the groups that received the lowest, medium and highest PVC dose (i.e. 15, 15,000 and 1,500,000 particles/individual/
week) as well as the lowest and highest PS dose (i.e. 15 and 15,000 par- ticles/individual/week) were considered for assessing this response var- iable. Malondialdehyde concentrations in the digestive system of the mussels were measured as an indicator for lipid peroxidation after Uchiyama and Mihara (1978). This was done for the same treatment levels for which the SOD activity was assessed. For this, the digestive glands of eight mussels per treatment combination were weighed and flash frozen in liquid nitrogen. MDA levels in the homogenized tissue were then determined by derivatisation with thiobarbituric acid, while absorption was measured at 530 nm. Absorption values were then converted into MDA concentrations with a MDA standard curve.
2.4.5. Statistical analysis
Analysis and visualization of the data were done with the free statis- tical computing software R (version 3.6.3) using the packages“nlme” and“car”for the statistics and“ggplot2”for the graphs. To compare the performance of the mussels that were kept in the presence of parti- cles with those in the control group, we used eight pairwise compari- sons per time point, which was six timepoints for for clearance rates,
seven for byssus production and eight for growth rate. For SOD and MDA,five pairwise comparisons were used for one timepoint. This was done with bonferroni-correctedt-tests that had p≤0.01 for SOD and MDA and p≤0.006 for all other response variables as thresholds for statistical significance.
Prior to the analysis, individual mussel growth rates, which were assessed during the exposure phase, were divided by the corresponding individual growth rates that we measured during the acclimation phase.
This was done to account for inter-individual differences in growth and to reduce the amount of unexplained variation in the data. For the non- destructive response variables growth rate and byssus production, the same mussel individuals were measured repeatedly, while for the de- structive response variables each mussel individual was, obviously, measured only once. Although not a destructive response variable, clearance rate was also not obtained repeatedly from the same test indi- vidual. We refrained from applying repeated measures (RM) ANOVA to those variables that were assessed repeatedly from the same experi- mental units, because RM ANOVA cannot handle time as a continuous variable.
For all analyses, homogeneity of variances was verified with plots of the residuals depicted as a function of thefitted values and with the Fligner-Killeen test. Normality of errors was inspected with histograms of the residuals and was tested with the Shapiro-Wilk's-W test.
3. Results
3.1. Growth rates and condition index
Growth rates of the test mussels were positive throughout the ex- periment and ranged between 0.005 and 1.850 mm/week, while no sig- nificant difference in growth rates between experimental groups was observed (Fig. S2, Table S4).
The mean condition index (CI), averaged across all mussel individ- uals in our experiment, was similar to CIs that were obtained from Mytilusspp. individuals of the same size that came from wild popula- tions of the Western Baltic Sea (Riisgård et al., 2014). We assessed the CI after 16 and again after 32 weeks of exposure, but at none of these time points any significant difference between the experimental groups was observed (Table S5).
3.2. Clearance rates
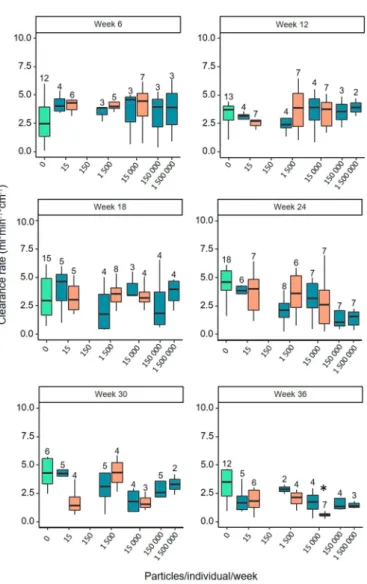
After six weeks of exposure, median clearance rates were consis- tently higher in those groups of mussels that were exposed to particles, regardless of the particle type and the doses, than in mussels that were kept in a clean environment (Fig. 1and Fig. S1). Six weeks later, median clearance rates of individuals in the groups with particles had declined to a level similar to the rates in the control group. This development continued and from week 18 on clearance rates in the mussels that were exposed to microplastic particles were consistently lower than in those that were kept in the absence of particles. This trend was most pronounced in the groups that experienced the highest particle doses (PVC: 1500000 particles/individual/week; PS: 15000 particles/in- dividual/week). Finally, after 30 and again after 36 weeks, respectively, clearance rates of mussels in the PVC and PS groups were only half as high as in the mussels of the control group. After 36 weeks, this differ- ence was statistically significant (p = 0.002) for the comparison be- tween the mussels that received the highest PS dose and the mussels of the control group (Table S1,Fig. 1). All other analyses did not reveal any significant effect of exposure to microplastic particles on the capac- ity of mussels tofilter sea water.
3.3. Byssus production
Byssus production decreased from 20 to 13 byssus threads per mus- sel per day (median value) in all experimental groups, including the
control group, during the course of the experiment. After 36 weeks of exposure, byssus production was generally lower in those mussels that had received particles. Furthermore, in week 36 mussels that expe- rienced the second highest dose of PS beads produced significantly less byssus threads than the mussels in the control group (p = 0.002), while all other pairwise comparisons for this time point were insignificant (Fig. 2, Table S2).
3.4. Superoxide dismutase (SOD) and malondialdehyde (MDA)
Median concentrations of SOD ranged between 0.74 and 6.62 U/mg and were therefore similar to values reported in studies onMytilusspp.
that used the same concept of measuring xanthine oxidase/cytochrome C (Gonzalez-Rey and Bebianno, 2011;Pipe et al., 1993). This was true for tissue from the gills and from the digestive tract (Fig. 3). In all mus- sels that were exposed to microplastics, regardless of the type, the me- dian SOD concentrations were lower than in the control group. Mussel individuals that were exposed to PS, regardless of the doses, showed less than half of the SOD activity than individuals that were exposed to PVC and these differences were statistically significant (PS, 15 part
icles/individual/week: p = 0.003 in gills and p = 0.0003 in digestive gland; PS, 15000 particles/individual/week: p = 0.008 in digestive gland, Table S3).
Similar to the SOD activity, median MDA concentrations were also lower in mussels that experienced exposure to either PS or PVC than in the control group (Fig. 4). However, this difference was not statisti- cally significant. Interestingly, this pattern was independent of the dose, since the median concentrations of the treatment groups were 50–69% lower than the median concentrations of the control group. Fur- thermore, the variance in the control group was two to three times higher than in the groups of mussels that experienced exposure to particles.
Fig. 1.Clearance rates ofMytilusspp. at various time points since the start of exposure to microplastics. Orange boxes represent the groups of mussels that were exposed to PS, blue boxes those that were exposed to doses of PVC particles calibrated for the size range 11–60μm. The green box represents mussels that were kept in the absence of particles.
Numbers on top of the whiskers indicate the number of replicates per group. Boxplots show the interquartile range, the median and the non-outlier range. (For interpretation of the references to colour in thisfigure legend, the reader is referred to the web version of this article.)
Fig. 2.Byssus production in 24h inMytilusspp. at various time points since the start of exposure to microplastics. Orange boxes represent the groups of mussels that were exposed to PS, blue boxes represent those that were exposed to doses of PVC calibrated in the size range between 11 and 60μm. The green box represents mussels that were kept in the absence of particles. Number of replicates ranged between 15 and 17 for all groups and time points. Boxplots show the interquartile range, the median and the non- outlier range. (For interpretation of the references to colour in thisfigure legend, the reader is referred to the web version of this article.)
4. Discussion
4.1. Environmentally realistic exposure experiments
In this 42-week long exposure experiment, we constantly observed a positive growth rate and no difference in the CI of the test mussels at any measured time point. Clearance rate and byssus production were both significantly lower in mussels that were ex- posed to the medium concentration of PS beads than in conspecifics of the control after 36 weeks. SOD activity in the gills and in the di- gestive system was significantly lower in groups of mussels exposed to the lowest and highest dose of PS beads (gills) and the highest dose of PS beads (digestive system) compared to the control. The same trend was, although not significant, visible in the MDA concen- trations of the digestive system.
We applied the two types of microplastics we used in pulses and did not maintain a constant particle concentration in the experimental units. The various target concentrations were adjusted once a week and declined thereafter at an unknown rate until a new pulse was ad- ministered a week later. We cannot tell whether this corresponds to the conditions in thefield, because we still lack knowledge about the temporal variability in the abundance of microplastics in marine sys- tems. However, the monitoring studies that were done so far reported a large temporal and spatial heterogeneity in the occurrence of these particles in the water column, in sediments and on beaches (Phuong et al., 2016;Ryan et al., 2009;Setälä et al., 2018;Wong et al., 2020;
Zhao et al., 2014). The highest temporal resolution that so far was achieved in a monitoring study assessed the densities of microplastics in a river system every two weeks during a total time period of 12 weeks (Wong et al., 2020). The authors observed that microplastics'
densities varied in a range from 5 to 200 particles per m3between two subsequent sampling events. Although, this is only a spotlight, it sug- gests that it is likely that benthicfilter feeders do not experience a con- stant supply with microplastics, but that the ingestion of particles might be followed by longer periods during which no synthetic material is en- countered. Therefore, a pulsed application is presumably more realistic than an exposure to a constant concentration. The latter could even lead to an overestimation of the impact of the anthropogenic material onfil- ter feeders, since it does not allow the mussels to recover from the po- tential stress. We administered particles into the experimental units once a week and we believe that the length of this time interval ensured that the mussels recovered from the previous pollution event.
This approach is also in line with the vast majority of previous stud- ies on the subject, which also applied particle pulses, but usually let shorter time intervals (hours to days) elapse between the resets (e.g.
Avio et al., 2015;Détrée and Gallardo-Escárate, 2018;Fernández and Albentosa, 2019;Pittura et al., 2018). This approach is so common, be- cause it is technically challenging to adjust a constant concentration of suspended solids in the laboratory, since microparticles are ingested by the mussels and becomefixated in faeces and pseudofaeces. Hence, to maintain a constant particle concentration, the experimenter would need to replace the particles at the same rate as they got depleted.
This would require a permanent monitoring of the actual particle con- centrations during the experiment and the establishment of, in the best case, an automatic method that would allow to replenish particles at the same rate at which they are removed from the system. So far, this was achieved only in one study (Sussarellu et al., 2016).
It is very likely that the concentration of suspended particles inside the experimental units declined to zero every time before a new dose was applied. This is because mussels of the size we used are able tofilter the water volume inside the experimental units within the course of hours to a few days. This assumption is supported by thefindings of Rist et al. (2019), who reported a depletion of half of the PS particles (50μm, 100 particles/l to 50 particles/l) that were offered in 5 l per in- dividual within 40 min by blue mussels that were 5 cm in length. Similar results were reported for 2 and 10μm sized PS beads of which 40% to 60%, respectively, were removed from 1l of seawater within 20 min by 4 cm long mussels (Gonçalves et al., 2018). Furthermore, we added the microplastics immediately after the addition of algal cells, what ad- ditionally triggered afiltering behaviour in the mussels.
Since the clearance rate of mussels depends on their shell length (Jacobs et al., 2015;Riisgård et al., 2014), the clearance of particles that was observed in this study was slower than in studies that had larger mussels as test animals. Therefore, in case of the lower particle doses, complete clearance of particles presumably occurred within sev- eral hours, while in case of higher particle doses it occurred within a day.
We applied two types of microplastics that differed in shape, size and in the polymer they were made from. It was not possible to disen- tangle the potential influences of these factors in our experiment, since we were neither able to obtain beads made from PVC nor did we Fig. 3.Influence of different doses of PVC particles calibrated in the size range between 11μm and 60μm (blue) and of PS (orange) beads on superoxide dismutase concentrations in different body parts ofMytilusspp. 42 weeks after the start of exposure to microplastics: (A) digestive system and (B) gills (n = 5–8 per treatment combination). The green box represents mussels that were kept in the absence of particles. Boxplots show the interquartile range, the median and the non-outlier range. (For interpretation of the references to colour in thisfigure legend, the reader is referred to the web version of this article.)
Fig. 4.Influence of different doses of PVC particles calibrated in the size range between 11–60μm (blue) and PS (orange) particles on malondialdehyde concentrations in Mytilusspp. 42 weeks after the start of exposure to microplastics (n = 6–8 per treatment combination). The green box represents mussels that were kept in the absence of particles. Boxplots show the interquartile range, the median and the non- outlier range. (For interpretation of the references to colour in thisfigure legend, the reader is referred to the web version of this article.)
find PVC and PS particles that had the same size or the same size distribution.
The difference in the size distributions between the PVC powder and the PS beads had consequences for the total particle numbers as well as for the average size of particles that each mussel received within a unit of time. Regarding the doses and the resulting particle concentrations, we aimed at mimicking an environmentally realistic scenario. However, very few monitoring studies actually captured microplastics in the size range in which blue mussels can clear particles from the water column (i.e. 4–600μm) (Covernton et al., 2019;Ward et al., 2019). This is be- cause the majority of monitoring studies that sampled the water col- umn were done with nets that had a mesh size of 333μm (Lindeque et al., 2020).Enders et al. (2015), being an exception in this context, reported 13 to 501 items/m3in a size range of 10–407μm with the majority of particles being <40μm.Van Cauwenberghe et al. (2015) considered the average pumping rate of mussels as well as the particle densities reported in their monitoring at the French, Belgian and Dutch North Sea coast and suggested that mussels are likely to encoun- ter 10 particles/day. Since results from monitorings suggest that particle numbers increase with decreasing particle size (Covernton et al., 2019;
Enders et al., 2015), we are convinced that mussels encounter higher doses of microplastics than thefield data currently suggest (Lindeque et al., 2020). We therefore consider 15 as well as 1500 particles/individ- ual/week as loads that are certainly environmentally realistic. However, we also applied higher and therefore not environmentally realistic par- ticle loads in order to investigate a possible dose-effect dependency over time.
PVC doses were calibrated only for particles in a size range between 11 and 60μm and they were adjusted to numerically match with the PS doses that we applied. In fact, the actual concentrations of PVC particles were substantially higher, because we did not consider the size fraction below 11μm in the calibration. We chose this approach to ensure that the doses for both particle types, i.e. PS and PVC, were standardized with regard to the size range that comprises the largest part of the vol- ume of the applied particles. The diameter of the PS beads was between 30μm and 50μm and this range covered 100% of the volume, while PVC particles ranged from 1 to 60μm, but the particles that made up 99% of the total volume were between 11 and 60μm.
The PS beads we used had an average diameter of 40μm and were therefore generally larger than the PVC particles that had an average di- ameter of 11μm. This difference also had consequences for the plastic particle to food ratios that prevailed in the experimental units directly after the administering of microplastics. In the units that received the highest PS dose, the ratio of the volume of beads to the volume of algal cells was 1: 2.3, while in case of the PVC particles the ratio was 1: 113. Hence, PS beads accounted for a larger fraction of the offered particles (i.e. food algae + MP particles), and diluted the food to a higher degree than it was the case for PVC. As a consequence, the amount of digestible food that was gained per unit of ingested particles was lower when PS beads were applied. This could have been a reason for the difference in the effect sizes between PS and PVC that we ob- served. Interestingly, if we are right with this assumption, the effect would have been mediated by the seston-like character of the microplastics and would not have been the consequence of toxicity, in- flammatory responses or blockages of the digestive tract. Therefore, it is likely that in this experiment the total volume of the particles was more relevant for the observed impact on the mussels than the particle numbers.
All doses that we applied led to particle concentrations in the exper- imental units that were below the threshold for pseudofaeces produc- tion (Bayne et al., 1988). However, apart from the concentration, Mytilus eduliscan select suspended solids based upon other characteris- tics such as their size, shape and surface wettability (Ward et al., 2019).
With regard to size, the capture efficiency inMytilusspp. is low for par- ticles <1μm (Ward and Kach, 2009), but it approaches 100% when par- ticles are encountered that are larger than 4–6μm (Ward et al., 2019).
WhileMytilus eduliscan presumably ingest suspended solids up to a size of 600–900μm, the egestion rates via pseudofaeces reach 98% for particles that are 1000μm in size (Ward et al., 2019). The PVC particles in our experiment ranged from 1 to 60μm, and, hence, the largest part of them (i.e. all >4μm) should have been ingested by the mussels with a high efficiency. Furthermore, particles of both types, PVC and PS, were in a size range in which most suspended solids are taken up into the in- testinal tract and only a few are rejected from the mantle cavity (Ward et al., 2019). However, the PS beads were, on average, larger than the PVC particles and possibly the mussels rejected and removed more PS beads than PVC particles, which could be associated with higher energy expenditures, for instance for the production of mucus. This would be a further possible explanation for the fact that the spherical PS beads were more detrimental for the mussels than the irregular PVC particles.
The fact that the microplastic particles that we used differed with re- gard to the polymer they were made from also had consequences for their surface chemistry and wettability (Potthoff et al., 2017). Blue mus- sels are capable of selecting particles on the base of physico-chemical surface properties (Rosa et al., 2013), and this could mean that one frac- tion of particles is more frequently ingested than others when mussels are exposed to a mixture of suspended solids.Mytilus edulis, for exam- ple, is known to favour PS beads over aluminium oxide particles when they are offered simultaneously (Rosa et al., 2013). However, PVC and PS particles do not differ largely with regard to their surface properties.
They are both negatively charged (Tourinho et al., 2019), and they both can emit monomers (Lambert et al., 2017). Thefirst circumstance could lead to a preferred uptake byM. edulisof both particle types when they are offered together with other suspended solids such as clay (Ward et al., 2019), but it should not lead to a difference in uptake rates be- tween the particle types. So far, there are only a few studies that assessed the effects of microplastics that were made from different polymers in the same exposure study. In one of them, Avio et al.
(2015)compared the effects of PS and PE particles, which were of the same size and had the same shape, on the blue mussel Mytilus galloprovincialisand found that PS elicited slightly stronger effects when cellular responses were considered as a response variable, while for the majority of traits assessed by the experimenters no difference emerged. We conclude from this that polymer identity was not the driver of the difference in the effects of PVC and PS particles that we observed.
Could the physical density of the polymers have been this driver?
The physical density of PVC is by ~0.3 g/ml higher than that of PS, and PVC particles should therefore sink faster than PS beads. Hence, the de- pletion of thefirst from the water column in our experimental units could have been faster than the depletion of the second. As a conse- quence, the ingestion of the PS beads could have been more likely than the ingestion of PVC particles. However, in our set-up the particles in the experimental units were mixed strongly by air bubbles that were led into the jars through a glass tube. The bubbling ensured an even dis- tribution of the particles within the units and prevented them from sinking to the bottom of the jars. Hence, it is not likely that the PVC par- ticles sank faster than the PS beads and were therefore ingested in lower quantities. Furthermore, there is no evidence that particles are rejected by mussels due to their physical density (Ward and Shumway, 2004).
Another property that could explain the different effects of PVC par- ticles and PS beads in our study is their shape. Spherical PS beads have been used in many exposure experiments that sought to investigate the effects of microplastics (Cole et al., 2015;Lambert et al., 2017;Li et al., 2019;Long et al., 2017). However, they are rare to find in environmental samples and the transferability of results from labora- tory studies with microspheres to natural habitats, in which fragmented microplastics dominate, has been questioned (Phuong et al., 2016). It seems plausible that irregularly shaped particles generally have a higher potential to cause injuries and may attach stronger to internal surfaces (Lambert et al., 2017). So far, only very few studies compared the effects of spherical particles to those of irregularly shaped ones (Choi et al.,
2018;Frydkjær et al., 2017). In sheepshead minnow larvae, which were exposed to either spherical or irregularly shaped PE particles, the swim- ming activity was lower when larvae were exposed to irregular PE, while histological sections, ROS levels and gene expression did not differ between particle shapes (Choi et al., 2018). Another study that also compared effects between spherical and irregularly shaped PE particles, but usedDaphnia magna, observed slower egestion rates, higher EC50 values as well as a stronger immobilization of daphnids after exposure to irregular PE (Frydkjær et al., 2017). These results suggest that it is species dependent if irregular or spherical shaped microplastics elicit different effects.
Finally, the difference in the total volume of the particles per exper- imental unit could have been responsible for the different effects we ob- served for PVC particles and PS beads. Since the volume per unit results from the size of the particles and their number, it is difficult to disentan- gle the influences of these two potential drivers in an experimental set- ting. A possible approach to this would be to apply particles, on the one hand, in constant concentrations, but vary their volumes and to apply particles, on the other hand, in constant volumes, but vary their concen- trations. Furthermore, to identify the potential role of polymer type for the mediation of effects, the size and the volume of the applied particles would need to be kept constant. The latter is challenging, since it is dif- ficult tofind microplastic particles on the market that are identical in their properties, but differ with regard to the polymer they were made from. From our experience, it is also very difficult to manufacture micro- particles, e.g. by the milling and sieving of plastic granulates, that have certain pre-defined characteristics and are in the size range of food par- ticles for mussels.
To sum up, when comparing different types of microplastics, future experimental studies should focus more on the role that the volume and the size of the particles play for the ingestion by mussels. Further- more, they should consider the rate at which particles are rejected from the mantle cavity before ingestion, to assess the amount of energy that mussels invest into cleaning themselves from the unwanted parti- cles and combine this with long term exposures to determine physio- logical effects on the mussels. This would allow to disentangle the negative effects of microplastics that are caused by the uptake of the particles into the digestive tract and those that go back to elevated en- ergy expenditure as a consequence of cleaning.
4.2. Decrease in SOD activity and MDA concentration
The most pronounced changes in mussel performance due to parti- cle exposure emerged in the SOD activity and in MDA concentrations.
SOD activity in groups of mussels that were exposed to microplastics were, on average, 50% (PVC) and 65% (PS) lower than in the control group, while MDA concentrations in mussels exposed to microplastics reached only 30% of the levels that were observed in the control group. Even though the latter difference was not statistically significant, it is pronounced and follows the same trend that we observed for the SOD activity.
These results were unexpected, since the two variables usually rise when an organism experiences oxidative stress. This is because SOD neutralizes reactive oxygen species (ROS) and the expression of the as- sociated genes is upregulated when oxygen radicals occur frequently.
MDA is a side product of lipid peroxidation and can therefore serve as an indirect measure of oxidative stress. SOD levels are commonly in- creased when organisms experience short-term stress due to abrupt fluctuations in environmental conditions such as temperature, oxygen concentration and salinity (Letendre et al., 2008), while MDA levels usu- ally rise during continuous stress events that prevail for days or longer (Vlachogianni, 2007).
Interestingly, previous studies on the effects of microplastics on the SOD activity and MDA levels in mussels partly came to contradicting re- sults.Cole et al. (2020)observed a transitory increase in the SOD activity inMytilusspp. 24 h after exposure to PS beads (500 ng/ml, 20μm), while
the activity returned to normal levels within 7 days of continued expo- sure. In contrast to this,Magara et al. (2018), who exposedM. edulisto 100 and 1000 PE particles/ml (10–90μm) for four days, observed a slight decrease in the SOD activity. Similar to this,Avio et al. (2015)ob- served the downregulation of the SOD2 gene that is responsible for SOD expression after having exposedM. galloprovincialisto PS and PE parti- cles (0.5–50μg/L, <100μm) for seven days. In our experiment, SOD ac- tivity and MDA levels had decreased in all groups of mussels that were exposed to microplastics. Furthermore, the effect was more pronounced in case the mussels were kept in the presence of PS than if they were ex- posed to PVC.
The differences in the SOD activity after exposure to microplastics that were observed between studies could be explained by the fact that, inMytilusspp., the SOD activity and the corresponding gene ex- pression levels can be adjusted to changes in environmental conditions within hours (Letendre et al., 2008). Possibly, the strength and the di- rection of the effect that exposure to microplastics has on the SOD activ- ity also depend on the time that elapsed between the moment the particles got in contact with the mussel and the moment the tissue was preserved for later analysis. Hence, to interpret a change in the SOD activity as a reaction to exposure to microplastics, it could be cru- cial to take this time interval into account.Cole et al. (2020)observed an increase in SOD concentrations still 24 h after the exposure to microplastics has ended, while samples for assessing SOD in our study were taken 16 h after the exposure to microplastic particles stopped. Hence, we assume that we have not missed any effect of the microplastics on this response variable.
After 7 days of exposure to 2000 PS particles/ml/day (2 and 6μm), Paul-Pont et al. (2016)also found that MDA levels in exposedMytilus spp. were lower than in mussels of the control group. To explain this un- expected picture, the authors suggest that catalase, which is also a part of the antioxidant system, neutralized the ROS before a rise in MDA levels was triggered (Paul-Pont et al., 2016). This could actually explain why the MDA levels in exposed mussels were not higher than in non- exposed conspecifics, but it does not elucidate why they were lower. A lower level in MDA concentrations was also observed in the gills of Scrobularia planaafter 3, 7 and 14 days of exposure to 1 mg/l spherical PS beads (20μm). In the same experiment, however, MDA levels in the digestive gland of the exposed clams, which were also sampled, were higher than in non-exposedScrobulariaindividuals and this was first observed on the 7th day of exposure (Ribeiro et al., 2017). So, it seems that the reaction in the MDA system to exposure to microplastics can differ even between individuals of the same species and even be- tween different tissues of the same animal. In most other studies on bi- valves, no change in the MDA levels has been observed after exposure to microplastics (Gonçalves et al., 2018;Pittura et al., 2018;Santana et al., 2018). OnlyOliveira et al. (2018), found lipid peroxidation levels to be higher inCorbiculaflumineathat were exposed to 0.11 mg/l PS particles (20μm) for 8 days than in non-exposed conspecifics, what indicates lipid peroxidation as a reaction to oxidative stress. These conflicting re- sults do not allow to tell whether exposure to microplastics generally leads to oxidative stress in bivalves and they question the use of MDA concentrations in studies that try to assess the consequences of expo- sure to microplastics.
The antioxidant system involves many different enzymes that scav- enge ROS or other forms of oxidative stress and new enzymes are dis- covered regularly (Trestrail et al., 2020). The decrease in the activity of SOD and in the MDA levels we observed could therefore also mean that another enzyme was upregulated at the expense of these two sys- tems that mitigated the oxidative stress induced by the microplastic particles. The antioxidant system also comprises reduced glutathione (GSH), which is not an enzyme but can also scavenge ROS (Jeong et al., 2016). It could therefore substitute SOD. Other antioxidant en- zymes are catalase (Cat) and glutathione peroxidase (GPx). Both elimi- nate H2O2(Gonzalez-Fernandez et al., 2015), but Cat breaks down H2O2
that comes from exogenous sources, while GPx works on H2O2from
metabolically processes (Avio et al., 2015). Both enzymes have been shown to occur in elevated concentrations after microplastic exposure (Magara et al., 2018). Another important component of the antioxidant system is glutathione-s-transferase, but this enzyme has so far not been observed to increase in concentrations after exposure to microplastics (Magara et al., 2019;Webb et al., 2020).
4.3. Effect on byssus production
A further response variable that was affected by exposure to microplastics in our study was the production of byssus threads. Byssus consists of sclerotinized proteins that are produced by a gland near the muscle foot. These threads are of utmost importance for thefitness of mussels, since they allow them to attach themselves to solid surfaces.
By this, the epibenthic bivalves manage to remain in favourable envi- ronments even if wave impact or currents exert physical forces on them. However, the production of byssus is costly in terms of metabolic energy and is compromised in case mussels are subjected to environ- mental stress such as oxygen deficiency or elevated temperatures (Sui et al., 2017). In a previous experiment, exposure to PET particles at con- centrations as low as 1 particle/ml has reduced the number and attach- ment strength of byssus threads inM. edulisby 50% within 52 days (Green et al., 2019). The authors interpreted this as a sign for stress that was inflicted on the test mussels. We observed that the PS beads had a stronger negative influence on byssus production than the PVC particles, but this difference occurred only at the end of the experiment (36 weeks). At this time point, the PS exposed mussels produced 43%
less byssus threads (median values) than mussels in the control group. The fact that the effect on byssus emerged so late suggests that the mussels were able to withstand the applied particles doses for a long period of time. Hence, experimental studies that cover weeks may be too short to reveal the potential negative effects of low doses of microplastics.
4.4. Effects on clearance rates
Clearance rates determine the energy intake in blue mussels and they can vary substantially with changes in food concentration and food quality (Riisgård, 1991). This makes them an important indicator of stress in bivalves (Harris and Carrington, 2020). In our study, after ex- posure to the highest PS dose for 36 weeks, mussels exhibited a signifi- cantly lower clearance rate than their conspecifics in the control group.
Since the PS beads were spherical and larger than the PVC particles, they also had a larger volume per particle. Large and voluminous particles are known to be retained longer within the gut system of mussels (Brillant and MacDonald, 2002;Ward et al., 2019), what could lead to a reduced intake of new food particles and, hence, a decrease in thefiltration activ- ity. In our study, microplastic particles were administered once a week, which is presumably not enough time to depurate them completely from the gut system before a new pulse of particles was administered.
Fernández and Albentosa (2019)exposedM. galloprovincialis(4 cm) to irregularly shaped high density polyethylene particles (1–22μm, 2 and 4mm3/l), and observed that only 85% of the particles were cleared from the gut within 6 days of depuration. If this rate was similar in our study, it is very likely that particles accumulated during the course of the experiment, what could be the reason for the slow and steady de- cline in clearance rates that we observed. In summary, this could mean that the volume per particle was the characteristic that determined the size of the effects caused by the microplastics.
We also observed an interesting change in clearance rates over time, although this trend was not statistically significant. At the beginning of the exposure phase, those mussels that were in contact with plastic par- ticles had higher clearance rates than conspecifics that were kept in a clean environment (Fig. S1). This could have been a strategy to ensure a sufficient supply with edible particles, e.g. algal cells, when indigest- ible particles are present that can reduce the uptake of food items per
unit time. The same trend was reported byFernández and Albentosa (2019) who observed higher clearance of algae and microplastic particles at the higher of two tested concentrations (2 and 4 mm3/l).
Compensatory feeding inM. edulishas already been observed in exper- iments in which other inedible particles were mixed into an algal sus- pension (Bayne et al., 1993). Compensatory feeding allows to keep the net energy gain per unit time constant and makes mussels successful in- habitants of turbid environments, which are inaccessible for organisms like ascidians that lack such mechanisms (Kjerulf Petersen et al., 1997).
Interestingly, after 12 weeks of exposure, the clearance rates of the exposed mussels sank below those of the mussels in the control group. Observations of clearance rates over long periods of time are rare, which is why we can only speculate about the reason for this de- velopment. It could either have been due to a switch in their feeding strategy that allowed them to cope better with the regular presence of inedible particles or could reflect a general decrease in the performance of the mussels as a consequence of exposure to microplastics. The latter would indicate that the microplastics inflicted a stress on the mussels.
4.5. No effects on growth and CI
In contrast to the previously mentioned response variables, the growth rates of the mussels remained unaffected by exposure to microplastics. We paid particular attention to achieve a high test power when assessing the influence of microplastics on mussel growth.
For this, we monitored the growth rate of each single mussel individual for twelve weeks before the exposure to microplastics was started. Prior to the analysis of the growth rate data that we collected during the ex- posure phase, the growth rate that a single mussel individual exhibited during exposure was divided by the growth rate that the same individ- ual showed during the acclimation phase. By this, we were able to ac- count for the partly pronounced differences in the capacity to grow that existed between mussel individuals. This, in turn, allowed us to re- duce the unexplained variation in the study system and to increase test power. We considered this meaningful, since the microplastics were ap- plied in partly very low concentrations and they came in weekly pulses that allowed the mussels to recover before new particles were adminis- tered. Therefore, we expected rather small effect sizes.
During the course of the experiment, the food quantity that was pro- vided per mussel individual per day was increased only once. However, the CIs of the test mussels, which we obtained after 16 and 32 weeks, were comparable to those of wild mussels of the same size (Riisgård et al., 2014) and this indicates that the amount of food we supplied was sufficient to support normal growth in the mussels. This was also confirmed by the fact that the juvenile mussels were 10 mm long when the acclimation phase started and had grown up to an average size of 25.9 mm when the exposure ended after 42 weeks. A sufficient food supply is an important aspect for long-term exposure experiments, since negative effects of food deficiency can otherwise easily overwrite any influence of the treatment. This is particularly true for scenarios in which invertebrates are kept in the laboratory over the course of months and when microplastic particles or other pollutants are applied in low doses.
5. Conclusions
Our study confirms that microplastics can influence the performance of the blue musselMytilusspp. even when they are present in very small amounts. Even the lowest concentration that we applied, i.e. 15 particles per individual per week, had a statistically significant effect on the SOD activity in gills and, on clearance rates and byssus production. It is im- portant to note that we only found statistically significant effects to- wards the end of the experiment (week 36 of 42). This stresses the importance of long-term studies for assessing the biological effects of microplastics, in particular when very low and, hence, environmentally realistic particle doses are applied. However, the effects we observed