From ecosystems to socio-economic bene fi ts: A systematic review of coastal ecosystem services in the Baltic Sea
Melanie J. Heckwolf
a,⁎
,1, Anneliis Peterson
b,1, Holger Jänes
c, Paula Horne
d, Jana Künne
a, Kiran Liversage
b, Maurizio Sajeva
d, Thorsten B.H. Reusch
a,2, Jonne Kotta
b,2aMarine Evolutionary Ecology, GEOMAR Helmholtz Centre for Ocean Research Kiel, Germany
bEstonian Marine Institute, University of Tartu, Estonia
cSchool of Life and Environmental Sciences, Centre for Integrative Ecology, Deakin University, Burwood, Victoria, Australia
dPellervo Economic Research PTT, Finland
H I G H L I G H T S
• We summarized 20 ecosystem services provided by coastal Baltic ecosystems.
• Information on how services translate into socio-economic benefits is lacking.
• The deep knowledge gap impairs the sustainable management of the bene- fits.
• We propose a framework with four key measures to close this knowledge gap.
• Toxins and Nutrients are the most well- document pressures to these services.
G R A P H I C A L A B S T R A C T
a b s t r a c t a r t i c l e i n f o
Article history:
Received 8 May 2020
Received in revised form 22 September 2020 Accepted 22 September 2020
Available online 30 September 2020 Editor: Paulo Pereira
Keywords:
Macroalgae Seagrass Mussel beds Meta-analysis Ecosystem functioning Eco-GAME
Seagrass meadows, algal forests and mussel beds are widely regarded as foundation species that support commu- nities providing valuable ecosystem services in many coastal regions; however, quantitative evidence of the re- lationship is scarce. Using the Baltic Sea as a case study, a region of significant socio-economic importance in the northern hemisphere, we systematically synthesized the primary literature and summarized the current knowl- edge on ecosystem services derived from seagrass, macroalgae, and mussels (see animated video summary of the manuscript: Video abstract). We found 1740 individual ecosystem service records (ESR), 61% of which were re- lated to macroalgae, 26% to mussel beds and 13% to seagrass meadows. The most frequently reported ecosystem services were raw material (533 ESR), habitat provision (262 ESR) and regulation of pollutants (215 ESR). Toxins (356 ESR) and nutrients (302 ESR) were the most well-documented pressures to services provided by coastal ecosystems. Next, we assessed the current state of knowledge as well as knowledge transfer of ecosystem ser- vices to policies through natural, social, human and economic dimensions, using a systematic scoring tool, the Eco-GAME matrix. We found good quantitative information about how ecosystems generated the service but al- most no knowledge of how they translate into socio-economic benefits (8 out of 657 papers, 1.2%). While we are aware that research on Baltic Sea socio-economic benefits does exist, the link with ecosystems providing the ser- vice is mostly missing. To close this knowledge gap, we need a better analytical framework that is capable of di- rectly linking existing quantitative information about ecosystem service generation with human benefit.
© 2020 The Authors. Published by Elsevier B.V. This is an open access article under the CC BY license (http://creativecommons.org/licenses/by/4.0/).
⁎ Corresponding author.
E-mail address:mheckwolf@geomar.de(M.J. Heckwolf).
1Sharedfirst author.
2Shared last author.
https://doi.org/10.1016/j.scitotenv.2020.142565
0048-9697/© 2020 The Authors. Published by Elsevier B.V. This is an open access article under the CC BY license (http://creativecommons.org/licenses/by/4.0/).
Contents lists available atScienceDirect
Science of the Total Environment
j o u r n a l h o m e p a g e :w w w . e l s e v i e r . c o m / l o c a t e / s c i t o t e n v
Contents
1. Introduction . . . 2
2. Material and methods . . . 2
2.1. Systematic literature search and selection . . . 2
2.2. Systematic extraction of information . . . 3
2.3. The Eco-GAME matrix . . . 3
2.4. Data visualization . . . 3
3. Results . . . 3
4. Discussion. . . 4
5. Conclusions . . . 9
Declaration of competing interest. . . 9
Acknowledgements . . . 9
References . . . 9
1. Introduction
Ecosystem services refer to the numerous benefits that humans de- rive from ecosystems (Danley and Widmark, 2016). Ecological values of ecosystem services are often placed on supporting and regulating ser- vices (e.g. habitat provision; waterfiltration; carbon storage & coastal protection) and interactions among them. Supporting, provisioning and regulating services create a foundation for socio-economic benefits that people derive from healthy ecosystems including recreational, cul- tural and aesthetic values. Economic values of ecosystem services, how- ever, are traditionally expressed in monetary units and assigned to the services themselves, i.e. to the consumable human benefit derived from the demand and the use of the service (de Groot et al., 2012;
Moos et al., 2019). Estimating economic outputs derived from coastal ecosystem services has proven to be useful for raising awareness, com- municating knowledge and prioritizing conservation measures due to easily relatable monetary values (Bagstad et al., 2013;Risén et al., 2017).
In light of the current global ecological crisis (Brand et al., 2020) there is an ever-increasing need to value how ecosystems support human well-being and identify, which management practices and poli- cies can help to reach sustainable development goals. Both terrestrial and aquatic ecosystems are under serious threat by increased human population resulting in cumulative impacts (e.g. development, pollu- tion, climate change) that degrade ecosystem functions and services (Glynn et al., 2018;Popp et al., 2017). For example, over the last century, 1/3 of the European seagrass area has been lost due to disease, deterio- rated water quality, and coastal development (de los Santos et al., 2019). More recently, the algal and bivalve beds have experienced sim- ilar losses (Beck et al., 2011;Steneck et al., 2002). To evaluate the impact of these losses, we need to understand their effect on the entire value chain from ecosystems via ecosystem service generation towards human well-being. Here, we utilize the concept of the value chain, a framework used to map and categorize processes that an ecosystem has to perform in order to deliver a valuable socio-economic product (i.e. goods and/or services) (Rawlins et al., 2018). To have a service (e.g. recreationalfishing) or good (e.g.fish) for people to enjoy, a whole set of ecological functions have to take place (e.g. spawning hab- itat provided by macroalgae or food web interactions). The concept of the value chain approach emphasizes the importance of each step (or intermediate good or service) on the provision of thefinal benefits. Un- derstanding the entire value chain from an ecosystem to the provided service is of utmost importance since management decisions have to target the ecosystem to preserve the providedfinal service.
The Baltic Sea—a marine region of significant socio-economic im- portance in the northern hemisphere—can serve as an excellent exam- ple and contribute towards a better quantification and valuation of coastal ecosystem services. This is because the Baltic stands out for pro- viding a strong scientific foundation and accessibility to long-term data series that enable planning for holistic, sustainable and forward-looking management (Reusch et al., 2018). However, current research indicates
that neither a common approach to classifying ecosystem services (Hummel et al., 2019) nor a widely accepted methodological frame- work for assessing their economic value exists (Sagebiel et al., 2016).
Here, we focus on coastal ecosystems, an area where the interests of various stakeholders are often the strongest. This is because the coastal population is disproportionately larger compared to other areas and coastal regions are a focal point for international transport and trade (Small and Nicholls, 2003). This puts coastal habitats under direct and indirect anthropogenic pressures that threaten the important ecosys- tem services they provide (Harley et al., 2006). By now, scientists have studied these ecosystems for decades resulting in a respectable knowl- edge base that presents a unique opportunity to synthesize existing in- formation and map ecosystem service benefits. Seagrasses, macroalgae and mussels are well-studied key coastal ecosystem elements for habi- tat provision, nutrient cycling, carbon storage and coastalfiltration glob- ally (Lovelock and Duarte, 2019;Norling and Kautsky, 2008). Blue mussels are of exceptional importance in mitigating eutrophication (Kotta et al., 2020;Rönnbäck et al., 2007). A rough estimate suggests that macroalgae could sequester a significant 173 TgC/yr of carbon (Krause-Jensen and Duarte, 2016). For seagrass-based ecosystems, a study estimated that it could contribute at least 31.5 million dollars to the annualfisheries economy in Australia (Jänes et al., 2020a). Further- more, cultivated bivalves are known to globally remove 49,000 t of ni- trogen and 6000 t of phosphorus with a potential value of $1.20 billion annually (van der Schatte et al., 2020). Important values of coastal ecosystems highlight the need to quantify and summarize eco- system services of macroalgae, seagrass and mussel beds in the Baltic with a systematic and unified approach.
Here, we integratedfive decades of published data (1971–2019) to synthesize the current knowledge of coastal ecosystem services and their values in the Baltic Sea with a main focus on seagrass, macroalgae and mussel beds. Specifically, our objectives were to (i) systematically gather and quantify the focus of studies about the ecological roles of seagrass, macroalgae and mussels; (ii) outline spatial variation of where ecosystem services have been mapped; (iii) assess current knowledge about ecosystem services and quantify the links between science and policy communication within the Baltic Sea and (iv) review the limitations as well as the potential for a wider application of studies that used economic valuation to address ecosystem services in the Baltic Sea.
2. Material and methods
2.1. Systematic literature search and selection
Following a systematic quantitative literature review approach of Pickering and Byrne (2014), we used ISI Web of Science (WoS) to iden- tify studies that investigated ecological services and valuation of seagrass, macroalgae and mussel beds in the Baltic Sea. The literature search was conducted on February 1, 2019, and was designed to identify
knowledge across the entire value chain, starting from single habitats providing ecosystem services progressing towards the derived socio- economic benefits. In WoS, a“Basic Search”selecting“All Databases” for“All years (1945-2019)”was applied. We formulated a search string that captured studies on coastal Baltic mussel beds, seagrass meadows or macroalgae that focused on ecosystem services in the Baltic Sea.
Our search string (see data availability statement) resulted in 3089find- ings. Since we are aware that the ecosystem service concept has changed over time, we made sure to also capture studies that did not mention the term“ecosystem service”specifically. Next, we carefully read each study and assessed whether the measured variables would be considered an ecosystem service by our current understanding of the ecosystem service concept. Therefore, we used a modified classifica- tion of ecosystem services from the Helsinki Commission (HELCOM, 2010). Grey literature was omitted from the downstream analysis.
The resulting hits were furtherfiltered based on four inclusion criteria. We included studies that (i) were carried out in the Baltic Sea, Skagerrak or Kattegat, (ii) investigated mussel beds, seagrass or macroalgae, (iii) provided original data (e.g. experimental, observa- tional or modelling but no reviews) and (iv) addressed ecosystem ser- vices. Since we were further interested in understanding the impact of anthropogenic pressures on the target habitats and associated impair- ments in ecosystem service provision under current and future climate conditions, we also included studies that (iv) addressed climate change effects on the target ecosystems. Atfirst, 20 papers were randomly se- lected and each paper was evaluated by everyone involved in the liter- ature review according to the workflow inFig. 1and the evaluation criteria (i)-(iv). Based on the evaluation results a Kappa test was carried out to test for similarity of the evaluations provided by thefive people.
Using the packageirr v0.84.1(Gamer et al., 2019) inR v3.6.1, this test re- sulted in a Kappa value of 0.793 (P< 0.001), which can be considered as
“substantial agreement”(Landis and Koch, 1977). Based on the high Kappa value, we felt confident to split the remaining papers among all 5 evaluators. Next, we examined the titles and the abstracts of all 3089 papers and excluded 2176 that did not fulfil our inclusion criteria (see Supplementary Table S1). In the subsequentfiltering process, the remaining 913 papers were read in detail and some were excluded when inclusion criteria were not met (Fig. 1). This systematic screening resulted in a total of 657 papers that fulfilled our inclusion criteria (see Supplementary Table S2).
2.2. Systematic extraction of information
The 657 selected papers contained information on study species, ecosystems and the type of ecosystem service provided. Further, the type of study design was categorized as observation, experimentation or modelling of data from an experimental facility or thefield. The spa- tial variation of ecosystem services was mapped following the Helsinki Commission (HELCOM) subdivisions of the Baltic Sea (2018), using the coordinates or regions the samples were taken from. For each paper, we extracted information on the start and end year of the inves- tigation and calculated the duration of the related studies. In case any
pressures were mentioned to affect the ecosystem and ultimately the ecosystem service provided, we extracted the type of pressure (e.g.
acidification, temperature change, boating/physical disturbance) and its effect on the ecosystem (see Supplementary Table S2). Further, we were interested if and how the ecosystem services were analyzed in terms of their impact on human well-being, especially through mone- tary (e.g. choice experiment, travel cost, abatement cost) or non- monetary (e.g. performance value, ratings/indices or quantitative/
qualitative ranking) valuation methods.
2.3. The Eco-GAME matrix
To assess the current state of knowledge and enhance communica- tion between science-policy interactions, ecosystem services were assessed according to the Eco-GAME matrix (Table 1). GAME stands for Governance Assessment Matrix Exercise (Sajeva et al., 2020), which is used as an evaluation tool in different contexts, such as sustain- ability, social learning, or ecosystem services. Based on expert opinions, the Eco-GAME matrix links ecological and socio-economic systems and evaluates the current level of knowledge within and between these sys- tems in four dimensions: natural, economic, human and social (Table 2, Supplementary Table S3). This is done by scoring how the studied eco- logical processes translate into ecosystem services in each publication (Table 1). The Eco-GAME matrix scores range from 0 (knowledge gap) to 7 (identification of a future vision and a policy to reach UN Sustain- able Development Goals) and each ecosystem service was scored in all four dimensions. For example, a study that assessed the biomass and monetary value of a mussel bed would be ranked as 3 (natural and eco- nomic dimension), while an additional quantification of impacts on human well-being is ranked as 4 (human and social dimension). Details on the scores within each dimension and examples can be found in the Supplementary Table S3. Ultimately, the Eco-GAME matrix provides a practical tool for assessing and categorizing the current state of knowl- edge about coastal ecosystem services in the Baltic Sea. By applying the Eco-GAME matrix, we can provide an overview of the robustness of both ecological and socio-economic knowledge to inform stakeholders about knowledge gaps that need to be addressed in order to proceed to- wards evidence-based sustainable decision-making.
2.4. Data visualization
All results were analyzed and plotted usingR v3.6.1. The packages ggplot2 v3.2.0(Wickham, 2016),cowplot v1.0.0(Wilke, 2019),maps v3.3.0(Deckmyn et al., 2018),PBSmapping v2.72.1(Schnute et al., 2019), mapproj v1.2.7 (McIlroy et al., 2020), reshape2 v1.4.3 (Wickham, 2007) anddplyr v0.8.3(Wickham et al., 2019) were used to visualize and reshape the raw data table (Supplementary Table S2).
3. Results
Overall, 1740 individual indicators of ecosystem services were re- corded (hereafter ecosystem service records, ESR). Several of the 657
Fig. 1.Workflow of systematic literature evaluation. The decisionflowchart displays the four criteria used during abstract and full text assessment forfiltering papers relevant to our objectives.
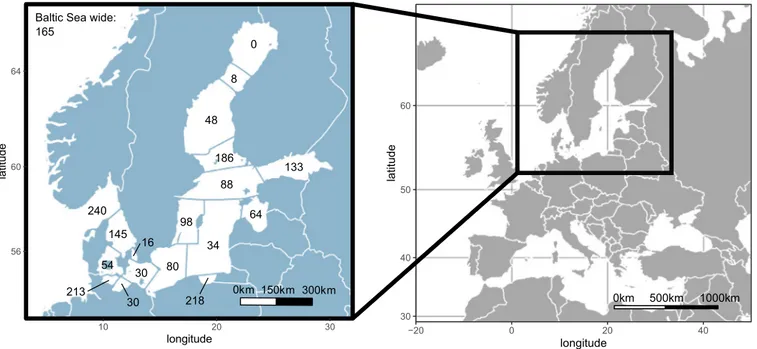
papers identified multiple ESR, since they investigated more than one ecosystem service or assessed more than one species (mean = 2.6 ESR/paper). The geographic locations of these 1740 ESR were unevenly distributed among the Baltic Sea HELCOM regions with some regions such as the Gdansk Basin (218 ESR) and the Kiel Bay (213 ESR) occur- ring more often compared to the Bothnian Bay (0 ESR), The Quark (8 ESR) or The Sound (16 ESR). Some studies covered more than one HELCOM region or were assessed Baltic Sea wide (Fig. 2).
The reviewed studies were conducted between the years 1883 and 2018 with a duration ranging from 1 to 60 years (Fig. 3A). Furthermore, 37 modelling studies were reviewed. Two of these modelled future sce- narios starting in 2050 and 2070, while others modelled periods of up to 100 years, starting in the present and reaching into 2100–2113. Out of the 1740 ESR, 1067 were related to macroalgae, 215 to seagrass and 458 to mussels (Fig. 3B). The higher number of studies addressing macroalgae or mussel beds compared to seagrass is likely related to their more frequent, and widespread occurrence in the Baltic Sea. In
total, 103 different genera were investigated, with the most common beingMytilus(mussel beds),Fucus(macroalgae) andZostera(seagrass).
In total, we identified 20 different ecosystem services related to macroalgae, seagrass and mussel beds in the Baltic Sea (Fig. 3C). These services included six provisioning, six regulating, seven supporting ser- vices but only one cultural service (Fig. 3C,Table 3). The cultural service was“education and scientific information”, as species were used as bio- markers or bioindicators for nutrients or toxins. The most frequently re- ported ecosystem services were the provisioning service“raw material” (533 ESR), the supporting service“providing habitat”(262 ESR) and the regulating service“regulation of pollutants”(215 ESR).“Education and scientific information”, the only cultural service, resulted in 169 ESR.
The meta-evaluation via the Eco-GAME matrix revealed a strongly skewed knowledge distribution towards the natural dimension mostly reaching a knowledge level of 3 and 4, while the other dimensions were mostly scored between 0 and 2. This outcome was expected, con- sidering that we investigated the value chain of ecosystem services starting from the species level, which is often not directly considered in studies with a socio-economic focus. For the natural dimension, this means that most ecosystem services were quantitatively assessed (Eco-GAME score 3) and their interactions with other ecosystem ele- ments and/or dimensions (Eco-GAME score 4) are established. For in- stance, we have a quantitative understanding of the biomass/raw material that is provided and how this biomass is used by other organ- isms as habitat and food or utilized by humans as biomedical products or in human food production. However, for most of these ecosystem services, we identified a knowledge gap in the value chain towards as- sessments of economic, societal and individual values (score 0). Only for 140 ESR was a qualitative understanding of potential economic values reached resulting in a score of 2 in the economic dimension.
The evaluated study byRisén et al., 2017obtained the highest Eco- GAME matrix scores (economic dimension: 6, natural dimension: 5, so- cial dimension: 4, human dimension: 4) as it defined future goals for the use of macroalgae biomass in the form of beach cast removal.
For many ESR a qualitative understanding (score 2) of the collective (687 on social dimension) and individual (678 on human dimension) human preferences and needs was reached. While most provisioning and supporting services were scored 0 (no knowledge) in the human and social dimension, cultural services were by definition always scored 2 (qualitative knowledge). Regulating services were most often scored 2 in both dimensions. Another study that obtained high Eco-GAME matrix scores (Lindegarth et al., 2014) assessed different management scenar- ios of macroalgae (Fucus vesiculosus) and seagrass (Zostera marina), which provide food and habitat for other organisms and further pro- motefisheries. This study was scored 5 (multi-dimensional interaction knowledge) on the human dimension, because humans use this ecosys- tem service and adjust their management accordingly.
We identified a total of 38 pressures impacting ecosystem services (Fig. S1, Table S2). As pressures, we considered any direct (e.g.
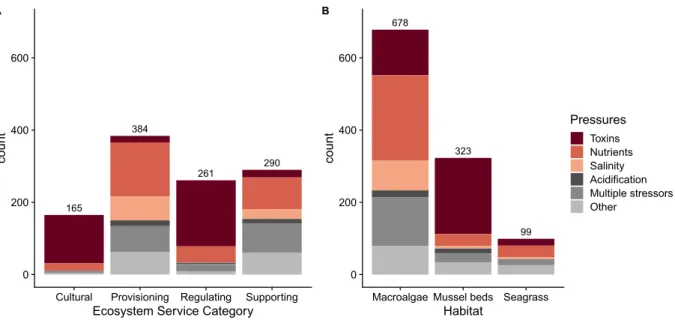
boating/physical disturbance) or indirect (e.g. acidification, warming) anthropogenic effects. Out of the 1740 ESR, 1100 were assessed in the context of pressures on species and the services they provide. The most commonly addressed pressures in the context of coastal ecosys- tem services in the Baltic Sea were toxins (356), nutrients (302) and the change in salinity (94) as predicted for this region (Meier et al., 2006). Multiple stressors with potential interacting effects have been assessed in the context of 177 ESRs. Here, it is important to note that the most recurrent assessed pressures might not necessarily represent the most severe threats to coastal ecosystems and their services (Fig. 5).
4. Discussion
This study systematically reviewed Baltic Sea mussel bed, macroalgal and seagrass habitats and meta-evaluated their associated ecosystem services along natural and socio-economic dimensions.
Among 657 papers in total, we quantified how well links between Table 1
Eco-GAME matrix scoring system for the level of knowledge on ecosystem services (adapted fromSajeva et al., 2020). For the detailed information see also supplementary Table S3.
Eco-GAME levels of knowledge on ecosystem service
Definition Description Score
Knowledge on human-nature system integration for policy purposes
The paper produced metrics to practically and effectively assessed performances according to UN Sustainable Development Goals (SDGs)
7
Knowledge is sufficient for forecasting
The paper forecasted future systemic impacts of ecosystem services across multiple dimensions (economic, human, social and natural)
6
Knowledge on dynamic multi-dimensional interactions
The paper evaluated systemic impacts of ecosystem services across multiple dimensions (economic, human, social and natural)
5
Knowledge on dynamic uni-dimensional interaction
The paper evaluated systemic impacts of ecosystem services within one dimension
4
Quantitative knowledge The paper assessed quantitative aspects of ecosystem services within one dimension
3
Qualitative knowledge The paper assessed qualitative aspects of ecosystem services within one dimension
2
Limited knowledge The paper discovered a potential ecosystem service
1 No knowledge The authors are unaware of ecosystem
service implications within this dimension
0
Table 2
Dimension along which the Eco-GAME matrix scoring is conducted.
Dimension Definition Future vision to support human
well-being Natural Natural resources and goods
provided to nature, the economy and the society.
Utilizing natural resources to achieve management goals: e.g.
to reduce X tons of nutrients we can use Y mussel farms.
Economic Economic (monetary and non-monetary) value of natural resources and goods.
Reliable price valuation of resources and needs allows for an efficient resource allocation in sustainable management.
Human Human needs and individual choices affected by natural resources and goods.
Consideration of human needs and impacts of ecosystem services on human well-being.
Social Collective preferences (including policy-making) affected by natural resources and goods.
Including natural resource availability and vulnerability into social decision-making.
56 60 64
10 20 30
longitude
latitude
0km 150km 300km Baltic Sea wide:
165
30 40 50 60
−20 0 20 40
longitude
latitude
0km 500km 1000km 0
8
48
186 88
133
64 34 98
80 218 30
30 213
145 240
54 16
Fig. 2.Spatial distribution of ecosystem service indicators. HELCOM regions and the number of ecosystem service indicators per region are displayed in the map of the Baltic Sea area. 165 were Baltic Sea wide and for ten the region was not specified. Some ecosystem service indicators spanned several regions and were thus counted multiple times.
0 50 100 150 200
1880 1920 1960 2000 2040 2080 Start.Year
count
A 440
34 36 41 48 52 54 65
125 151
314 380
0 100 200 300 400
Other
Pilayella Ceramium not specified Polysiphonia Ulva Furcellaria Enteromorpha Cladophora Zostera Fucus Mytilus
count B
169
6 7 12
18 22
533
1 6
10 35
77
216
28 28 35
38 70
167
262
0 200 400
Education and scientific information
Resources for biotechnology Feed production Fertilizer Food production Biomedical product Raw material
Halocarbon retention pH regulation Sediment retention Carbon sequestration Nutrient cycling Regulation of pollutants
Food web dynamics Promoting fisheries Maintenance of resilience Primary production Supporting biodiversity Food for organisms Providing habitat
count C
Habitat Macroalgae Mussel beds Seagrass
Habitat Macroalgae Mussel beds Seagrass
Supporting Provisioning
Regulating Cultural
20 ecosystem services
Fig. 3.Number of ecosystem services for each target habitat. (A) The starting year of the studies and the number of ecosystem services assessed (count) per habitat. Studies that have a starting year in the future reflect modelling approaches. The apparent decrease in studies after 2013/2014 is driven by the fact that the duration of these studies (mean = 5.8 years;
median = 1 year) together with the publishing process causes a time lag. (B) Barplot shows the number of ecosystem services (count) identified for the 10 most common genera and the habitat they belong to. In 41 cases the genus was not specified. The remaining 440 genera were summarized in the bar“other”. (C) Twenty identified ecosystem services emerging from seagrass, macroalgae and mussel beds.
ecosystems and their derived socio-economic benefits were established.
To this end, we scored the level of interaction between natural and socio-economic dimensions and the applicability for management prac- tices and policies using the Eco-GAME matrix. This analysis revealed rel- atively good quantitative information on the ecological foundation of ecosystem services (Eco-GAME scores 2–3,Fig. 4). At the same time, the knowledge status on the complete value chain from the ecosystem to the derived socio-economic benefits and potential management im- plications was poor (Eco-GAME scores 4–7). In the following para- graphs, we outline all ecosystem services that were identified, elaborate on the missing links within the value chain and propose a framework to overcome these issues.
Of the 20 different ecosystem services identified in this survey, macroalgae were recognized to provide 19 ecosystem services with seagrass and mussel beds each providing 15 (Fig. 3C,Table 3). All three coastal habitats provide a variety of raw materials in the form of biomass, chemical and genetic resources and other organisms make use of this biomass as food or habitat. In total, only a small amount of ESR were related to seagrass (13%) despite a growing recognition of their role in carbon storage and sequestration (Duarte et al., 2005;
Röhr et al., 2016), coastal protection (Fonseca and Cahalan, 1992;Orth et al., 2006) andfisheries production (Jänes et al., 2020a;Jänes et al., 2020b). We are specifically lacking information on the extent to which seagrass meadows can be utilized in food and feed production, as fertil- izer or in biomedical products. In food production for humans, the other coastal ecosystems play a key role since they can be directly consumed or processed and used in agar production (Tuvikene et al., 2010). In ag- riculture and aquaculture, macroalgae can be used as feed for pigs
(Michalak et al., 2015) and as a mineral feed supplement for livestock (Chojnacka, 2008), while mussels can be used as feed forfish and hens (Carlberg et al., 2015; Carlberg et al., 2018; Jönsson, 2009;
Vidakovic et al., 2016). Baltic seagrass and mussel beds are involved in sediment retention through biodeposition and erosion control (Alexandrowicz, 1977;Joensuu et al., 2018;Reusch et al., 1994). How- ever, it has been shown thatfilamentous and small branched algae can also increase sediment retention in the northern Great Barrier Reef (Purcell, 2000) indicating a potential role for Baltic macroalgae.
Thus far, within the Baltic Sea, only macroalgae have been investigated for their properties to serve as biomedical products. For example, the extracts of macroalgae show antimicrobial and anti-inflammatory activ- ity (Goecke et al., 2012;Grünewald et al., 2009), and inhibit the viability of pancreatic cancer cell lines (Geisen et al., 2015). Interestingly, seagrass species from the South East Coast of India have shown antibi- otic activity against human pathogenic bacteria and fungi (Ravikumar et al., 2010). In Portugal, the eelgrassZostera marinahas been shown to selectively decrease the viability of tumorous neuronal cells (Custódio et al., 2016). Considering thesefindings, we argue that there is a great potential for the use of marine natural products of seagrass from the Baltic Sea in thefield of biomedicine. Considering biotechno- logical products, macroalgae, also in the form of beach cast, have shown a potential application as biogas and biofuel (Barbot et al., 2015;Bucholc et al., 2014;Kaspersen et al., 2016;Plis et al., 2015;
Risén et al., 2014;Wollak et al., 2018), while seagrass and mussels can be utilized for biomethane production (Kaspersen et al., 2016;Wollak et al., 2018). While we identified 20 important ecosystem services of coastal Baltic ecosystems that support human needs and well-being, Table 3
Ecosystem service classification modified fromHELCOM (2010). This table summarizes the 20 coastal ecosystem services identified in the Baltic Sea, describes them and names the asso- ciated Baltic habitats (MA–indicates macroalgae, SM–indicates seagrass meadows, MB–indicates mussel beds). Global literature examples indicate further knowledge gaps on Baltic coastal ecosystems and the services they provide.
Ecosystem service Description Associated
Baltic habitat
Global examples indicating knowledge gaps
Cultural
Education and scientific information
Biomarkers and bioindicators, mostly used for monitoring purposes MA, SM, MB
Provisioning
Biomedical products Any material that is extracted from the marine organisms that show medicinal benefits and potential for pharmaceutical use,“blue pharmacy”
MA SM–Southern Portugal (Custódio et al., 2016); MB–USA (Stewart et al., 2011) Feed production Using biomass as feed for agriculture or aquaculture MA, MB SM–Australia (Torbatinejad et al., 2007) Fertilizer Using dried biomass, extracted chemicals or bioactive compounds as fertilizer in
agriculture
MA, MB SM–Zanzibar (de la Torre-Castro and Rönnbäck, 2004)
Food production Using marine fauna orflora for human food. E.g. Mussel farming;Furcellaria biomass for agar production
MA, MB SM–India and Kenya (Green et al., 2003) Raw material General biomass, bioactive compounds, chemical resources, genetic resources,
metabolites
MA, SM, MB
Resources for biotechnology Biofuel, biogas and biomethane production MA, SM, MB
Regulating
Carbon sequestration Carbon sequestration, uptake and sink MA, SM MB–China (Tang et al., 2011)
Halocarbon retention Storage of halocarbon MA SM–Portugal (Weinberg et al., 2015)
pH regulation pH changes and regulation MA, SM
Nutrient cycling Reduction of eutrophication, retention and uptake MA, SM, MB
Regulation of pollutants Activities that improve the water quality and purification. Accumulation of viruses, toxic and hazardous substances etc.
MA, SM, MB Sediment retention Erosion control, bioturbation and biodeposition that change sediments
characteristics and improves sediment stability
SM, MB MA–Great Barrier Reef (Purcell, 2000)
Supporting
Food for organisms Providing food for other marine organisms, but also for marine birds MA, SM, MB Food web dynamics Changing predation dynamics, consumption, abundance, and biomass of species MA, SM, MB
Providing habitat Providing habitat for several other marine species MA, SM, MB
Maintenance of resilience Supporting and maintaining ecosystem functioning, recovery and stability.
Maintenance of resilience and geneflow
MA, SM, MB
Primary production Photosynthesis, oxygen production MA, SM
Promotingfisheries Nursing and spawning grounds forfish, positive impacts onfish abundance MA, SM, MB Supporting biodiversity Supporting and maintainingfloral and faunal diversity MA, SM, MB
the studies mentioned above, particularly on seagrass, indicate that many more are currently not recognized.
The information about ecosystem services is unevenly distributed geographically, with clear research hotspots in the western and central Baltic such as Gdansk and Kiel Bay (Fig. 2), similar results have been found previously (Sagebiel et al., 2016). At the same time, there were only a few studies from the northern Baltic Sea. While a reduced num- ber of studies in the margins of the Baltic Sea might partially be ex- plained by the lack of some of our target species in these regions (seagrass and mussels), research hotspots were observed close to re- search institutions. Such uneven spatial resolution has important impli- cations as the Baltic Sea is characterized by a multitude of gradients and its sub-basins strongly differ from each other (Ojaveer et al., 2010).
Therefore, if some areas are understudied we are not able to character- ize ecosystem services and make scenario-specific predictions in those areas.
Considering the ongoing intensification and diversification of human pressures, we must further understand how different ecosystem
elements are linked and how vulnerable they are to direct and indirect anthropogenic pressures. Experimental studies can help us in this en- deavor since they allow us to build cause-effect relationships and pre- dict spatiotemporal patterns of ecosystem services. Overall, we encountered a high proportion of experimental studies (>90%) com- pared to any other type of study (field study or modelling approach).
However, these experiments mostly dealt with one or two species at a time, leaving most links within the natural system understudied. Fur- ther, only 70 out of 1740 ESR were assessed with multiple pressures in an experimental context. Our systematic assessment of ecosystem vulnerability identified excess nutrients together with toxic substances to be among the major pressures with high impact on the Baltic Sea eco- systems (Andersen et al., 2011;Conley et al., 2007;Korpinen et al., 2012). Anthropogenic nutrient inputs and associated eutrophication re- sult in the loss of keystone macroalgae and seagrass, rapid growth offil- amentous algae, decreased water transparency, and cause anoxia that often leads to the collapse of benthic communities (Andersen et al., 2011;Baden et al., 2012;Conley et al., 2007;Korpinen et al., 2012;
1519
71140
9 1
462 1277
1
992
60 687
1
998
59 678
1 4 Economic Scoring System Natural Scoring System Social Scoring System Human Scoring System
0 1 2 3 4 5 6 0 1 2 3 4 5 6 0 1 2 3 4 5 6 0 1 2 3 4 5 6
0 500 1000 1500
Eco−GAME matrix evaluation scores
count
Cultural Provisioning Regulating Supporting ES Category
Fig. 4.Eco-GAME matrix results. The Eco-GAME evaluation scores are shown on the x-axis and separately for the four dimensions: economic, natural, social and human. The color distinguishes ecosystem service categories: cultural, provisioning and regulating and supporting. The number of ecosystem service records (ESR) per Eco-GAME score and category is displayed in counts on the y-axis. (For interpretation of the references to color in thisfigure legend, the reader is referred to the web version of this article.)
165
384
261
290
0 200 400 600
Cultural Provisioning Regulating Supporting Ecosystem Service Category
count
A
678
323
99
0 200 400 600
Macroalgae Mussel beds Seagrass Habitat
count
B
Pressures Toxins Nutrients Salinity Acidification Multiple stressors Other
Fig. 5.Pressures affecting coastal habitats and their services. The number of ecosystem service records (ESR) per ecosystem service category and habitat is displayed as count on the y-axis.
Thefive most common direct and indirect anthropogenic pressures are displayed in color (Toxins - toxic waste loading, Nutrients - nutrient loading, Salinity - reduction in salinity due to climate change, Acidification - increase in seawater acidity due to climate change, Multiple stressors - study design involved more than one stressor) and the remaining pressures are summarized in the category“Other”. For the fullfigure with all pressures see supplementary Fig. 1. (For interpretation of the references to color in thisfigure legend, the reader is referred to the web version of this article.)
Nielsen et al., 2003;Schubert et al., 2013). By taking up nutrients andfil- tering plankton, seagrass, macroalgae and mussel beds increase water clarity and counteract eutrophication (Austin et al., 2017;Kotta et al., 2020;Lindahl et al., 2005). This ecosystem service can actively be used through, for instance, mussel farming, which has been shown to remove up to 1000 t of nitrogen and 70 t of phosphorus per year (Schernewski et al., 2012). As a result of increased nutrient loads, the biomass of macroalgae and mussel species can increase in certain areas, for in- stance, at sewage treatment plants (Anger, 1977; Berezina et al., 2017). Furthermore, healthy ecosystems can contribute to the mainte- nance of ecosystem resilience by increasing community variability and stability (Kraufvelin, 2007), supporting recolonization (Anthony and Svane, 1995) and promoting geneflow (Arroyo et al., 2006). However, sensitive species vanish quickly when turbidity increases resulting in decreased biodiversity, which in turn reduces ecosystem resilience and impairs ecosystem services (Hansen and Snickars, 2014;Oliver et al., 2015). In the context of ecosystem services, the pollution with toxins and hazardous substances constitutes a severe threat (Bełdowska et al., 2015;Mazur-Marzec et al., 2007;Olenycz et al., 2015;Railo et al., 2018). These substances not only accumulate in mus- sels, macroalgae and seagrass, which constantly take them up from the water, but also enter the food web ultimately affecting humans (Stoeppler and Brandt, 1979). Overall, this highlights an urgent need to curb pollution and reduce other pressures on the Baltic Sea ecosys- tems and approach a good environmental status (GES) as a prerequisite for humans to benefit from the full range of ecosystem services.
Understanding the value of ecosystem services has been proven to be important for decision making (Watson et al., 2016) and useful for raising awareness and communicating complex knowledge to the wider public (Bagstad et al., 2013;Risén et al., 2017). By anchoring our literature search on three coastal habitats we found that only eight studies (1.2%) investigated the entire value chain by applying eco- nomic valuation methods to link the ecosystems via their provided ser- vices with the derived socio-economic benefits. Thisfinding is in line with a previous review concluding that Baltic marine ecosystem ser- vices have rarely been economically valued (Sagebiel et al., 2016). Fur- thermore, this knowledge gap is even apparent in the ecosystem service classification systems, which miss the connection between ecological and socio-economic attributes (Hummel et al., 2019). Considering this issue, we assessed the methodological approaches to economic valua- tion used in these eight papers in more detail (Table 4). While all eight studies have made a great effort to evaluate ecosystem services,
most of them could only cover a section of the value chain from ecosys- tems to socio-economic benefits. This also demonstrates the lack of data and the complexity of ecological functions. Additional attempts to link ecological properties with socio-economic measures have been made by some recent studies capturing people's perceptions, choices and willingness-to-pay for maintaining or enhancing marine ecosystem ser- vices (Ahtiainen et al., 2014;Bateman et al., 2011; Kosenius and Markku, 2015). Since human perceptions are often affected by cultural aspects (Ahtiainen et al., 2014), past experiences or education, we argue that these methods will need to be backed-up by integrative as- sessments allowing for a more objective service valuation. Therefore, re- search efforts need to be devoted to addressing the interface between ecosystem biology and functional biodiversity research and how this translates into concrete societal implications including economic bene- fits. More specifically, if we want to develop appropriate valuation stud- ies and deliver the results in policies, it is fundamental to better understand the contribution of different species to provide various eco- system services and the roles of environmental factors to modulate the intensities of these services (e.g. seagrasses to capture and store carbon;
(Röhr et al., 2016;Stål et al., 2008)). This makes an economic valuation of supporting and regulating ecosystem services and intermediate goods much more challenging but of utmost importance compared to the valuation offinal provisioning services (Beaumont et al., 2007).
We suggest that any future quantitative information on ecosystem services in the Baltic Sea should be combined with socio-economic in- formation, with the ultimate goal to transfer knowledge among disci- plines. In particular, we recommend to consider the following issues:
(i) knowledge on ecosystem services in the Baltic Sea and elsewhere could be assessed using Eco-GAME or similar tools to systematically map best practices for interdisciplinary knowledge transfer; (ii) the inter- dependencies of ecosystem elements in generating a service need to be evaluated; (iii) methodologies need to be applied systematically within but also between scientificfields to assess how ecosystems translate into socio-economic benefits via the functions and services they provide;
(iv) data-driven and easy-to-use tools of cumulative impact assessment of human pressures on ecosystem services should be developed that can inform managers and policy makers (Franke et al., 2020).
For instance, a recent Mapping Ocean Wealth project in Australia (Carnell et al., 2019) provides a great conceptual example how existing information about ecosystems and ecological processes was used to construct spatially explicit mathematical models with a capability of predicting the social and economic benefits provided by coastal
Table 4
Summary table on economic valuation methods that have been used to link the studied habitats (seagrass, mussels, macroalgae) via their provided services with the derived socio-eco- nomic benefits.
Economic valuation method
Definition Context References
Market price The market price method uses the prices of goods and services that are bought and sold in commercial markets to determine the value of an ecosystem service.
Provisioning ecosystem services (e.g. mussels) used in food production have markets, and market prices can be used for valuation.
(Gren et al., 2009;
Lindahl et al., 2005;
Schernewski et al., 2012)
Preference-based methods
The revealed preference approaches extrapolate the individual willingness to pay or accept by examining the choices that they make within a market. The stated preference approaches of ecosystem valuation survey individuals tofind out what they state as their value of the ecosystem attributes, good, and services.
Non-market ecosystem services provide immediate benefits (or harms) to people and here revealed preference quantify value (of e.g. beach cast removal or good water quality) through actual behavior and stated preference through potential futures.
(Lindegarth et al., 2014;Risén et al., 2017;Stål et al., 2008)
Cost-based methods
Cost-based methods estimate values based on the costs of avoiding damages due to lost services, the cost of replacing environmental assets, or the cost of providing substitute goods.
Quantifying land- and sea-based mitigation measures to reduce adverse effects of eutrophication showed that mussel farming is a cost-efficient abatement method in terms of net cost saving.
Suitable to evaluate intermediate goods and services.
(Gren et al., 2018)
Interdisciplinary methods
Insights from ecology and environmental economics are synthesized to provide a unifying perspective of the value of ecosystem services.
Valuing ecosystem services by quantifying the linkage between human-induced pressures, habitat characteristics, ecological functions and services they provide.
(Lindegarth et al., 2014;Stål et al., 2008) Benefit transfer Available information from other studies and/or other areas are
transferred to estimate economic values of ecosystem services.
The value of carbon storage and sequestration capacity of Baltic Sea seagrass meadows was partly based on ecological and economic parameters from other regions.
(Röhr et al., 2016)
ecosystems. This model was subsequently applied in the context of car- bon sequestration andfisheries production. Based on the Eco-GAME analysis matrix, the Mapping Ocean Wealth project would have been the highest-scoring individual study effectively transferring knowledge between natural, economic, social and human dimensions. As such it provides a robust framework that can be adapted for use in the Baltic Sea and globally.
5. Conclusions
Science-based decisions on the sustainable management of ecosys- tems and the services they provide require a deep understanding of the inter-relationships between ecosystems, natural and social sciences and how these impinge upon human well-being. By synthesizing infor- mation on ecosystem services provided by coastal Baltic Sea ecosys- tems, this study has contributed to the growing need for integrative data for sustainable marine resource management. Despite the signifi- cant amount of extracted information, only 8 out of 657 studies pro- vided insights into the links between ecosystems, services and the socio-economic benefits. Furthermore, these studies differed in terms of economic valuation methods, highlighting the lack of a systematic methodological framework, measuring cross-comparable units, that could inform collective decision-making. To close this knowledge gap, we propose an analytical framework that is capable of directly linking existing quantitative information about ecosystem service generation with human benefit and informs policy makers for meeting the UN Sus- tainable Development Goals.
Supplementary data to this article can be found online athttps://doi.
org/10.1016/j.scitotenv.2020.142565.
Declaration of competing interest
The authors declare that they have no known competingfinancial interests or personal relationships that could have appeared to influ- ence the work reported in this paper.
Acknowledgements
This article has been realized as a deliverable 4.1 of the BONUS MARES project, funded by the EU within the joint Baltic Sea research and development program (Art. 185). We further thank all members of the MARES team, the expert platform participants and everyone in- volved in the MARES project for fruitful discussions and cross- disciplinary explanations to improve our manuscript. We thank Mark Lemon for this feedback on the manuscript.
Data availability statement
Additional tables andfigures can be found in the supplementary in- formation and the R code, the raw data table, the kappa test data and the search string are available on GitHub (https://github.com/M-Heckwolf/
BONUS_MARES_coastal_ecosystem_services).
References
Ahtiainen, H., Artell, J., Czajkowski, M., Hasler, B., Hasselström, L., Huhtala, A., et al., 2014.
Benefits of meeting nutrient reduction targets for the Baltic Sea–a contingent valua- tion study in the nine coastal states. Journal of Environmental Economics and Policy 3, 278–305.
Alexandrowicz, S.W., 1977.A quantitative study of the origin of dreissena polymorpha shell accumulations in Szczecin Bay Baltic Sea. Bulletin de l’Academie Polonaise des Sciences Serie des Sciences de la Terre 25, 75–82.
Andersen, J.H., Axe, P., Backer, H., Carstensen, J., Claussen, U., Fleming-Lehtinen, V., et al., 2011.Getting the measure of eutrophication in the Baltic Sea: towards improved as- sessment principles and methods. Biogeochemistry 106, 137–156.
Anger, K., 1977.Benthic invertebrates as indicators of organic pollution in the Western Baltic Sea. Internationale Revue der gesamten Hydrobiologie und Hydrographie 62, 245–254.
Anthony, K.R., Svane, I., 1995.Effects of substratum instability on locomotion and pedal laceration in Metridium senile (Anthozoa: Actiniaria). Mar. Ecol. Prog. Ser. 124, 171–180.
Arroyo, N.L., Aarnio, K., Bonsdorff, E., 2006.Drifting algae as a means of re-colonizing defaunated sediments in the Baltic Sea. A short-term microcosm study.
Hydrobiologia 554, 83.
Austin, Å.N., Hansen, J.P., Donadi, S., Eklöf, J.S., 2017.Relationships between aquatic vegetation and water turbidity: afield survey across seasons and spatial scales.
PLoS One 12.
Baden, S., Emanuelsson, A., Pihl, L., Svensson, C.-J., Åberg, P., 2012.Shift in seagrass food web structure over decades is linked to overfishing. Mar. Ecol. Prog. Ser. 451, 61–73.
Bagstad, K.J., Semmens, D.J., Waage, S., Winthrop, R., 2013.A comparative assessment of decision-support tools for ecosystem services quantification and valuation. Ecosys- tem Services 5, 27–39.
Barbot, Y.N., Thomsen, L., Benz, R., 2015. Thermo-acidic pretreatment of beach macroalgae from Rügen to optimize biomethane production—double benefit with si- multaneous bioenergy production and improvement of local beach and waste man- agement. Marine Drugs 13, 5681–5705.
Bateman, I.J., Brouwer, R., Ferrini, S., Schaafsma, M., Barton, D.N., Dubgaard, A., et al., 2011.
Making benefit transfers work: deriving and testing principles for value transfers for similar and dissimilar sites using a case study of the non-market benefits of water quality improvements across Europe. Environ. Resour. Econ. 50, 365–387.
Beaumont, N., Austen, M., Atkins, J., Burdon, D., Degraer, S., Dentinho, T., et al., 2007.Iden- tification, definition and quantification of goods and services provided by marine bio- diversity: implications for the ecosystem approach. Mar. Pollut. Bull. 54, 253–265.
Beck, M.W., Brumbaugh, R.D., Airoldi, L., Carranza, A., Coen, L.D., Crawford, C., et al., 2011.
Oyster reefs at risk and recommendations for conservation, restoration, and manage- ment. Bioscience 61, 107–116.
Bełdowska, M., Jędruch, A., Słupkowska, J., Saniewska, D., Saniewski, M., 2015.
Macrophyta as a vector of contemporary and historical mercury from the marine en- vironment to the trophic web. Environ. Sci. Pollut. Res. 22, 5228–5240.
Berezina, N.A., Gubelit, Y.I., Polyak, Y.M., Sharov, A.N., Kudryavtseva, V.A., Lubimtsev, V.A., et al., 2017.An integrated approach to the assessment of the eastern Gulf of Finland health: a case study of coastal habitats. J. Mar. Syst. 171, 159–171.
Brand, U., Görg, C., Wissen, M., 2020.Overcoming neoliberal globalization: social- ecological transformation from a Polanyian perspective and beyond. Globalizations 17, 161–176.
Bucholc, K., Szymczak-Żyła, M., Lubecki, L., Zamojska, A., Hapter, P., Tjernström, E., et al., 2014.Nutrient content in macrophyta collected from southern Baltic Sea beaches in relation to eutrophication and biogas production. Sci. Total Environ. 473, 298–307.
Carlberg, H., Cheng, K., Lundh, T., Brännäs, E., 2015.Using self-selection to evaluate the ac- ceptance of a new diet formulation by farmedfish. Appl. Anim. Behav. Sci. 171, 226–232.
Carlberg, H., Lundh, T., Cheng, K., Pickova, J., Langton, M., Gutiérrez, J.L.V., et al., 2018.In search for protein sources: evaluating an alternative to the traditionalfish feed for Arctic charr (Salvelinus alpinusL.). Aquaculture 486, 253–260.
Carnell, P., Reeves, S., Nicholson, E., Macreadie, P., Lerodiaconou, D., 2019.Young M, et al.
Mapping Ocean Wealth Australia, The value of coastal wetlands to people and nature.
The Nature Conservancy, Melbourne.
Chojnacka, K., 2008.Using biosorption to enrich the biomass of seaweeds from the Baltic Sea with microelements to produce mineral feed supplement for livestock. Biochem.
Eng. J. 39, 246–257.
Conley, D.J., Carstensen, J., Ærtebjerg, G., Christensen, P.B., Dalsgaard, T., Hansen, J.L., et al., 2007.Long-term changes and impacts of hypoxia in Danish coastal waters. Ecol. Appl.
17, S165–S184.
Custódio, L., Laukaityte, S., Engelen, A.H., Rodrigues, M.J., Pereira, H., Vizetto-Duarte, C., et al., 2016.A comparative evaluation of biological activities and bioactive compounds of the seagrasses Zostera marina and Zostera noltei from southern Portugal. Nat.
Prod. Res. 30, 724–728.
Danley, B., Widmark, C., 2016.Evaluating conceptual definitions of ecosystem services and their implications. Ecol. Econ. 126, 132–138.
de Groot, R., Brander, L., van der Ploeg, S., Costanza, R., Bernard, F., Braat, L., et al., 2012.
Global estimates of the value of ecosystems and their services in monetary units. Eco- system Services 1, 50–61.
de la Torre-Castro, M., Rönnbäck, P., 2004.Links between humans and seagrasses—an ex- ample from tropical East Africa. Ocean & Coastal Management 47, 361–387.
de los Santos, C.B., Krause-Jensen, D., Alcoverro, T., Marbà, N., Duarte, C.M., van Katwijk, M.M., et al., 2019.Recent trend reversal for declining European seagrass meadows.
Nat. Commun. 10, 1–8.
Deckmyn, A., Minka, T., Brownrigg, R., Wilks, A., Becker, R., 2018.Maps: Draw Geograph- ical Maps. R Package Version 3.3.0.
Duarte, C.M., Holmer, M., Marbà, N., 2005.Plant-microbe interactions in seagrass meadows. Interact. Macro Microorg. Marine Sediments 31–60.
Fonseca, M.S., Cahalan, J.A., 1992.A preliminary evaluation of wave attenuation by four species of seagrass. Estuar. Coast. Shelf Sci. 35, 565–576.
Franke, A., Blenckner, T., Duarte, C.M., Ott, K., Fleming, L.E., 2020.Antia A, et al.
Operationalizing Ocean Health, Toward Integrated Research on Ocean Health and Re- covery to Achieve Ocean Sustainability. One Earth.
Gamer, M., Lemon, J., Gamer, M.M., Robinson, A., Kendall's, W., 2019. irr: Various Co- efficients of Interrater Reliability and Agreement.https://CRAN.R-project.org/
package=irr.
Geisen, U., Zenthoefer, M., Peipp, M., Kerber, J., Plenge, J., Managò, A., et al., 2015.Molec- ular mechanisms by which a Fucus vesiculosus extract mediates cell cycle inhibition and cell death in pancreatic cancer cells. Marine Drugs 13, 4470–4491.