• Keine Ergebnisse gefunden

AT M O S P H E R I C WAT E R S U P P LY T O T H E ATA C A M A D E S E R T F R O M N E W LY D E V E L O P E D S AT E L L I T E R E M O T E S E N S I N G T E C H N I Q U E S A N D R E A N A LY S I S i n a u g u r a l – d i s s e r t a t i o n zur erlangung

N/A
N/A
Protected

Academic year: 2021

Aktie "AT M O S P H E R I C WAT E R S U P P LY T O T H E ATA C A M A D E S E R T F R O M N E W LY D E V E L O P E D S AT E L L I T E R E M O T E S E N S I N G T E C H N I Q U E S A N D R E A N A LY S I S i n a u g u r a l – d i s s e r t a t i o n zur erlangung "

Copied!
246
0
0

Wird geladen.... (Jetzt Volltext ansehen)

Volltext

(1)

AT M O S P H E R I C WAT E R S U P P LY T O T H E ATA C A M A D E S E R T F R O M N E W LY D E V E L O P E D S AT E L L I T E R E M O T E S E N S I N G

T E C H N I Q U E S A N D R E A N A LY S I S

i n a u g u r a l – d i s s e r t a t i o n zur

erlangung des doktorgrades

der mathematisch -naturwissenschaftlichen fakultät der universität zu köln

vorgelegt von C H R I S T O P H B Ö H M

aus halle ( saale)

köln , 2020

(2)

Prof. Dr. Stephanie Fiedler Prof. Dr. Jörg Bendix

tag der mündlichen prüfung:

22.01.2021

Diese Arbeit wurde von der Mathematisch-Naturwissenschaftlichen

Fakultät der Universität zu Köln im Jahr 2021 als Dissertation angenomme-

nen.

(3)

A B S T R A C T

Many facets of atmospheric water supply to the Atacama Desert are poorly understood. However, in-depth knowledge regarding water availability, moisture sources and the underlying mechanisms is re- quired to investigate biological and geological processes and to identify potential mutual relationships.

This thesis provides a comprehensive meteorological perspective on the atmospheric water supply to the Atacama Desert within the context of the recent climate. Spatial and temporal variability of moisture as well as their controlling mechanisms depend on the type of water supply, i. e. clouds, water vapor, fog or precipitation.

To investigate the influence of the persistent stratocumulus cloud deck above the southeast Pacific on the desert region, a new cloud base height retrieval method is introduced. It allows to estimate the vertical position of these clouds, which can help to identify regions within the coastal desert that are potentially influenced by these clouds.

A first application of this new method revealed a strong relation between stratocumulus properties and the isotopic composition of coastal Tillandsia populations.

The proximity of the Atacama Desert to main acting zones of the El Niño-Southern Oscillation (ENSO) phenomenon and of the Pacific Decadal Oscillation (PDO) together with results from previous studies suggest that modes of climate variability have strong influence on the moisture supply to this region. As oscillating extreme phases of these climate modes have recurring periods on the order of a few years to decades, a long data record is needed to study their impact. Therefore, spatio-temporal variability of integrated water vapor (IWV) provided by a century-spanning reanalysis data set is studied in relation to ENSO and PDO. It is shown that the reanalysis represents IWV in a suitable manner to study its long-term variability. On a decadal time scale, the PDO revealed a stronger coupling to IWV compared to ENSO.

According to a seasonal analysis, identified relationships between ENSO and IWV are in line with findings reported for precipitation in the northeastern Atacama. This suggests that IWV has the potential to serve as a proxy for precipitation. The ENSO signal is opposite for summer and winter season. The negative phase (La Niña) favors wetter summers and drier winters, whereas the positive phase (El Niño) is associated with drier summers and wetter winters. Besides, it is shown that enhanced IWV under La Niña conditions is not constrained to the northeastern part of the Atacama Desert but can reach even offshore regions near the west coast. This effect can be typically observed in the

iii

(4)

ENSO phase with regionally varying impacts.

Water vapor is a key variable which controls fog formation. While a few studies demonstrate the impact of fog on the coastal desert based on in-situ measurements as well as spatially and temporally limited satellited-based observations, this thesis introduces a novel satellite- based fog detection method which allows a region-wide assessment.

An application of the algorithm for a 3-year period shows the spa- tial distribution of fog frequencies across the Atacama Desert. Aside from the coastal maximum, high fog frequencies are also revealed for isolated locations farther inland, which often coincide with salt flats within the central valley. The mechanisms driving fog formation within these inland regions remain unclear. The novel fog detection method creates the opportunity to further investigate this issue in future research.

Aside from westerly moisture sources associated with the Pacific Ocean and episodic easterly inflow from the continental interior, a third scenario is identified in this thesis. By investigating the role of atmospheric rivers for the Atacama Desert, it is revealed that moisture can be transported from the Amazon Basin across the Andes and the southeast Pacific towards the Atacama Desert. Furthermore, fractional precipitation rates of more than 50 % for various regions within the Atacama Desert demonstrate the importance of atmospheric rivers for this hyperarid environment.

iv

(5)

Z U S A M M E N FA S S U N G

Viele Facetten des atmosphärischen Wassereintrags in die Atacama- Wüste sind kaum erforscht. Kenntnisse über die Wasserverfügbarkeit sowie die Quellen der Feuchtigkeit und die zugrunde liegenden Me- chanismen sind jedoch erforderlich, um biologische und geologische Prozesse besser zu verstehen und mögliche wechselseitige Beziehun- gen zu identifizieren.

Diese Arbeit bietet eine umfassende meteorologische Perspektive auf den atmosphärischen Wassereintrag in die Atacama-Wüste im Kontext des gegenwärtigen Klimas. Die räumliche und zeitliche Varia- bilität des Wasserangebots und deren Kontrollmechanismen hängen davon ab, ob das Wasserangebot in Form von Wolken, Wasserdampf, Nebel oder Niederschlag betrachtet wird.

Um den Einfluss der persistenten Stratocumulus-Wolkendecke über dem Südostpazifik auf die Wüstenregion zu untersuchen, wird eine neue Methode zur Bestimmung der Wolkenbasishöhe entwickelt. So kann die vertikale Lage der Wolken vollständig bestimmt werden. Dies erlaubt es, Regionen entlang des Küstengebirges zu identifizieren, die möglicherweise von diesen Wolken beeinflusst werden. Eine erste Anwendung dieser neuen Methode ergab einen deutlichen Zusam- menhang zwischen den Eigenschaften der Stratocumulus-Bewölkung und der Zusammensetzung von Stickstoffisotopen der Tillandsienpo- pulationen entlang der Küste.

Die Nähe der Atacama-Wüste zu den Hauptwirkungszonen der

“El Niño-Southern Oscillation” (ENSO) und der Pazifischen Dekaden- Oszillation (PDO) sowie Ergebnisse früherer Studien legen den starken Einfluss dieser großskaligen Klimamoden auf den Wassereintrag in diese Region nahe. Da die sich abwechselnden Extremphasen dieser Klimamoden wiederkehrende Perioden in der Größenordnung von einigen Jahren bis Jahrzehnten aufweisen, ist ein langer Datensatz erforderlich, um ihren Einfluss zu untersuchen. In dieser Arbeit wird der integrierte Wasserdampf (IWV) aus einem Reanalyse-Datensatz, der mehr als ein Jahrhundert umspannt, verwendet, um den Einfluss von ENSO und PDO zu untersuchen. Zunächst wird gezeigt, dass die Reanalyse den IWV ausreichend genau repräsentiert, um seine Langzeitvariabilität zu untersuchen. Auf einer dekadischen Zeitskala zeigte die PDO eine stärkere Kopplung an IWV als ENSO.

Festgestellte saisonale Beziehungen zwischen ENSO und IWV äh- neln den Beziehungen, die bereits in früheren Studien für die nordöst- liche Atacama-Wüste in Bezug auf Niederschlag gezeigt wurden. Dies deutet darauf hin, dass IWV das Potenzial hat, als Approximation für Niederschlag zu dienen. Das ENSO-Signal ist für die Sommer- und Wintersaison entgegengesetzt. Die negative Phase (La Nina) begüns-

v

(6)

führt. Insbesondere für die Sommersaison wird gezeigt, dass erhöhter integrierter Wasserdampfgehalt unter La Niña Bedingungen nicht auf den nordöstlichen Teil der Atacama-Wüste beschränkt ist, sondern sogar den der Westküste vorgelagerten Pazifik erreichen kann. Zusam- menfassend ergibt sich, dass Wassereintrag in die Atacama-Wüste je nach Jahreszeit und ENSO-Phase aus östlich oder westlich gelegenen Quellen stammt, wobei es regionale Unterschiede geben kann.

Wasserdampf ist eine Schlüsselvariable für Nebelbildung. Während einige Studien den Einfluss von Nebel auf den Küstenbereich der Atacama-Wüste anhand von in-situ Messungen zum einen und räum- lich und zeitlich begrenzten satellitengestützten Beobachtungen zum anderen belegen, wird in dieser Arbeit eine neue satellitenbasierte Nebeldetektionsmethode vorgestellt, die eine regionale Abschätzung ermöglicht. Eine Anwendung des Algorithmus über einen Zeitraum von 3 Jahren zeigt die räumliche Verteilung der Nebelauftrittshäufig- keiten in der Atacama-Wüste. Neben dem Küstenmaximum zeigen sich auch hohe Nebelfrequenzen für einzelne Regionen weiter im Lan- desinneren, die vielfach mit Salzpfannen in der zentralen Depression in Verbindung stehen. Die Mechanismen, die die Nebelbildung in diesen Binnenregionen antreiben, sind weiterhin unbekannt. Die neu- artige Nebeldetektionsmethode bietet die Möglichkeit, dieses Problem in zukünftigen Forschungsarbeiten weiter zu untersuchen.

Neben den mit dem Pazifik verbundenen westlichen Quellen der Feuchtigkeit und dem episodischen östlichen Zufluss aus der konti- nentalen Feuchtzone Südamerikas wird in dieser Arbeit ein weiterer Pfad identifiziert, der mit einem Wassereintrag verbunden ist. Durch die Untersuchung der Rolle atmosphärischer Flüsse (engl. atmosphe- ric rivers) für die Atacama-Wüste wird deutlich, dass Feuchte vom Amazonasbecken über die Anden und den Südostpazifik in Richtung Atacama-Wüste transportiert werden kann. Darüber hinaus zeigen Niederschlagsanteile von überwiegend mehr als 50 % in der Atacama- Wüste die Bedeutung atmosphärischer Flüsse für diese hyperaride Umgebung.

vi

(7)

C O N T E N T S

I introduction

1 motivation 3

2 background and climatic features of the ata-

cama desert 7

2.1 Climatic setting . . . . 7

2.2 Stratocumulus and fog . . . . 9

2.2.1 Stratocumulus – conceptual description . . . . . 10

2.2.2 Coastal cloud observations . . . . 11

2.2.3 Fog observations . . . . 13

2.3 Large-scale drivers . . . . 14

2.3.1 Pacific climate modes . . . . 15

2.3.2 Regional impacts . . . . 19

2.4 Synoptic driver . . . . 22

3 overview of the studies 25 3.1 Aims and hypotheses . . . . 25

3.2 Cloud heights . . . . 28

3.3 Water vapor variability . . . . 29

3.4 Fog . . . . 29

3.5 Atmospheric rivers . . . . 31

II method development and analysis 4 cloud heights 35 4.1 Introduction . . . . 37

4.2 Data . . . . 40

4.2.1 MISR cloud product . . . . 40

4.2.2 METAR data . . . . 42

4.3 Cloud base height retrieval . . . . 43

4.3.1 Method . . . . 44

4.3.2 Case study . . . . 47

4.3.3 Parameter optimization . . . . 48

4.3.4 Scene limitations . . . . 50

4.4 MIBase evaluation . . . . 52

4.4.1 Scene structure influence . . . . 54

4.5 MIBase application . . . . 55

4.5.1 Global cloud height distribution . . . . 55

4.5.2 Southeast Pacific . . . . 59

4.6 Conclusion . . . . 62

4.7 Appendix: Sensitivity to threshold height . . . . 64

4.8 Remarks . . . . 64

5 water vapor variability 67 5.1 Introduction . . . . 69

vii

(8)

5.2 Data and focus regions . . . . 72

5.2.1 ERA-20C . . . . 72

5.2.2 HOAPS4 . . . . 72

5.2.3 MODIS . . . . 73

5.2.4 Large scale indices ENSO and PDO . . . . 74

5.2.5 Cut-off lows . . . . 75

5.2.6 Focus regions and local atmospheric water cycle 75 5.3 Validation of ERA20C . . . . 78

5.3.1 Bias assessment . . . . 78

5.3.2 Climatologies and composites . . . . 80

5.3.3 Comparison of decomposed IWV time series . . 81

5.3.4 Representativity for the 20th century . . . . 85

5.4 20th century IWV . . . . 87

5.4.1 Regional IWV variability . . . . 88

5.4.2 IWV relationship with ENSO, PDO and local SST 90 5.4.3 Seasonal dependencies . . . . 93

5.5 Conclusion . . . . 94

5.6 Remarks . . . . 98

6 fog 101 6.1 Introduction . . . . 103

6.2 Data . . . . 107

6.2.1 Moderate Resolution Imaging Spectroradiome- ter (MODIS) . . . . 107

6.2.2 Climate stations . . . . 109

6.3 Fog detection methods . . . . 111

6.3.1 Ground-based reference . . . . 112

6.3.2 Classification assessment measures . . . . 117

6.3.3 Neural network . . . . 117

6.3.4 MODIS cloud top height . . . . 120

6.4 Evaluation . . . . 123

6.4.1 Neural network model sensitivity . . . . 124

6.4.2 Event-based algorithm performance . . . . 125

6.4.3 Spatio-temporal representativeness . . . . 125

6.4.4 Climatology . . . . 133

6.5 Conclusion . . . . 137

6.6 Appendix: Definitions of statistical measures . . . . 140

6.7 Remarks . . . . 141

7 precipitation 143 7.1 Introduction . . . . 145

7.2 Data . . . . 148

7.2.1 Atmospheric river catalog . . . . 148

7.2.2 Regional climate model precipitation observations149 7.2.3 Reanalysis and radiosounding data . . . . 151

7.3 Case study . . . . 151

7.4 Composite analysis . . . . 154

7.5 Conclusion . . . . 158

(9)

acronyms ix

7.6 Remarks . . . . 160

III discussion and conclusion 8 discussion 163 8.1 Cloud heights . . . . 163

8.2 Water vapor variability . . . . 167

8.3 Fog . . . . 169

8.4 Atmospheric rivers . . . . 170

9 conclusion and outlook 173 IV appendix a appendix 179 a.1 Cloud heights . . . . 179

a.2 Water vapor variability . . . . 183

a.3 Fog . . . . 187

bibliography 203

(10)
(11)

A C R O N Y M S

AR Atmospheric River

CR2 Center for Climate and Resilience Research

CRC Collaborative Research Center

ECMWF European Centre for Medium-Ranged Weather Forecast

ENSO El Niño Southern Oscillation

EOF Empirical Orthogonal Function

ERA-20C ECMWF ’s Twentieth Century Reanalysis

ERA5 ECMWF ’s 5th generation reanalysis

GOES Geostationary Operational Environmental Satellite

HadISST1 Hadley Centre’s sea ice and sea surface temperature data set

HYSPLIT Hybrid Single Particle Lagrangian Integrated Trajectory Model

IGRA Integrated Global Radiosonde Archive

IVT Integrated Water Vapor Transport

IWV Integrated Water Vapor

LCL Lifting Condensation Level

MBL Maritime Boundary Layer

MIBase MISR Cloud Base Height

MISR Multi-angle Imaging SpectroRadiometer

MODIS Moderate Resolution Imaging Spectroradiometer

PDO Pacific Decadal Oscillation

RMSE Root Mean Square Error

SRTM Shuttle Radar Topographic Mission

SST Sea Surface Temperature

WRF Weather Research and Forecasting Model

UTC Coordinated Universal Time

VOCALS-REx Variability of the American Monsoon System (VAMOS) Ocean-Cloud-Atmosphere-Land Study – Regional Experiment

xi

(12)
(13)

Part I

I N T R O D U C T I O N

(14)
(15)

M O T I VAT I O N 1

Figure 1.1: Photograph of the coastal Atacama Desert taken in March 2017 picturing the Pacific ocean, the maritime boundary layer, and the free troposphere. The maritime boundary layer is visible as the optically denser part of the air, intersecting with the emerging coastal cliff, which hosts locally adapted plant communuties. The free troposhere aloft is much clearer compared to the boundary layer.

Water is a vital ingredient in the evolution of the Earth. By trigger- ing biological and geological processes, the availability and amount of water plays a decisive role in shaping our planet. Mostly, these processes are considered independently of each other and analyzed on a stand-alone basis. However, the fact that they respond to a common trigger encourages the assumption of mutual dependencies and possible interactions (Collaborative Research Center ( CRC ) 1211;

sfb1211.uni-koeln.de; Dunai et al., 2020).

Innumerable biological and geological processes occur simultane- ously on various time scales. This makes it difficult to disentangle potential relationships. To reduce some of this complexity, it would be beneficial to find a location where these processes happen more isolated and at a slower pace. An ecosystem where the abundance of water as the common trigger is reduced would best approximate these

3

(16)

criteria. As the oldest desert and presumably driest place on Earth, the Atacama Desert appears to be a suitable environment. While inter- mittent periods of enhanced water availability allow life and surfaces to evolve, enduring dry (hyperarid) conditions conserve the resulting traces through geological eras. The degree of aridity and the timing of pluvial episodes are controlled by the progress of climate change and associated atmospheric processes. This implies the immediate need for a meteorological perspective on this matter.

For many regions, precipitation is the prevailing water source. In hy- perarid regions, however, other factors such as clouds and water vapor dominate the water cycle. To describe the atmospheric water supply to the Atacama Desert, following key aspects have to be considered.

The maritime boundary layer is the lowest tropospheric layer that is in contact with the ocean surface. Near the Atacama coast, it typically extends to a height of about 1 km (e.g. Rahn and Garreaud, 2010;

Muñoz et al., 2016 ).

One aspect pose clouds which form over the southeast Pacific near the coast of the Atacama Desert. These low stratiform clouds fre- quently cap the moist maritime boundary layer. When they are trans- ported onshore, they intercept with the local orography. The towering coastal cliff and mountain range with typical heights between 500 m and 2000 m constitute a natural barrier hindering these clouds from penetrating inland (Fig. 1.1). Wherever these mountains immerse into the cloud, fog oases arise enabling unique ecosystems (Pinto et al., 2006; Cereceda et al., 2008b; Lobos Roco et al., 2018). In these habitats, specialized plant communities, such as Tillandsia, satisfy their water and nutrition demand almost exclusively from fog water supply (Run- del et al., 1997; Pinto et al., 2006; Westbeld et al., 2009; González et al., 2011). The locations of these coastal fog oases are closely linked to the cloud heights.

A second aspect is the availability of water vapor. Making up about 99.5 % of the total water in the atmosphere (Stevens and Bony, 2013), water vapor is the most important source for precipitation and a key variable for fog formation and dew. Besides these indirect ways of dispensing liquid water after condensation, water vapor itself poses a direct water source for soils in arid regions and stimulates mi- crobial activity and diversity via adsorption (McHugh et al., 2015;

Crits-Christoph et al., 2013). Furthermore, relative humidity, which is closely related to water vapor content, determines phase transitions between gypsum, anhydrite and their intermediate phases (Tang et al., 2019; Ritterbach and Becker, 2020). This indicates its potential role in soil formation, which requires further exploration. Relative humid- ity and the isotopic composition of atmospheric water vapor, which depends on its source and pathway, determine isotopic fractionation during evaporation. Therefore, they are essential variables for the de- velopment of a paleo-humidity proxy (Craig and Gordon, 1965; Surma et al., 2018; Gázquez et al., 2018).

A third aspect is the distribution of fog, which is closely related to

coastal cloud heights and water vapor. When coastal clouds are present

at a sufficient height, they can cross the coastal cliff and penetrate

(17)

motivation 5

through the coastal mountain range. This is frequently observed at certain corridors such as canyons or distinct locations where the coastal cliff is lower (Farías et al., 2005). While in most cases clouds eventually dissipate due to mixing with dry inland air, the moisture enhanced maritime air can reach places even farther away from the coast (Schween et al., 2020). During nocturnal cooling via thermal radiation, this moisture enhanced air might reach saturation. Therefore, the initiation of condensation processes resulting in radiation fog seems plausible. Even though favorable conditions for its formation were found (Cereceda et al., 2002; Westbeld et al., 2009), radiation

fog has not been reported due to lacking observations. While various Lomas are isolated and diverse vegetation formations in the coastal fog zone of the Atacama Desert (e.g. Pinto et al., 2006).

studies show the impact of fog on localized coastal loma vegetation (e.g. Rundel et al., 1997; Pinto et al., 2006; Cáceres et al., 2007; Latorre et al., 2011; González et al., 2011; Río et al., 2018; Lehnert et al., 2018b;

Lobos Roco et al., 2018), the importance of fog for biological and geological processes has barely been explored on a region-wide scale.

Instead, Cáceres et al. (2007) and Westbeld et al. (2009) emphasize the urgent need for further investigations on the dynamics involved in fog formation and dissipation and the role of radiation fog, respectively.

An investigation of these aspects would not only improve our un- derstanding of the contemporary atmospheric water supply to the Atacama Desert, but also provide a meteorological basis for various biological and geological analyses in this region. For example, it would make it possible to constrain thresholds for biological and geological processes which are observable under current climatic conditions.

The framework for this multidisciplinary approach is provided by the CRC 1211, a research program funded by the German Research Foundation. With the focus on interactions between biological, ge- ological and atmospheric processes, the program allows to exploit arising synergies and to conduct cross-validations. In its turn, it should lead to an improvement of applied methods and enable more solid conclusions in all three disciplines.

The synergies from this approach are exemplified here from the

meteorological point of view. The first and most immediate goal of

the meteorological analysis is to gain more detailed insights into the

underlying atmospheric processes. This involves identifying and quan-

tifying relevant relationships between large-scale phenomenons, such

as the internal climate mode El Niño Southern Oscillation ( ENSO ),

synoptic features and regional water availability patterns in the At-

acama Desert. Ultimately, such knowledge would contribute to the

geoscience community in the following way: larger scale phenomenons

could be linked to the regional water variability and thus be related

to local biological or geological processes. For example, the isotopic

composition of water bound in gypsum, which can serve as a medium

for paleo-humidity reconstruction (Gázquez et al., 2018; Voigt, 2020),

could be associated with a broader context. By using modern observa-

(18)

tions, functional relationships between variables quantifiable through climate archives on one side and varying ambient atmospheric condi- tions on the other side can be estimated and verified in the context of the recent climate. When analyzing desert archives, such calibrated relationships would allow a more comprehensive interpretation and support the reconstruction of climate history.

Summarizing the above, this thesis contributes to the overall purpose

of the CRC by providing a comprehensive meteorological perspective

on the atmospheric water supply to the Atacama Desert under recent

climate conditions.

(19)

B A C K G R O U N D A N D C L I M AT I C F E AT U R E S O F T H E 2

ATA C A M A D E S E R T

This chapter provides an overview on the state-of-the-art knowledge about atmospheric features associated with water supply to the At- acama Desert. After an introduction to the general climatic setting which results from the geographic location (Chapter 2.1), more details are provided on stratocumulus clouds and fog (Chapter 2.2) as well as the influence of large-scale drivers (Chapter 2.3) and synoptic drivers (Chapter 2.4).

2.1 climatic setting

Hyperarid is a term to describe regions for which

precipitation is less than 5 % of the potential

evapotranspiration (UNEP, 2011 ).

The Atacama Desert is located at the western coast of South America (Fig. 2.1). Hyperarid conditions persist between the southeast Pacific and the foothills of the high Andes from West to East and between 15 S and 30 S (UNEP, 2011; Houston and Hartley, 2003). The prevailing aridity is typical for subtropical locations at the subsiding branch of the Hadley cell circulation and can be found in other subtropical regions, e. g. the Namib Desert.

Due to the enduring large-scale subsidence, strong semi-persistent surface anticyclones emerge, forming the subtropical high pressure belt. This includes the southeast Pacific anticyclone, which has specific implications for the Atacama Desert. Resulting southerly winds at the eastern side of the high pressure system enact stress on the sea surface driving the Humboldt Current, which transports cold sea water from higher latitudes towards the tropics along the South American west coast (Montecino and Lange, 2009).

Furthermore, friction effects cause a counterclockwise rotation of the flow towards the west with increasing depth within the near surface ocean layer (Ekman spiral). This leads to near coastal upwelling of deep ocean water, which provides further cooling of the Sea Surface Temperature ( SST ) embedded in the Humboldt Current system. The strong temperature contrast between the cold SST and the subsiding warm air leads to a stable stratification. This hinders the development of precipitating clouds and results in a decoupling of the Maritime Boundary Layer ( MBL ) and the free troposphere aloft. Turbulent mix- ing within the boundary layer enforces an approximately adiabatic temperature profile and a nearly constant specific humidity profile.

Under these conditions, the typically observed stratocumulus deck can form right below the base of the inversion (more details in Chapter 2.2).

7

(20)

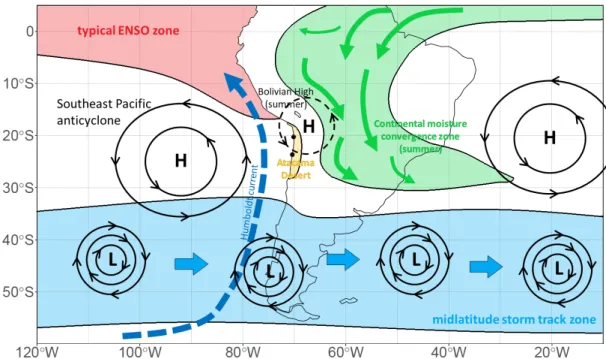
Figure 2.1: Scheme of key factors impacting the climate of the Atacama Desert (yellow shading): Midlatitude storm track zone (blue shad- ing), ENSO zone (red shading), which denotes the region with typically largest SST variability, the continental moisture conver- gence zone (green shading) with Atlantic moisture transport (austral summer situation). Furthermore, the southeast Pacific an- ticyclone, the Bolivian high (summer seasonal upper tropospheric high pressure system) and the Humboldt Current (blue dashed arrow) are denoted.

In contrast to other subtropical west coast deserts, the aridity of the Atacama Desert is further enhanced due to the unique local topog- raphy. At the western margin, the coastal cliff poses an immediate barrier hindering the moist maritime layer from penetrating inland.

Furthermore, diurnal heating of the land surfaces creates a strong thermal contrast between land and sea. These two factors result in the formation of two separate circulation cells (Rutllant et al., 2003).

A lower cell is constrained to the maritime boundary layer with up- drafts near the coastal cliff in the course of the diurnal heating. These updrafts result in near-surface westerly winds superimposed on the prevailing southerlies and an offshore return flow below the inversion layer. During night time, the circulation reverses and weakens (Rutllant et al., 2013). An upper cell is driven by strong daytime heating of the Andean slopes (“Andean pumping” Rutllant et al., 2013). This results in strong westerly winds near the surface of the desert and a return flow at higher altitudes. This flow pattern increases the subsidence above the coastal desert during the afternoon (Rutllant et al., 2013).

At the eastern margin, the high Andean mountain ranges are be-

lieved to create a rain shadow effect. According to in-situ measure-

ments, precipitation decreases rapidly with decreasing heights at the

(21)

2.2 stratocumulus and fog 9 western slopes of the Andean cordillera which can be attributed to barrier effect of the Andes preventing moisture intrusion from the Amazon Basin (Houston and Hartley, 2003). Controversially, several modeling studies revealed that a lowering of the Andes does not have a significant effect on precipitation and moisture within the Atacama Desert (Ehlers and Poulsen, 2009; Sepulchre et al., 2011; Garreaud et al., 2010).

The interplay of the factors mentioned above result in annual pre- cipitation rates below 2 mm in the hyperarid core (Houston, 2006).

The precipitation pattern shows a North–South gradient due to winter storm tracks (Fig. 2.1) occasionally reaching the southern Atacama Desert. Additionally, a West–East gradient takes contour with higher precipitation rates at higher elevations at the western slopes of the Andes in connection to moist easterlies during the summer (Houston, 2006). These easterlies are caused by an upper tropospheric high pres- sure system called Bolivian high which is created by deep convection over the Amazon Basin during the austral summer season (Lenters and Cook, 1997). During episodic southward shifts of the Bolivian high, easterly flows transport large amounts of moisture causing heavy thunderstorms in the Altiplano (Garreaud et al., 2003). This mecha- nism is also responsible for the summer time precipitation maximum at the western slopes of the Andes in the northern Atacama. Seasonal peak precipitation rates decline rapidly with decreasing topography to the west (Houston and Hartley, 2003; Houston, 2006). Since precipita- tion rates are so low, other moisture sources such as fog (Chapter 2.2) and water vapor (Chapter 2.3) become dominant within the hyperarid core of the Atacama.

2.2 stratocumulus and fog

The stratocumulus turning into fog at its interception with the coastal cliff and mountain range constitutes the life vein for Tillandsia and other plant communities (Rundel et al., 1997; Muñoz-Schick et al., 2001;

Pinto et al., 2006; Westbeld et al., 2009; González et al., 2011). Recent discoveries also attribute activation of photosynthesis of soil organisms to fog water supply pointing out the importance of this “living skin”

for carbon and nitrogen fixation as well as soil formation through bio-weathering (Lehnert et al., 2018a; Jung et al., 2020). Intuitively, the exact location of these biologically active zones depends on the top and base height and on the frequency of the maritime stratocumulus.

Underlying concepts of stratocumulus formation and dissipation are

introduced in Chapter 2.2.1. These concepts, which have been reviewed

by Wood (2012), encompass the relation between atmospheric drivers

and cloud properties, such as height and thickness. Thereafter, current

findings regarding variability of cloud heights and cloud cover fraction

(22)

Figure 2.2: Physical processes of the marine stratocumulus in the coastal region. A well mixed MBL features a vertically constant specific humidity q and a constant potential temperature θ which in- creases slightly within the cloud layer towards the cloud top.

Figure taken from Lobos Roco et al. (2018). ©2018 Elsevier B.V.

Used with permission.

(Chapter 2.2.2) as well as fog water supply and fog detection (Chapter 2.2.3) are described.

2.2.1 Stratocumulus – conceptual description

Above the cold Humboldt Current and below large-scale subsidence of warm and dry air, the southeast Pacific region offers ideal conditions for stratocumulus formation. Consequently, it hosts the largest and most persistent subtropical stratocumulus deck on Earth (Klein and Hartmann, 1993). Conceptually, these clouds can form when turbulent mixing moistens the boundary layer and stratifies the temperature resulting in a neutral layer (Paluch and Lenschow, 1991). The initial turbulence is either generated by vertically sheared horizontal winds or by buoyancy resulting from the moisture and heat exchange at the ocean-atmosphere interface. The latter is provided when evaporation and temperature exchange enhance the virtual temperature of an air parcel allowing ascent (Paluch and Lenschow, 1991, and Fig. 2.2 for a schematic overview).

When the subsidence inversion is above the Lifting Condensation Level ( LCL ), cloud formation starts at the height at which the upper part of the mixed layer reaches saturation (Randall and Suarez, 1984).

The cloud may grow up to the inversion base height. Once the cloud

began to form, it emits infrared radiation at its top which leads to

a cooling of the cloud layer (Paluch and Lenschow, 1991). The ra-

diative cooling sharpens the inversion and generates a convective

circulation which becomes the main driver maintaining the cloud

(Lilly, 1968). This convection enhances the turbulence, which, in turn,

(23)

2.2 stratocumulus and fog 11 homogenizes the cloud layer and couples it to the moisture source (ocean-atmosphere interface). Several feedback mechanisms may alter the height of the MBL , the LCL , the thickness of the cloud and as a result its liquid water content (Albrecht et al., 1990; Bretherton and Wyant, 1997; Wood, 2012).

While the stratocumulus forms over ocean, it is modulated near coastal areas due to diurnally varying land-sea interactions (Sunuarara- jan and Tjernström, 2000). At night time, a stronger cooling of the land surface compared to the sea surface leads to predominant descent of air parcels at the ocean side of the coastal cliff. This results in a boundary layer local circulation cell with an onshore flow near the top of the boundary layer, advecting the stratocumulus inland (Rutllant et al., 2003).

Fog is formed where the cloud intercepts with the orography de- pending on the heights of the cloud margins. During daytime, the circulation of the maritime boundary layer reverses and intensifies in particular in the afternoon due to stronger heating of the slopes of the coastal cliff compared to the sea surface (Rutllant et al., 2003).

Thus, the stratocumulus is pushed offshore. The heated land surface also lifts the LCL thinning the cloud from below (Rogers and Koraccn, 1992).

Additionally, the upper circulation cell driven by the “Andean pumping” (Rutllant et al., 2013) strengthens the coastal subsidence, which lowers the inversion base height (Rutllant et al., 2003). This leads to dissipation of the cloud by thinning from the top. During the afternoon, isolated convective cumulus clouds can form at the coastal cliff. They are related to the updraft of the daytime marine boundary layer circulation and form frequently at identical locations possibly related to the shape of the coastal shoreline and orography (Cereceda et al., 2002).

2.2.2 Coastal cloud observations

A recent study based on more than 40 years of observations at three coastal sites (Arica, Antofagasta, Iquique) analyzes the diurnal cycle of coastal clouds (Muñoz et al., 2016). While higher cloud cover frac- tion together with lower cloud base heights prevail during the night, lower cloud cover fraction together with higher cloud base heights predominate during the day. The observed cloud cycle is consistent with the previous conceptual considerations.

These observations also reveal a distinct seasonal cycle with the highest cloud cover fraction and lowest cloud base heights during winter and spring (May–November) and lower cloud fractions and higher cloud base heights for summer and fall (December–April) (Muñoz et al., 2016). This is consistent with the seasonality of the SST

and the subsidence strength according to the position of the southeast

(24)

Pacific anticyclone, which shifts southward during summer leaving a weaker subsidence (Garreaud et al., 2009).

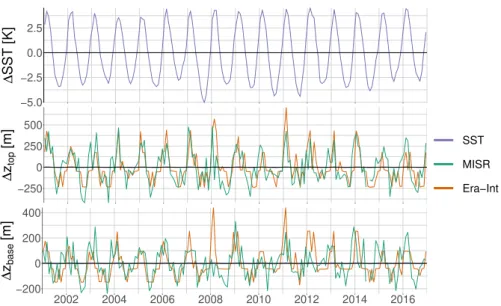
Furthermore, negative trends in cloud base heights with different onset times for the three locations were identified between 1995 and 2010 (Muñoz et al., 2016). For example, the annual mean cloud base height at Antofagasta decreased about 200 m between 1985 and 2005.

For Arica, the overall trend is also negative but weaker because a positive trend is detected for the core summer season (January and February). Varying seasonal trends are also reported regarding cloud cover fraction with an increasing signal for winter and spring (June–

November) and decreasing signal for summer and fall (December–

May).

The negative cloud base height trends are concomitant with a nega- tive trend of inversion base height determined from radiosonde data for the period between 1960–2009 (Schulz et al., 2012). However, the decrease of the inversion base height is of lesser magnitude compared to the decrease of the cloud base height, which implies that the cloud thickness increased within the analyzed period (Muñoz et al., 2016).

A thickening cloud layer is consistent with an increasing inversion strength determined from reanalysis data for the southeast Pacific region (period 1984–2009, Seethala et al., 2015). The stronger inversion hinders cloud dissipation by decreasing the entrainment rate (Wood, 2012).

Different cloud cover fraction trends with opposite signs for spring and fall season compared to the report by Muñoz et al. (2016) are revealed if cloud cover fraction averages over a total of seven available coastal stations between 20 S and 30 S are considered (Eastman and Warren, 2013). While Muñoz et al. (2016) argue the difference could be caused by differences in the data processing or slightly varying time periods, it may also indicate that the spatial variability of the coastal stratocumulus is not sufficiently represented by these few observations.

This is further supported by different onset times of the negative cloud base height trend (Muñoz et al., 2016).

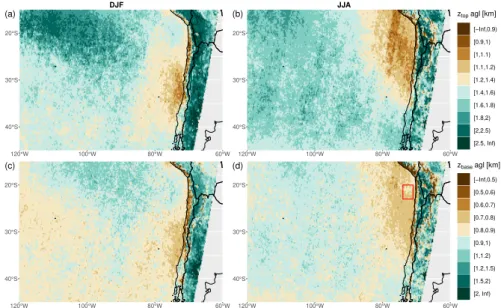
However, a region-wide cloud height assessment is currently lacking in the literature. A region-wide coastal cloud height climatology would allow to constrain the role of clouds for biological and geological processes.

A data set of cloud top and base heights with high spatial resolution

could be used for model and reanalysis evaluation. Ultimately, the

use of reanalysis could be beneficial to extent the limited temporal

coverage of satellite-based measurements. To achieve the desired spa-

tial coverage, satellite remote sensing would be beneficial. However,

to date, no operational satellite-based retrieval method of cloud base

height is available.

(25)

2.2 stratocumulus and fog 13

2.2.3 Fog observations

Fog and low cloud cover over the coastal part of the Atacama Desert are strongly correlated to maritime stratocumulus cover (Cereceda et al., 2008b). The research carried out to study fog in this region has been mainly based on (i) in-situ fog collection (e. g. Cereceda et al., 2002; Larraín et al., 2002; Cáceres et al., 2007; Cereceda et al., 2008b; Lobos Roco et al., 2018; Río et al., 2018) mostly using standard fog collectors (Schemenauer and Cereceda, 1994a) and (ii) satellite remote sensing of low clouds (e. g. Farías et al., 2005; Osses et al., 2005; Cereceda et al., 2008b; Lehnert et al., 2018b; Río et al., 2018).

A major study site for in-situ fog collection is Alto Patache, a re- search station operated by the Centro del Desierto de Atacama UC.

It is located on top of the coastal cliff at a height of 850 m above sea level and directly faces the Pacific ocean. For this location, the sea- sonal cycle of fog water yields has been derived from a 17-year long monthly time series (Río et al., 2018). Whereas highest fog water yields are observed for winter (July, August, September), lowest average fog water amounts are collected during summer seasons (December- April). These findings are consistent with the seasonal cycle of cloud cover fractions observed at other coastal stations below the coastal cliff (Muñoz et al., 2016) and with the seasonality of the general driving factors for stratocumulus (c. f. Chapter 2.2.1).

Furthermore, a vertical gradient has been observed along an inclin- ing transect along the coastal cliff near Alto Patache (Cereceda et al., 2008b). Annual fog water yields decrease rapidly from more than 7 lm 2 at the top (850 m) to almost zero at 650 m. This matches with mean annual cloud base heights of around 800 m at Iquique (north of Alto Patache) and 650 m at Antofagasta (south of Alto Patache) (Muñoz et al., 2016) considering that the liquid water content increases between cloud base and cloud top height (Bretherton, 1997).

Farther inland, amounts of fog water collected at individual sites decrease (Cereceda et al., 2002; Cáceres et al., 2007; Cereceda et al., 2008b). For a transect between the coastal region and the Yungay area, declining abundance of hypolithic cyanobacteria and reduced fog water yields have been observed consistently (Warren-Rhodes et al., 2006; Cáceres et al., 2007).

Moreover, few fog events have been observed even beyond the

coastal mountain range 45 km inland from Alto Patache within the

Pampa de Tamarugal (central depression) during a 10-month field

campaign (Cereceda et al., 2002). Occasionally, no concomitant fog was

observed at the coastal station, which might be an indication of other

processes being at play besides advection. These could be, for example,

dissipating fog leaving a humid air mass to condense locally or diur-

nal evaporation of ground water which condenses during nocturnal

(26)

cooling (Cereceda et al., 2002). However, not enough observations are available to investigate such hypotheses.

Satellite remote sensing of low clouds has been applied to investi- gate spatial patterns to derive seasonal and diurnal variations (e. g.

Farías et al., 2001; Farías et al., 2005; Cereceda et al., 2008b; Lehnert et al., 2018b). To distinguish between low and high clouds, spectral thresholds were applied. However, it is difficult to infer from satellite data whether such low clouds intercept with the ground. Neverthe- less, these observations could confirm the seasonal cycle derived from the in-situ measurements with most persistent cloud cover over the coastal region during winter (Farías et al., 2005; Cereceda et al., 2008b;

Lehnert et al., 2018b). The diurnal cycle of continental low cloud cov- erage has been determined using observations from the Geostationary Operational Environmental Satellite ( GOES ) for two individual months (August 2001, January 2002). A diurnal minimum appears between 10 a. m. and 3 p. m. local time.

Furthermore, satellite-based observations confirmed the occasional occurrence of low clouds in the central valley (Farías et al., 2005; Cere- ceda et al., 2008b). These occurrences were linked to cloud advection through corridors which were identified from satellite images and grouped into coastal corridors and interior corridors (Farías et al., 2005).

Satellite-based observations are advantageous regarding spatial coverage compared to in-situ measurements. However, satellite-based studies have been carried out only for short periods and limited regions within the Atacama Desert. In addition, fog and low clouds have not been distinguished so that it is not clear whether detected cloud features have the potential to supply water to the soil and plants and trigger biological and geological processes.

2.3 large- scale drivers

In this thesis, the term large-scale drivers refers to phenomena acting

on time scales between multiple months and decades and spatial

scales larger than 1000 km. Large-scale drivers are distinguished from

synoptic drivers (Chapter 2.4) which refer to atmospheric phenomena

of spatial and temporal dimensions up to a few 100 km and a few days,

respectively. For example, dominant patterns of climate variability,

such as the ENSO phenomenon and the Pacific Decadal Oscillation

( PDO ), act on the large scale both temporally and spatially with periods

between 2 to 7 years ( ENSO ; Timmermann et al., 2018) and longer ( PDO ;

Newman et al., 2016) and with primary acting zones spanning the

tropical ( ENSO ) and the northern Pacific ( PDO ) ocean basin. These two

climate modes have been associated with impacts on weather patterns

even in remote regions through global teleconnections. While other

climate indices exist, impacts on weather patterns across the Atacama

(27)

2.3 large-scale drivers 15 Desert and South America have mostly been related to ENSO and PDO in previous studies (Chapter 2.3.2). Oscillations of these two climate modes result from coupled ocean-atmosphere feedback mechanisms (Chapter 2.3.1).

2.3.1 Pacific climate modes

The ENSO phenomenon is the strongest year-to-year climate fluctu- ation of the global climate system (Timmermann et al., 2018). It is characterized by periodically recurring phases of warm (El Niño) and cold (La Niña) SSTs in the central or eastern tropical Pacific (Fig. 2.3) with recurring periods of extreme phases between three and seven years which have global implications, for instance, on precipitation and surface temperature (e. g. Davey et al., 2014). The state-of-the-art understanding of the guiding processes driving ENSO is reviewed by Timmermann et al. (2018). During the neutral phase, prevailing east- erly trade winds steer surface water from the eastern to the western tropical Pacific. While on the eastern ocean rim Ekman transport leads to upwelling of cold water, convergence in the western Pacific results in downwelling of warm surface water. This process maintains a tilt of the thermocline along the equatorial Pacific with greater depth in the west and shoal depth in the east resulting in a charged western Pacific warm pool with great heat content.

Anomalous westerly wind events, which are favored by enhanced

SST (Vecchi and Harrison, 2000), result from weather noise. They can trigger an oceanic downwelling Kelvin wave to propagate eastward.

It transports warm water to the east expanding the western Pacific warm pool and suppresses the upwelling of cold water. This results in a deepening of the thermocline in the central and possibly the eastern Pacific, which gives rise to the development of an El Niño event.

Once a positive SST anomaly is provided, the interplay of positive feedback mechanism enhances this initial warming. A weaker SST gradient leads to weaker trade winds which, in turn, weaken the west-east SST gradient even more (Bjerknes feedback). Furthermore, the weaker trade winds weaken the advection of cold water from the eastern Pacific (zonal advective feedback) and reduce the upwelling of colder deep ocean water (Ekman feedback). Due to the deepened thermocline such upwelling gives rise to anomalously warm water in the eastern Pacific (thermocline feedback).

Negative feedback mechanisms dampen the intensifying positive SST

anomaly. Via enhanced radiative and turbulent heat fluxes associated with tropical convection and cloud formation, heat is transferred from ocean to atmosphere (thermal damping). Horizontal and vertical transports of colder surrounding water into the region of enhanced

SST anomaly counteract the positive feedback mechanisms (dynamical

damping Lübbecke and McPhaden, 2013).

(28)

Figure 2.3: SST anomaly patterns for the PDO (top left) and ENSO (bottom left) derived by regressing monthly SST anomalies onto the principle component time series ( PDO at top right, ENSO at bottom right) of the leading empirical orthogonal function for the area indicated by the black rectangles. Analysis is based on the Hadley Centre’s sea ice and sea surface temperature data set ( HadISST1 ) (Rayner et al., 2003) for the period between 1870–2014. This figure is taken from https://climatedataguide.ucar.edu/climate-data/

pacific-decadal-oscillation-pdo-definition-and-indices (Deser et al., 2016) and has originally been adapted from Deser et al. (2010).

Anomalous westerlies associated with tropical deep convection are strongest around the equator and decrease towards the poles (Clarke, 1994). This results in a wind stress curl anomaly which induces poleward transport of upper level ocean water ultimately discharging the heat from the equatorial region (Clarke et al., 2007). Therefore, after full development of the El Niño state, the dampening feedbacks become more dominant. Reinstated easterly trade winds feature an upwelling oceanic Kelvin wave which propagates westward. Thereby, the ocean state transitions into the cold La Niña phase. This decrease of the eastern and central Pacific SSTs is enhanced by the aforementioned positive feedback mechanisms (Bjerknes, zonal advective, Ekman and thermocline feedback) as a response to enhanced trade winds and stronger west-east SST gradient.

A seasonal phase locking of the ENSO cycle is indicated by observed

variability of eastern and central tropical Pacific SST . The highest

variability is detected for austral late spring and early summer season,

while the lowest variability is observed for austral fall (Wengel et al.,

(29)

2.3 large-scale drivers 17

2018; Timmermann et al., 2018). The reason for this phase lock is seasonally varying stability of the coupled ocean atmosphere system.

The positive feedback mechanisms are greatest between September and December when eastern Pacific cold tongue is normally most pronounced, whereas the negative feedback mechanisms are greatest between January and April (Wengel et al., 2018). Therefore, El Niño development is typically initiated in austral fall, intensifying through winter and spring and reaching maximum SST anomalies in the central or eastern tropical Pacific in early summer. In the following year, the transition to La Niña begins in austral fall and peaks in the following summer (Timmermann et al., 2018). La Niña conditions are typically of lesser magnitudes compared to El Niño and can persist up to several years. The seasonal phase lock leads to an austral fall predictability barrier of ENSO development (Levine and McPhaden, 2015).

Individual El Niño events can vary considerably regarding their spatial and temporal evolution (Ashok et al., 2007; Kug et al., 2009;

Capotondi et al., 2015). A common distinction between eastern Pacific El Niño events and central Pacific El Niño events, sometimes referred to as El Niño modoki (Ashok et al., 2007), is made. Superposition of these different flavors, which are also associated with respective patterns from the two leading Empirical Orthogonal Functions ( EOFs ) of tropical Pacific SST anomalies, results in a continuous spectrum of

ENSO diversity (Timmermann et al., 2018). Through teleconnections, these ENSO flavors can have different implications for remote regions (Ashok et al., 2007; Tedeschi et al., 2013). However, due to short historical records, it is often difficult to distinguish different modes of this diversity to identify varying implications on remote regions (Timmermann et al., 2018).

The intensity and occurrence frequency of central Pacific El Niño events has been increasing since the 1990s (Lee and McPhaden, 2010).

This increase has been attributed to a decadal oscillation of ENSO flavor variability related to low frequency weather noise (Newman et al., 2011), which is consistent with model simulations without external forcing (Wittenberg et al., 2014). However, the question whether trop- ical Pacific decadal variability might be attributable to fundamental decadal scale processes has not been fully resolved yet (Newman et al., 2016; Timmermann et al., 2018) partly due to missing long-term data records (Timmermann et al., 2018).

Low frequency ENSO variability is believed to be one of multiple drivers for decadal variability in the North Pacific (Newman et al., 2016). For the northern Pacific, the time series of the SST pattern which explains the most temporal variability of this basin is termed the PDO (Fig. 2.3). It is defined as the variation of the principle component of the leading EOF determined from SST anomalies (Mantua et al., 1997;

Zhang et al., 1997). Different phases of this climate mode are asso-

ciated with precipitation and temperature anomalies across various

(30)

regions on the globe (Mantua and Hare, 2002). Furthermore, the PDO modulates the way ENSO impacts various regions (Wang et al., 2014).

While the pattern resembles the ENSO pattern, the PDO acts on longer time scales, such that since the beginning of the satellite era (1980s) only one phase shift occurred. A prevailing warm phase with enhanced SSTs at the eastern margins of the Pacific ended in the late 1990s. It was followed by the onset of a cold phase which lasted at least until 2015 and may recently be shifting back to the warm phase (Newman et al., 2016). While the ENSO pattern reveals a marked amplitude maximum for the tropical Pacific, the PDO is characterized by a broader pattern extending into higher latitudes (Fig. 2.3).

The mechanisms which are currently considered to be driving forces behind the PDO are revisited by Newman et al. (2016). In this work, the PDO is considered as a synthesis of multiple processes comprising stochastic atmospheric forcing, teleconnections from the tropics and midlatitude ocean dynamics.

The stochastic forcing is introduced by variation of the Aleutian Low.

A stronger Aleutian Low enhances advection of colder and drier air on its western side and drives stronger westerlies over the central North Pacific and stronger southerlies along the west coast of North America.

This leads to stronger heat fluxes between ocean and atmosphere at the central North Pacific and enhanced Ekman transport feedback of the upper ocean layer (Alexander and Scott, 2008), which, in turn, results in colder SSTs at the central North Pacific and warmer SSTs

at the eastern North Pacific. Therefore, an intensified Aleutian Low potentially yields a positive phase of the PDO while the mechanism is reversed for a weaker Aleutian Low. Lagged correlations reveal that the variability of the Aleutian Low leads the PDO implying its driving force (Newman et al., 2016).

Teleconnections between the tropics and the North Pacific are three- fold (Newman et al., 2016). Via a so called atmospheric bridge (Alexan- der et al., 2002; Liu and Alexander, 2007), a positive or negative ENSO

phase is linked to a stronger or weaker Aleutian Low and, thus, leads to a positive or negative impact on the PDO , respectively (Alexander et al., 2002; Alexander and Scott, 2008). Furthermore, eastward propa- gating equatorial Kelvin waves associated with the onset of El Niño are redirected polewards at the eastern Pacific boundary. On this pole- ward course, they create sea level and SST anomalies and excite oceanic Rossby waves (Johnson and O’Brien, 1990; Clarke, 1994). That way, such Kelvin waves have a direct impact on the ocean state of the North Pacific. Finally, decadal scale ENSO variability, i. e. low pass filtered SST

anomalies, results in a primary EOF which resembles the PDO pattern (Zhang et al., 1997). Therefore, ENSO is considered to be linked to the

PDO and to lead it according to lagged correlations (Newman et al.,

2016). Observations reveal that decadal scale variations in the tropical

(31)

2.3 large-scale drivers 19 oceans are coherent with variations in the North Pacific, indicating a coupling between these regions (Deser et al., 2004).

Different Ocean dynamics affect the nature of the PDO in terms of frequency and seasonal characteristics. For instance, a deeper mixed layer in boreal winter results in downward mixing of potential SST

anomalies to depths which are decoupled from the surface during the summer season. A shallower mixed layer during summer embodies a lower heat inertia so that it responds faster to atmospheric pro- cesses resulting in greater SST variability. However, when the mixed layer depth increases during the subsequent winter, the conserved SST anomalies reemerge to the surface. This so called reemergence mech- anism (Alexander and Deser, 1995) leads to higher autocorrelation of boreal winter and spring season with following winter and spring seasons compared to summer and fall (Newman et al., 2016).

Another form of ocean dynamics which affect the PDO is triggered by changes in the strength of the Aleutian Low. The resulting anoma- lous wind stress curl excites westward propagating Rossby waves, which, in turn, leads to a dynamic adjustment of the upper ocean gyre circulation (Qiu and Chen, 2005; Taguchi et al., 2007). These adjustments manifest in shifts of the SST anomaly pattern in the sub- arctic frontal zone of the western North Pacific. These SST shifts cause changes of heat and moisture exchange between ocean and atmo- sphere in this region (Tanimoto et al., 2003; Taguchi et al., 2012). The mediating Rossby waves take about 3–10 years to cross the Pacific basin (Sasaki and Schneider, 2011; Sasaki et al., 2013) feeding the interannual characteristic of the PDO (Newman et al., 2016). The way in which the resulting SST changes feed back onto the PDO remains poorly understood (Newman et al., 2016).

2.3.2 Regional impacts

There are several studies focussing on or including an analysis of the interannual atmospheric variability in the Atacama Desert. Such studies typically utilize reanalysis data, radiosoundings, in-situ pre- cipitation measurements and gridded precipitation data sets derived from gauge stations. Continuous data from precipitation gauges are limited to the outer edge of the Atacama Desert, i. e. stations at the western coast or at the slopes of the Andes and at the Altiplano at the eastern side (Houston and Hartley, 2003; Houston, 2006; Schulz et al., 2012; Valdés-Pineda et al., 2016). These studies mostly reveal a link between ENSO and interannual variability of precipitation. This link is shaped differently depending on region and season.

At the Bolivian Altiplano in the northeast of the Atacama core

desert region, the wet season, i. e. austral summer, coincides with the

typical peak season of El Niño events (Chapter 2.3.1). Thus, summer

precipitation correlates to the ENSO state: While El Niño is associated

(32)

with drier conditions, La Niña is associated with wetter conditions (e. g. Vuille, 1999; Garreaud and Aceituno, 2001; Garreaud et al., 2003; Houston, 2006; Garreaud et al., 2009; Marín and Barrett, 2017;

Canedo-Rosso et al., 2019).

During austral summer, i. e. the wet season, precipitation across the Altiplano is related to moist easterly episodes which result from a southward shift of the Bolivian High (Vuille, 1999; Garreaud et al., 2003). While the seasonal mean zonal wind is not related to intensity of single precipitation events, it shows an almost linear relationship to the number of days with precipitation and, thus, to the seasonally accumulated precipitation (Garreaud and Aceituno, 2001).

The frequency of these moist easterlies is modulated by ENSO in the following way. El Niño related SST anomalies in the eastern Pacific lead to an expansion of the troposphere. These positive geopotential height anomalies in upper levels result in enhanced westerly winds so that less wet episodes can occur across the Altiplano (Vuille, 1999;

Garreaud and Aceituno, 2001; Garreaud et al., 2003). On the other hand, La Niña is associated with negative SST anomalies which lead to stronger subsidence over the southeast Pacific. This allows more frequent wet easterly episodes (Vuille, 1999).

A similar summer seasonal relationship between zonal wind and moisture supply in terms of Integrated Water Vapor ( IWV ) has been observed farther south at the Chajnantor Plateau at a height of about 4800 m (Marín and Barrett, 2017). This region is characterized by extremely dry conditions suitable for very demanding astronomical observations (Giovanelli et al., 2001). They are carried out, for instance, at the Atacama Large Millimeter Array (ALMA Brown et al., 2004) and the Atacama Pathfinder Experiment (APEX Güsten et al., 2006).

Even though the fundamental link between ENSO phase and precipi- tation has been identified, not every El Niño or La Niña is associated with an anomalously dry or wet summer, respectively, resulting in low correlations. This can be attributed to the diversity of the ENSO

phases resulting in different meridional positions of the zonal wind anomalies (Garreaud and Aceituno, 2001). Another reason might be the different temporal offsets of the ENSO peak and the Altiplanic wet season (Garreaud et al., 2003).

While ENSO influence is not significant for austral winter at the Altiplano (Vuille, 1999), the situation is opposite at the western coast of the Atacama Desert. El Niño conditions appear to enhance precipi- tation for both winter and summer (Houston, 2006; Vargas et al., 2006;

Schulz et al., 2012). During austral winter, the enhanced precipitation

is typically associated with a developing El Niño, featuring a blocking

situation in midlatitudes. The latter pattern shifts the storm tracks

farther north, resulting in enhanced precipitation of the coastal and

southern Atacama Desert (Vargas et al., 2006). The relationship with

La Niña is generally weaker and of opposite sign (Houston, 2006).

(33)

2.3 large-scale drivers 21 The recurring period of wet winter conditions at the coastal stations is about 12 years, whereas El Niño occur every 3.3 years on average (Houston, 2006). This indicates that the ENSO state might favor certain conditions but does not directly cause them. Therefore, specific synop- tic conditions have to coincide for anomalous precipitation (Houston, 2006). Furthermore, the ENSO signal may be amplified or damped by the PDO (Andreoli and Kayano, 2005; Kayano and Andreoli, 2007;

Valdés-Pineda et al., 2018).

Given its decadal time scale, the PDO received less attention in previous studies on impacts on the Atacama Desert, possibly due to the requirement of very long data records. Valdés-Pineda et al. (2018) retrieved a suitable precipitation record from the gauge station at Copiapó located at the southern Atacama coast (27 S). They reveal a strong phase agreement between decadal scale precipitation variability and PDO . Furthermore, for another station at Antofagasta (23.6 S), a long time series of annual precipitation (1904–2000) reveals that anomalously wet years cluster together during positive PDO phases (Vargas et al., 2006, their Fig. 2).

The previous studies show the importance of large-scale climate indices for the moisture supply to the Atacama Desert. Still, the stud- ies are mostly limited to either the Altiplano at the northeast or to very few coastal stations. Attempts have been made to interpolate the composite precipitation signal using a kriging algorithm to fill the gaps in between (Houston, 2006). However, only three respec- tive positive and negative ENSO phases were incorporated. While the mechanism between large-scale tropical variability and precipitation anomalies in the Bolivian Altiplano has been recognized, it remains unclear whether the same mechanism guides the ENSO response at other inland locations within the Atacama Desert. For instance, it is not known how far west moisture can be transported by recurring easterly episodes during the summer above the Altiplano. Composite vertical profiles of specific humidity based on radiosoundings at the coastal city Antofagasta reveal significantly higher values at higher tropospheric levels for wet easterly episodes over the Altiplano. Nev- ertheless, the analogue composite for La Niña conditions does not reveal a significant moistening (Vuille, 1999).

For the PDO , a positive interference with the ENSO signal has been indicated by studies which investigated South America on a conti- nental scale (Andreoli and Kayano, 2005; Kayano and Andreoli, 2007;

Garreaud et al., 2009). However, only very few results are provided with specific focus on the Atacama Desert. Using a wavelet analysis of precipitation measurements at the Altiplano for a 68-year period (1948–

2016), no clear relationship to the PDO could be identified (Canedo-

Rosso et al., 2019). Longer station records were considered for very few

coastal stations, revealing potential implications of this climate mode

for the Atacama (Vargas et al., 2006; Schulz et al., 2012; Valdés-Pineda

(34)

et al., 2018). This indicates that century-long data records might be required to obtain significant results.

2.4 synoptic driver

The climate of the Atacama Desert is characterized by stable con- ditions with prevailing subsidence of warm dry air (Chapter 2.1).

Possible disturbances are troughs and cut-off lows which emanate northward from higher latitudes across the Pacific and coastal region.

Furthermore, thunderstorm activity and precipitation episodes oc- cur across the Altiplano during austral summer which may reach over the western cordillera of the Andes into the Atacama Desert.

These synoptic-scale events are associated with a southward displace- ment of the Bolivian High. Another disturbance could be posed by Atmospheric Rivers ( ARs ). Their role has not yet been investigated for this region.

Cut-off lows are closed cold low pressure systems which emanate from a trough within the basic westerly flow at midlatitudes. The cut-off process is typically associated with Rossby wave breaking and a split jet structure (Peters and Waugh, 2003; Ndarana and Waugh, 2010; Reyers and Shao, 2019). Within a region slightly south of the Atacama Desert between 30 S and 40 S, cut-off lows can occur all year round with an average of seven events per annum with a seasonal preference of fall, winter and spring (Pizarro and Montecinos, 1999).

These cut-off lows typically produce rainfall at the associated inland region. Exceptions are very weak cut-off lows which are warmer and characterized by a weaker pressure gradient (Pizarro and Montecinos, 1999).

Further north in direct connection to the Atacama Desert, extended winter time (April–September) cut-off lows have been attributed to enhanced inland moisture and a modulated wind regime (Reyers and Shao, 2019). More details on these regionally occurring cut-off lows including their formation mechanisms and differences to the last glacial maximum are provided by Reyers and Shao (2019).

The March 2015 Atacama flood (Bozkurt et al., 2016) was in fact accompanied by an atmospheric river according to the AR catalogue by Guan and Waliser ( 2015 ).

The importance of cut-off lows is also displayed by an episodes of extreme precipitation which occurred in March 2015. For this case, heavy rain was linked to positive SST anomalies in the eastern Pacific and the presence of a cut-off low anomalously north near the Atacama coast (Bozkurt et al., 2016).

Cut-off lows and troughs have been associated with enhanced di-

urnal northwesterly winds and calm nocturnal conditions for a mea-

surement site within the central Atacama region (Jacques-Coper et al.,

2015). In contrast, undisturbed conditions favor easterly winds at night

(Jacques-Coper et al., 2015). Enhanced IWV at the Altiplano has also

been related to northwesterly midtropospheric flow resulting from

troughing in particular for austral winter (Marín and Barrett, 2017).

(35)

2.4 synoptic driver 23 During the austral summer, precipitation occurs episodically across the Altiplano. These wet episodes are related to a southward shift of the Bolivian High and have a typical duration of a few days (Garreaud et al., 2003) and, thus, can be considered synoptic scale events. Mo- mentum of these upper level easterlies is mixed downward on the eastern side of the Andes so that the upslope flow of a very moist boundary layer air of the interior continent is intensified. This mois- ture advection fuels the Altiplano with additional latent heat, allowing deep convection and intense precipitation (Garreaud et al., 2003) The storm activity is mostly limited to the Altiplano and declines rapidly at the western slopes of the Andean mountain range.

First termed “tropospheric rivers” (Newell et al., 1992), filamentary structures of enhanced water vapor in the troposphere have been identified and associated with major moisture and heat transport from the tropics towards higher latitudes. The term AR was introduced later on by Zhu and Newell (1998), who pioneered identification algorithms for these objects. Nowadays, ARs are defined as a “long, narrow, and transient corridor of strong horizontal water vapor transport that is typically associated with a low-level jet stream ahead of the cold front of an extratropical cyclone” (Ralph et al., 2018). They constitute an emerging topic to the hydrological and meteorological science and engineering community (Wilson et al., 2020). Upon landfall at the eastern boundaries of the oceans, ARs can trigger extreme precipitation events associated with floods, strong winds as well as essential water supply (e. g. Newell et al., 1992; Zhu and Newell, 1998; Neiman et al., 2008; Ralph and Dettinger, 2011; Ramos et al., 2016; Waliser and Guan, 2017; Paltan et al., 2017; Blamey et al., 2018; Nash et al., 2018; Viale et al., 2018; Rauber et al., 2020).

From a global distribution of AR landfall frequency, it is evident that

these systems are mainly impacting coastal regions of the midlatitudes

with decreasing frequencies towards the equator (Guan and Waliser,

2015). Specifically for the South American continent, ARs occur mainly

between 30 S and 60 S with peak frequencies between 45 S and 50 S

(Viale et al., 2018). However, indication is given that a few landfalls

happen even as far north as the coast of the Atacama Desert (Guan

and Waliser, 2015, cf. their Fig. 8a). Even though their frequency is

comparably low in this region, they may be related to a significant

fraction of the overall very rare precipitation. Still, the role of ARs for

the Atacama Desert has not been assessed yet.

(36)

Abbildung

Figure 2.1: Scheme of key factors impacting the climate of the Atacama Desert (yellow shading): Midlatitude storm track zone (blue  shad-ing), ENSO zone (red shading), which denotes the region with typically largest SST variability, the continental moistur
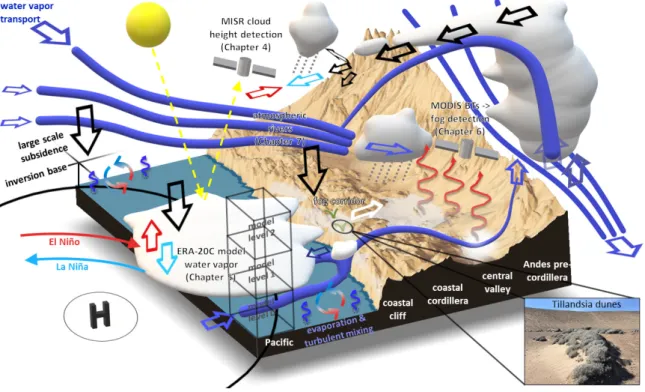
Figure 3.1: Schematic overview of atmospheric water cycle elements for the Atacama Desert which are addressed in this thesis
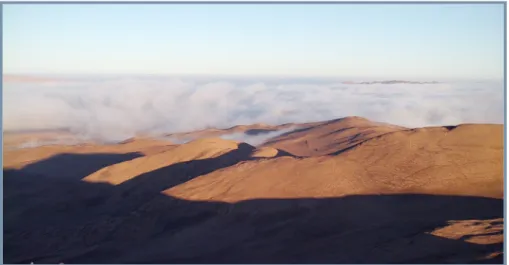
Figure 3.2: Photograph of retreating inland fog taken by a trail camera on 29 June 2017 at 8 CLT (about 30 minutes after sunrise) at weather station 13 – Cerros de Calate, Chile facing the Pacific Ocean (May and Hoffmeister, 2018).
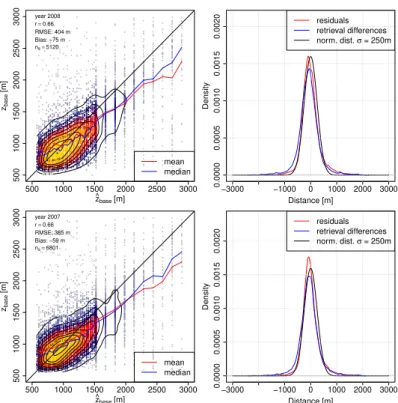
Figure 4.7: Left: Joint density of z base and ˆ z base for the year 2008 (top) which is used to estimate parameters of the algorithm and for the year 2007 (bottom) which is used to validate the stability of the algorithm with the estimated parameters
+7

Referenzen

ÄHNLICHE DOKUMENTE

[r]

In spite of the similarities of the evaluative conditioning procedure to classical conditioning experiments, it has been argued that changes in meaning, attitude, or valence

(Sonderdruck aus: Die Reichsabtei Lorsch, Festschrift zum Gedenken an ihre Stiftung 764).. Schützeichel, Altfränkische Grammatik, § 84.. Bergmann, Verzeichnis, Nr.

FEIFEL, G., LOREEZ, W., ADT, M., GASTPAR, H.. Inhibition of histamine release, release of diamine oxidase or processes independent on histamine are discussed as mode

Referate der zehnten Friihjahrstagung 273 Das Fehlen des Coronareffektes kann dadurch bedingt sein, dab die Ester Carbochromen und C 132 in vitro und in vivo sehr schnell

Computer calculations show that there exist no large stable deviations from the homogeneous vortex den- sity in an annulus or cylinder; the solutions of Masson

[r]

Im Ergebnis ist daher festzuhalten: Im Rahmen der Haftung aus unerlaubter Handlung ist jeder einzelne für das von ihm an den Tag gelegte Verhalten selbst verantwortlich, so daß