www.ocean-sci.net/12/861/2016/
doi:10.5194/os-12-861-2016
© Author(s) 2016. CC Attribution 3.0 License.
Observed El Niño conditions in the eastern tropical Pacific in October 2015
Lothar Stramma1, Tim Fischer1, Damian S. Grundle1,a, Gerd Krahmann1, Hermann W. Bange1, and Christa A. Marandino1
1GEOMAR Helmholtz Centre for Ocean Research Kiel, Düsternbrooker Weg 20, 24105 Kiel, Germany
anow at: Bermuda Institute of Ocean Sciences (BIOS), 17 Biological Station, St George’s GE 01, Bermuda Correspondence to:Lothar Stramma (lstramma@geomar.de)
Received: 11 March 2016 – Published in Ocean Sci. Discuss.: 24 March 2016 Revised: 6 June 2016 – Accepted: 10 June 2016 – Published: 4 July 2016
Abstract. A strong El Niño developed in early 2015. Mea- surements from a research cruise on the R/VSonnein Oc- tober 2015 near the Equator east of the Galapagos Islands and off the shelf of Peru are used to investigate changes re- lated to El Niño in the upper ocean in comparison with ear- lier cruises in this region. At the Equator at 85◦300W, a clear temperature increase leading to lower densities in the upper 350 m had developed in October 2015, despite a concurrent salinity increase from 40 to 350 m. Lower nutrient concentra- tions were also present in the upper 200 m, and higher oxy- gen concentrations were observed between 40 and 130 m.
In the equatorial current field, the Equatorial Undercurrent (EUC) east of the Galapagos Islands almost disappeared in October 2015, with a transport of only 0.02 Sv in the equa- torial channel between 1◦S and 1◦N, and a weak current band of 0.78 Sv located between 1 and 2◦300S. Such near- disappearances of the EUC in the eastern Pacific seem to occur only during strong El Niño events. Off the Peruvian shelf at∼9◦S, characteristics of upwelling were different as warm, saline, and oxygen-rich water was upwelled. At∼12,
∼14, and∼16◦S, the upwelling of cold, low-salinity, and oxygen-poor water was still active at the easternmost stations of these three sections, while further west on these sections a transition to El Niño conditions appeared. Although from early 2015 the El Niño was strong, the October measure- ments in the eastern tropical Pacific only showed developing El Niño water mass distributions. In particular, the oxygen distribution indicated the ongoing transition from “typical”
to El Niño conditions progressing southward along the Peru- vian shelf.
1 Introduction
The El Niño–Southern Oscillation (ENSO) cycle of alternat- ing warm El Niño and cold La Niña events is the dominant year-to-year climate signal on earth. ENSO originates in the tropical Pacific through interaction between the ocean and the atmosphere, but its environmental and socioeconomic im- pacts are felt worldwide (McPhaden et al., 2006). In the east- ern tropical South Pacific, El Niño events strongly influence the commercial fishery and weather and impact on the eco- nomics and living conditions.
The strongest El Niño events since 1950 were observed in the years 1982/83 and 1997/98, the latter also referred to as “the climate event of the twentieth century” (Changnon, 2000). Climate models suggest a doubling in the occurrences of extreme El Niño events in the future in response to green- house warming (Cai et al., 2015). In early 2015, an El Niño with strength similar to the 1997/98 El Niño developed.
Sea surface temperature anomalies were strongest along the Equator and the tropical North Pacific, while the develop- ment of a temperature anomaly in the eastern tropical Pacific off Peru was, according to NOAA’s “ENSO diagnostic dis- cussion archive”, strong in April and May, and then weak- ened and intensified again from August to October 2015.
El Niño dynamics modulate near-surface temperature, salinity, and density, as well as the mixed layer depth, oxy- cline depth, and the vertical extent of the low oxygen layer (e.g., Fuenzalida et al., 2009). In the eastern Pacific, ENSO variability is most pronounced along the Equator and the coasts of Ecuador and Peru (Wang and Fiedler, 2006), but also off Chile (e.g., Ulloa et al., 2001). Weaker trade winds
during El Niño conditions result in a weaker equatorial cir- culation with a generally observed weakening or disappear- ance of the Equatorial Undercurrent (EUC) (Kessler and McPhaden, 1995; Johnson et al., 2002). During the height of an El Niño event, the EUC episodically disappears in the western and central Pacific and partially reverses (Fir- ing et al., 1983; McPhaden et al., 1990; Johnson et al., 2000;
Izumo, 2005), while in the eastern Pacific, episodic disap- pearance of the EUC seems rare (Halpern, 1987; McPhaden and Hayes, 1990; Seidel and Giese, 1999; Johnson et al., 2000; Izumo, 2005). El Niño events lead to a pronounced eastward extension of the western Pacific warm pool and to a development of atmospheric convection, and hence a rainfall increase, in the usually cold and dry eastern Pacific (Cai et al., 2015).
Past El Niño events have been observed to have different local occurrences and parameter distributions in recent years.
There has been evidence of an increased occurrence of El Niño events in the central Pacific called Central Pacific (CP) El Niño or “El Niño Modoki” (e.g., Ashok and Yamagata, 2009; Dewitte et al., 2012), different from the cold tongue, or Eastern Pacific (EP), El Niño events that develop in the east- ern Pacific. For a typical CP El Niño, the largest sea surface temperature (SST) increase occurs at the Equator between 130◦W and 160◦E, while cooling appears off the shelf of Peru. For the EP El Niño the SST increases at the Equator east of 180◦W to South America and southward along the South American coast to Chile (e.g., Dewitte et al., 2012).
In the eastern tropical South Pacific (ETSP), a subsurface low oxygen zone exists with a pronounced minimum in oxy- gen at ∼100 to 500 m depth and is referred to as an oxy- gen minimum zone (OMZ) or oxygen deficient zone (ODZ).
This ODZ is suboxic (oxygen concentrations below ∼4.5–
10.0 µmol kg−1; e.g., Karstensen et al., 2008; Stramma et al., 2008). In suboxic regions nitrate and nitrite become involved in respiration processes such as denitrification or anammox (e.g., Kalvelage et al., 2013). In the eastern equatorial Pa- cific the oxygen content has been shown to increase during El Niño events in the upper 300 to 350 m in the equato- rial channel (e.g., Fuenzalida et al., 2009; Czeschel et al., 2012), as well as off the Peruvian coast (e.g., Helly and Levin, 2004). Coastal winds during El Niño events are usu- ally upwelling favorable, and thus could not produce the ob- served warming (Kessler, 2006). Coastal warming during El Niño is caused by downwelling Kelvin waves generated by mid-Pacific westerly wind anomalies that deepen the east- ern thermocline, nutricline, and oxycline and allow warm- ing to occur, independent of the local winds (Kessler, 2006).
Consequently, during El Niño events the upwelled water off Peru is warmer, more oxygen replete and less nutrient rich.
El Niño, in general, results in a depressed thermocline and thus reduced rates of macronutrient supply and primary pro- duction (Pennington et al., 2006) off Peru, which also con- tributes to an oxygen increase on the shelf (Gutiérrez et al., 2008). In the case of strong El Niño events when the oxygen
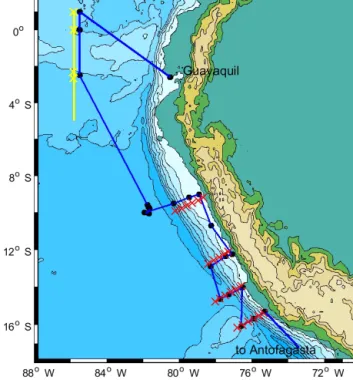
Figure 1. Cruise track (blue line) and CTD (conductivity–
temperature–depth) stations (black circles) of cruise R/V Sonne from Guayaquil 5 October to Antofagasta 22 October 2015, as well as equatorial stations March 1993, February 2009, and Novem- ber 2012 (yellow “x”), CTD sections off Peru December 2012 (red
“x”), and ADCP sections across the Equator (yellow line). Topog- raphy (color) with depth/height contours in 1000 m intervals en- hanced by the 200 m depth contour.
concentration above the shelf bottom increases from about zero to > 40 µmol kg−1, the sediments respond with tremen- dous changes in ecological state (Gutiérrez et al., 2008). At a time-series station at∼12◦S, 77◦300W off Lima from 1996 to 2010 for temperature, salinity, density, oxygen, and nutri- ents, the influence of El Niño – especially the strong 1997/98 El Niño – is clearly visible, with higher temperature, salinity, and oxygen, and lower density, nitrite, silicate, and phosphate (Graco et al., 2016).
Here we use measurements from an R/VSonneresearch cruise in October 2015 (Fig. 1) from a section across the Equator east of the Galapagos Islands and from four sec- tions off the Peruvian shelf, to investigate changes in the up- per ocean related to the strong 2015 El Niño in comparison with earlier cruises in this region. The aim is to unravel the progress of the transition to El Niño conditions in the eastern Pacific several months after the start of the El Niño.
2 Data sets and methods
In October 2015 an R/VSonnetransit cruise (So243; 5 to 22 October 2015) from Guayaquil, Ecuador, to Antofagasta, Chile, was carried out (Fig. 1) (short cruise report available
at https://www.ldf.uni-hamburg.de/sonne/wochenberichte/
wochenberichte-sonne/so242-243/so243-scr.pdf), which allowed us to investigate possible El Niño signals at the Equator near 85◦300W and off the shelf of Peru at sections perpendicular to the shelf at∼9,∼12,∼14, and∼16◦S.
A Seabird CTD system with a GO (General Oceanics) rosette with 24×10 L water bottles was used for water profil- ing and discrete water sampling. The CTD system was used with double sensors for temperature, conductivity (salinity), and oxygen. The dual CTD temperature sensors calibrated by the manufacturer are compared during the cruise so that the deviation is less than 0.002◦C, and the accuracy of the tem- perature measurements is estimated to be 0.002◦C or bet- ter. The CTD salinity calibration with salinometer salinity samples resulted in a rms uncertainty of 0.0011. The CTD oxygen sensors were calibrated with oxygen measurements obtained from discrete samples from the rosette applying the classical Winkler titration method, using a non-electronic titration stand (Winkler, 1888; Hansen, 1999). The rms un- certainty of the CTD oxygen sensor calibration of cruise So243 was determined to be ±0.8 µmol kg−1. Oxygen con- centrations of less than 3 µmol kg−1are not resolved by Win- kler titration and values below 3 µmol kg−1 were used as 0 µmol kg−1 for the sensor calibration, as the H2S smell of the water of related rosette bottles indicated 0 µmol kg−1.
Nutrients were measured on-board with a QuAAtro auto- analyzer (Seal Analytical). Nitrite (NO−2), nitrate (NO−3), phosphate (PO3−4 ), and silicid acid (Si(OH)4, referred to as silicate hereinafter) were measured with an analytical preci- sion of 5.5, 1.3, 0.4, and 0.5 % respectively. The N : P ratio used here was computed as N : P=(NO−3+NO−2): PO3−4 .
Two vessel-mounted acoustic Doppler current profilers (ADCP) were used to record ocean velocities in Octo- ber 2015: an RDI OceanSurveyor 75 kHz ADCP with 8 m bin spacing provided the velocity distribution to∼650 m depth, while a 38 kHz ADCP with 32 m bin spacing provided veloc- ity profiles down to∼1300 m depth. During the entire cruise the navigation data was of high quality. Due to the interest in the upper ocean, the higher-resolution 75 kHz ADCP is used here.
Earlier crossings of the Equator (Table 1 and Fig. 1) were accomplished in March/April 1993 on R/V Knorr (Tsuchiya and Talley, 1998), in February 2009 on R/VMe- teor(Czeschel et al., 2011), and in November 2012 on R/V Meteor(Stramma et al., 2013) at 85◦500W. Sections across the Peruvian shelf between 9 and 16◦S were made during R/VMeteorcruise M91 in December 2012 (Czeschel et al., 2015; Bange, 2013). Measurement accuracies during these cruises were similar to October 2015 and the details are de- scribed in the related literature. In contrast to October 2015, the CTD stations in 1993, 2009, and 2012 were not car- ried out at 2◦300S, 85◦300W, but at 2◦200S and 2◦400S at 85◦500W, and these two stations were combined for a mean profile at 2◦300S. The sections across the Equator and off
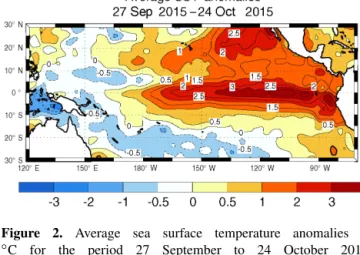
Figure 2. Average sea surface temperature anomalies in
◦C for the period 27 September to 24 October 2015.
Image with permission from NOAA extracted from the http://www.cpc.ncep.noaa.gov/products/analysis_monitoring/
lanina/enso_evolution-status-fcsts-web.pdf file version from 26 October 2015, redrawn with very minor modifications to improve the figure quality.
the Peruvian shelf were not at identical geographical coordi- nates, but we expect that the offset will be small compared to the differences measured.
Different indices exist to describe the El Niño status and will be used here to determine the El Niño status at the time of the measurements. The NINO 1+2 index is the temper- ature difference compared to the 1982–2005 climatological cycle in the eastern tropical Pacific (0–10◦S, 80–90◦W), and is close to the region of the measurements used here. The Oceanic Niño Index (ONI) has become a standard for iden- tifying El Niño and La Niña events. It is a running 3-month mean SST anomaly for the Niño 3.4 region (i.e., 5◦N–5◦S, 120–170◦W) related to the 1981–2010 base period. Events are defined as five consecutive overlapping 3-month periods at or above the 0.5◦C anomaly for warm El Niño events, and at or below the−0.5◦C anomaly for cold La Niña events.
3 The El Niño in 2015
The SST anomaly for 27 September 2015 to 24 October 2015 was strong along the Equator to the South American con- tinent and southward off the Peruvian coast (Fig. 2). The NINO 1+2 index was high at+2.52 in October 2015 (Ta- ble 1); hence, the 2015 El Niño is a clear EP El Niño. The SST distribution in fall 2015 shows a strong and promi- nent SST increase along central America and in the east- ern North Pacific at 20–25◦N that differs from the typical EP El Niño distribution. This feature, also known as “The Blob”, is an unrelated positive temperature anomaly that de- veloped in 2013 in the Gulf of Alaska and progressed along the North American continent to the 20–25◦N region in mid- 2015 (Kintisch, 2015).
Table 1.Time and geographical location of CTD data used in this study and the NINO 1+2 and ONI indices for the months of observation or for 2 months for measurements carried out at the end or beginning of a month listed in the tables (http://www.cpc.ncep.noaa.gov/data/
indices/sstoi.indices and http://www.cpc.ncep.noaa.gov/products/analysis_monitoring/ensostuff/ensoyears.shtml).
Time Location NINO 1+2 ONI
29–31 Mar 1993 1◦N–2◦400S +0.65 Mar,+0.97 Apr +0.5 March,+0.7 Apr 12–13 Feb 2009 1◦N–2◦400S −0.11 −0.7
1–3 Nov 2012 1◦N–2◦400S −0.11 Oct,−0.38 Nov +0.4 Oct,+0.2 Nov
7–8 Oct 2015 1◦N–2◦300S +2.52 +2.0
6–23 Dec 2012 ∼9◦S–∼16◦S −0.68 −0.2 10–19 Oct 2015 ∼9◦S–∼16◦S +2.52 +2.1
Figure 3. ONI for the strong El Niño years 1972 (dash-dotted), 1982 (dotted), 1997 (dashed), and the years used here: 1993 (green), 2009 (blue), 2012 (red), and 2015 (black line). The months of mea- surements used here are marked by colored dots.
The only El Niño events since 1950 with an October max- imum ONI of more than 1.7, or an overall maximum of 2.0 or larger, are the 1972/73, 1982/83, and 1997/98 El Niños.
In early 2015 the ONI was even larger than the ONI of these three large El Niño events, while in October 2015 it was at a similar strength as the three earlier strong El Niños (Fig. 3).
Accordingly, the 2015 El Niño has to be listed as one of the four strongest El Niños since 1950.
4 The equatorial region east of the Galapagos Islands 4.1 The hydrographic variability
4.1.1 Background information
The hydrographic distribution in the eastern equatorial Pa- cific is influenced by a seasonal cycle as well as El Niño- related cycles. At 110◦W in the eastern Pacific west of the Galapagos Islands, relationships between zonal veloc- ity, temperature, and salinity in the EUC are all evident
in the seasonal cycle. The EUC peaks in strength around April/May, when it also surfaces (Johnson et al., 2002). The thermocline is extremely sharp and shallow. The meridional equatorial spreading of the thermocline associated with the EUC zonal velocity strength is noticeably stronger during April than in October, when in April equatorial SST is lowest and the South Equatorial Current (SEC) is strongest (Johnson et al., 2002). The laterally isolated salinity maximum within the thermocline just south of the Equator is strongest when the EUC velocity is at its greatest (Johnson et al., 2002), and this is also visible in the sea surface salinity (Supplement Fig. S1) from the MIMOC climatology (Schmidtko et al., 2013). Between austral fall and winter the minimal oxygen concentration of the ODZ core in the eastern South Pacific at the Equator changes from 8 to 5 µmol O2L−1(Paulmier and Ruiz-Pino, 2009).
Weaker trade winds during El Niño conditions result in a weaker equatorial circulation, while stronger trade winds during La Niña conditions lead to a stronger equatorial circu- lation (Johnson et al., 2002). During La Niña, the current sys- tem at 110◦W is spun upwards when compared to El Niño.
The cold tongue located in the eastern tropical Pacific is quite weak during El Niño. Surface salinities are generally fresher during El Niño than during La Niña, a feature that is at least partially a product of increased local precipitation associated with the eastward migration of warm sea surface tempera- tures and convection, and partly a result of the reduced trade winds (Johnson et al., 2002). For the 1996–1998 El Niño–La Niña cycle, a fresh mixed layer in the eastern equatorial Pa- cific and higher salinity within the pycnocline (defined by the 20◦C isotherm) during the El Niño was observed. The higher salinity was caused by the larger equatorward spreading of the subsurface salinity maximum of the South Pacific Trop- ical Water (SPTW) due to anomalous eastward flow south of the Equator with the relaxation of the South Equatorial Current and the weaker EUC at the Equator (Johnson et al., 2000). Hence, during El Niño events higher salinity should be expected near the pycnocline.
Figure 4. Upper 100 m profiles at the Equator at 85◦500W for 30 March 1993 (green), 12 February 2009 (blue), 2 November 2012 (red), and at the Equator at 85◦300W for 7 October 2015 (black) for (a) oxygen in µmol kg−1, (b) potential temperature in ◦C, (c)salinity, and(d)potential density in kg m−3.
4.1.2 Observations for the 2015 El Niño
SST anomalies for the period 27 September to 24 Octo- ber 2015 showed an SST anomaly of 2.0–2.5◦C at 85◦300W at and south of the Equator, and of 1.5–2.0◦C just north of the Equator (Fig. 2). In the upper 100 m of the water col- umn, oxygen, temperature, salinity, and density profiles at the Equator on the ∼85◦300W meridian (Fig. 4) reveal differ- ences between March 1993, February 2009, November 2012, and the El Niño of October 2015. It is important to note that 1993 was not defined as an official El Niño year as only four, instead of five, consecutive overlapping 3-month peri- ods were at or above the 0.5◦C anomaly. However, in March and April 1993 the NINO 1+2 index reached +0.65 and +0.97 (Table 1) and had El Niño-like SST anomalies. To this end, we will refer to March 1993 as ‘El Niño-like” here- inafter.
In February 2009 the ONI was for the fourth and last month −0.5 or less; therefore, conditions were similar to a weak La Niña event and we will refer to it as “La Niña- like” hereinafter. In February 2009, in the upper 100 m at the Equator at∼85◦300W, the oxygen and temperature were lowest and the density highest compared to the other three periods (Fig. 4), representing an expected La Niña parame- ter distribution. The hydrographic profiles in the neutral ONI period in November 2012 mainly lay between the El Niño profiles for March 1993 and October 2015, and the La Niña- like profiles in February 2009. The November 2012 profiles were somewhat closer to the February 2009 profiles. The El Niño profiles in October 2015 and the El Niño-like profiles in March 1993 showed slightly higher oxygen concentrations
Figure 5.Same as Fig. 4 but for 100 to 400 m depth.
and temperature, and lower density in the upper 100 m in comparison to November 2012 and February 2009 (Fig. 4).
In October 2015 the salinity compared to the 3 other years was lowest in a deep thermocline in the upper 40 m, as ex- pected for the surface layer during an El Niño event be- cause of the increased precipitation and reduced equatorial upwelling. In contrast, a weak salinity maximum was located below 40 m, as expected near the pycnocline as saline warm water progresses from the western Pacific eastward during El Niño. In October 2015 the higher temperature, higher salin- ity, and lower density reached down to∼350 m, while the oxygen profile below 130 m merges with the profiles from the other measurement periods (Fig. 5).
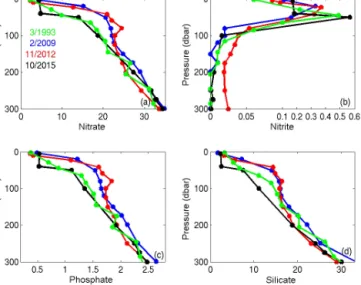
The strong thermocline/pycnocline of the eastern tropical Pacific is also a strong nutricline. A consistent general pattern is that nitrate and phosphate increase with depth to∼500 m with a slight maximum at intermediate depths, while sili- cate continues to increase with depth (Fiedler and Talley, 2006). The vertical distribution of nutrients at the Equator at∼85◦300W shows lower nitrate, phosphate, and silicate concentrations in the upper 200 m in October 2015 as well as in the El Niño-like year 1993 in comparison to the 2009 and 2012 concentrations (Fig. 6). A primary nitrite max- imum (PNM) usually occurs in the lower euphotic zone, which results from nitrite excretion by phytoplankton and/or a decoupling of ammonia and nitrite oxidation (i.e., higher rates of ammonia vs. nitrite oxidation; Fiedler and Talley, 2006; Lomas and Lipschultz, 2006). At the Equator in the eastern Pacific nitrite is close to undetectable below 100 m depth (Fig. 6). In 1993 and 2015, however, the PNM was located∼25 m deeper and maximum nitrite concentrations were considerably higher. This reflects the deeper pycnocline in El Niño years. The enhanced nitrite concentrations seem to be caused by the northward transport of high nitrite concen- tration found in the PNM of the SPTW (e.g., Tsuchiya and
Figure 6. Upper 300 m profiles at the Equator at 85◦500W for 30 March 1993 (green), 12 February 2009 (blue), 2 November 2012 (red), and at the Equator at 85◦300W for 7 October 2015 (black) for(a)nitrate in µmol L−1,(b)nitrite in µmol L−1(scale change at 0.1µmol L−1), (c) phosphate in µmol L−1, and(d) silicate in µmol L−1.
Talley, 1998, and as observed during cruise M90) in com- bination with a reduced photo inhibition of ammonia oxida- tion at deeper water depths (see, e.g., Ward, 2008; Grundle et al., 2013). Furthermore, the deep thermocline and pycno- cline in October 2015 indicate that equatorial upwelling was reduced. According to the upper ocean hydrographic and nu- trient distribution in October 2015, a clear El Niño situation had adjusted at the Equator at∼85◦300W.
At 1◦N,∼85◦30◦W in the 50–300 m layer, salinity and temperature were higher and the density lower in October 2015 than at the other three times; however, the oxygen was not significantly higher during this time (Fig. S2). At 2◦300S,
∼85◦300W in the 50 to 250 m layer, the salinity, tempera- ture, and oxygen were lower and the density higher in the La Niña-like month of February 2009 than in the other 3 years.
The temperature at 2◦300S in the El Niño of October 2015 was higher in the 50 to 250 m depth range than in the other 3 years and salinity showed slightly higher values at∼50 to 100 and 150 to 250 m depth. The oxygen concentration was slightly higher only in the upper ∼60 m for both El Niño events in March 1993 and in October 2015 compared to 2009 and 2012 (Fig. S3). However, earlier selected measurements at 4◦S, 85◦W showed a clear oxygen increase to a depth of
∼350 m depth for the El Niño years 1982/83 in comparison to non-El Niño measurements (Czeschel et al., 2012); hence, we conclude that El Niño influence on the water mass dis- tribution was still weak at 2◦300S in October 2015 and only developing in the upper ocean.
4.2 Circulation observations 4.2.1 Background information
The EUC, which carries oxygen-rich water towards the ODZs of the eastern Pacific, has a seasonal cycle, with a transport peak in the eastern Pacific at 95◦W in April/May of ∼30 Sv and a minimum in October/November of a lit- tle less than 15 Sv (Johnson et al., 2002; their Fig. 17).
The Galapagos Islands form a barrier to the EUC, which causes it to bifurcate into a shallow/southern core centered at∼50 m depth (EUCs) and a deeper/northern core centered at∼150 m depth (EUCd) (Karnauskas et al., 2010). We are not aware of any El Niño-related EUC variability observa- tions east of the Galapagos Islands. Results from an ocean model for 110◦W show an increase in the surface eastward EUC current during austral fall, while during other seasons the EUC is at deeper depth (Cravatte et al., 2007). ROMS (Regional Ocean Model System) model results (Montes et al., 2011) for El Niño periods east of the Galapagos Islands show the EUC flowing at a shallower depth associated with lighter water. The model runs display a weakening and south- ward shift of the EUC branches east of the Galapagos Islands with weaker transports, which are variable, depending on the boundary conditions provided by different ocean general cir- culation models (OGCMs). The modeled ROMS EUC trans- ports at 86◦W between 2◦N and 2◦S at 200 m depth for February/March and October/November depending on the OGCMs are∼10–12 and∼7–8 Sv for OCCAM,∼6–8 and 4–5 Sv for SODA, and∼5.5 and 7–8 SV for ORCA (Echevin et al., 2011).
During the 1997/98 El Niño shipboard current measure- ments showed that the EUC virtually disappeared across much of the Pacific basin, associated with the weakening or even the reversal of the equatorial pressure gradient within the pycnocline (Johnson et al., 2000). For the 1982–1983 El Niño there seems to be a strong time delay for the EUC weak- ening. In September 1982 at 159◦W, the EUC reversed (Fir- ing et al., 1983); however, at 95◦W, the EUC was strong in November 1982 before being replaced by a westward jet in May 1983 (Hayes et al., 1986).
4.2.2 Observations for the 2015 El Niño
The direct velocity observations in October 2015 on the di- agonal section from the Ecuadorian shelf to 1◦N, 85◦300W, show only a weak signature of the zonal EUC in the upper 100 m located mainly at, and south, of the Equator (Fig. 7a).
The weak transport of the EUC is 0.01 Sv between 1◦S and 1◦N, and 0.29 Sv between 2◦300S and 1◦S. The westward flow in the upper 200 m is mainly connected to a northward flow direction (Fig. 7b) north of 1◦S. This northwesterly flow indicates the flow of oxygen-poor water from the ODZ off the South American continent to the west near the Equator.
Figure 7.ADCP zonal (positive eastward)(a)and meridional (posi- tive northward)(b)velocity sections (in m s−1)on the diagonal sec- tion from the Ecuadorian shelf at∼2◦300S to 1◦N, 85◦300W on 5 and 6 October 2015 (see Fig. 1). The contour interval is 0.1 m s−1.
The direct velocity observations on the meridional section at 85◦300W between 1◦N and 2◦300S and the diagonal con- tinuation to 5◦S, 84◦160W again show the weak signature of the EUC in the upper 100 m located mainly at and south of the Equator north of 2◦300S in October 2015 (Fig. 8d). The EUC transport in the upper 300 m is 0.02 Sv between 1◦S and 1◦N and 0.78 Sv between 2◦300S and 1◦S (Table 2). The stronger eastward flow component in the upper 200 m be- tween 3◦S and 4◦S might be a combination of the EUC and the Southern Subsurface Countercurrent (SSCC; also called the Tsuchiya Jet), as described for El Niño periods east of the Galapagos Islands in model results (Montes et al., 2011).
The eastward flow near 2◦S below 200 m is the South Inter- mediate Countercurrent (SICC).
The strongest EUC in our four measurement periods oc- curred at the end of March 1993, with 12.77 Sv between 1◦S and 1◦N in the upper 300 m (Table 2; Fig. 8a). This measurement at the end of March was close to the time of eastern Pacific EUC peak transport in April/May. In addi- tion, it was at the beginning of an El Niño-like phase, where warmer, oxygen-rich water is transported from the western to the eastern tropical Pacific and could enhance the eastward flow component.
In February 2009 the EUC transport between 1◦S and 1◦N was weak (3.55 Sv), although it occurred only 2 months be- fore the time of the seasonal EUC peak transport. As pre- viously described, February 2009 was at the end of a short
Figure 8.Zonal ADCP velocity sections (in m s−1; positive east- ward; contour interval 0.1 m s−1)on the meridional path from 1◦N to 5◦S at 85◦500W(a)in March 1993,(b)in February 2009,(c)in November 2012, and(d)from 1◦N to 2◦300S at 85◦300W and di- agonal to 5◦S, 84◦120W in October 2015 (see Fig. 1).
La Niña-like period with an ONI of−0.7, and the low EUC transport might be related to a generally weak eastward trans- port of warm western equatorial Pacific water during La Niña. On a cruise approximately 1.5 months later in March to April 2009 between the Galapagos Islands and Ecuador, a region of possible strong cross-hemispheric exchange was observed immediately to the east of the Galapagos Islands, where a shallow (200 m) 300 km wide northeastward sur- face flow transported 7 to 11 Sv (Collins et al., 2013). This northeastward flow might have weakened the EUC transport at and south of the Equator. The two diagonal sections in March/April 2009 crossed the 85◦500W section at ∼1◦50 and 2◦300S and, similarly to the February 2009 measure- ments, showed a 50 m depth eastward and westward flow at 1◦50 and 2◦300S, respectively, and a westward flow at both of these latitudes at 200 m depth. In contrast to the veloc- ity distribution in March 1993, November 2012, and Octo- ber 2015 (Fig. 8), the eastward flow component in the upper 200 m south of 2◦300S almost disappeared in February 2009.
The EUC transport in November 2012 at 85◦500W be- tween 1◦S and 1◦N was 10.78 Sv in the upper 300 m (Ta- ble 2). The months before these measurements had no large ONI values and should represent the non-El Niño EUC trans- port in this region for November. The transport of 10.78 Sv in November at 85◦500W is less than the November minimum at 95◦W of∼15 Sv (Johnson et al., 2002; their Fig. 17), and seems to be a reasonable estimate east of the Galapagos Is- lands, as the EUC transport decreases in the eastern Pacific.
The core of the EUC below 200 m is quite deep and agrees with the seasonal cycle where the EUC should be located at deeper depth in austral spring.
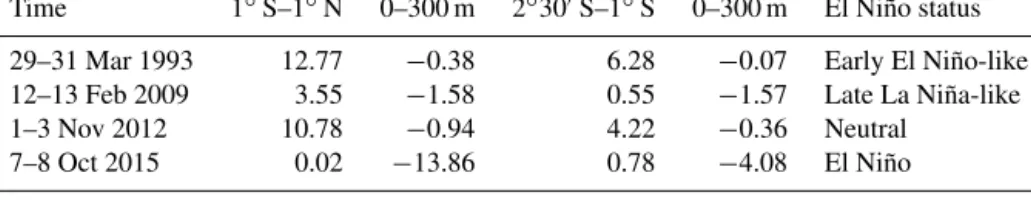
Table 2. Summed zonal positive (eastward) and negative (westward) ADCP transports in Sv (106m3s−1)in the equatorial channel at 85◦500W in March 1993, February 2009, and November 2012 and at 85◦300W in October 2015 as well as the related El Niño status. The velocity data were slightly smoothed and extrapolated to the surface.
Time 1◦S–1◦N 0–300 m 2◦300S–1◦S 0–300 m El Niño status 29–31 Mar 1993 12.77 −0.38 6.28 −0.07 Early El Niño-like 12–13 Feb 2009 3.55 −1.58 0.55 −1.57 Late La Niña-like
1–3 Nov 2012 10.78 −0.94 4.22 −0.36 Neutral
7–8 Oct 2015 0.02 −13.86 0.78 −4.08 El Niño
5 The upwelling region off Peru 5.1 Background information
Off Peru a highly productive year-round upwelling system is located between 4 and 16◦S (Chavez and Messié, 2009).
Since the 1950s, an SST decline corresponding to an increase in upwelling has been observed off Peru (Gutiérrez et al., 2011). The SST off Peru measured at six locations between 5 and 12◦S over a period of 6 years shows a seasonal cycle of 2 to 3◦C amplitude with the largest SST near March and the minimum near October (Montes et al., 2011; their Fig. 4).
This seasonal cycle is also visible in the MIMOC climatol- ogy for 9 and 12◦300S (Fig. S1). The time-series station at
∼12◦S, 77◦300W shows a seasonal cycle of about 20 m dis- placement for the 15◦C isotherm, the oxycline depth, and the upper boundary of the ODZ (Graco et al., 2016). Sea- sonal eddy fluxes are described along the coast of Peru, with the largest signal at approximately 15◦S with a peak during the austral winter (Vergara et al., 2016). The typical nutrient distribution along a cross-shelf section at 12◦S (as seen in December 2012) shows elevated phosphate concentrations in the surface waters near the coast, whereas nitrate is depleted in the water column and the near-surface waters close to the coast (Kock et al., 2016; their Fig. 3).
Conditions that develop along the coast of Ecuador, Peru, and northern Chile during El Niño events include a strength- ening of the poleward flow along the coast of Peru, persistent deepening of the thermocline, reducing or even reversing the prevailing upwelling-induced land–sea temperature gradient, and a southward shift in the position of the ITCZ (Inter- Tropical Convergence Zone), which brings heavy precipita- tion to normally arid regions (Strub et al., 1998). A reduc- tion in coastal cloud cover due to warmer water next to the coast may enhance insolation and reduce atmospheric pres- sure over land, maintaining the pressure difference and winds over the coast. As a result, upwelling-favorable winds are not greatly reduced when El Niño conditions are observed in the ocean (Enfield 1981; Huyer et al., 1987; Strub et al., 1998; Halpern et al., 2002). In general, upwelling-favorable winds and upwelling continue during El Niño events, and water continues to be drawn from 50 to 100 m depth to the surface layer, but the thermocline and nutricline are displaced
downward and thickened, so that upwelling during El Niño brings only warm and nutrient-poor water to the surface (En- field 1981; Huyer et al., 1987; Strub et al., 1998; Halpern et al., 2002). The intensity of the upwelling appears to be determined by an interplay between along-shore, poleward advection and wind intensity, but also by the cross-shore geostrophic flow and distribution of the water masses on a scale of 1000 km or more (Colas et al., 2008). In relation to the downward displacement of the thermocline and nu- tricline, the oxycline is also displaced downward. For the 1997/98 El Niño event, Helly and Levin (2004) described a possible depression of the upper layer of the ODZ (defined by oxygen concentrations < 0.5 mL L−1; ∼22.3µmol L−1) by 100 m, reducing the ODZ area off Peru and northern Chile (6–20◦S) by 61 % (from 77 000 to 30 000 km2).
5.2 Observations for the 2015 El Niño
The SST anomalies for the period 27 September to 24 Octo- ber 2015 (Fig. 2) showed a strong SST anomaly of 1.5–2.0◦C between 8 and 14◦S and a weaker anomaly of 0.5–1.5◦C between 14 and 20◦S. Differing hydrographic distributions were measured off Peru at ∼9◦S in December 2012 with a neutral ONI status and in October 2015 with the strong El Niño. In the entire upper 300 m at ∼9◦S, temperature, salinity (Figs. S4 and S5), and oxygen (Fig. 9) were higher in October 2015 than in December 2012. In contrast to the typical seasonal cycle that is characterized by lower SST in October than in December, the SST at 9◦S was higher in Oc- tober 2015 than in December 2012 as a result of the El Niño- related SST increase. Higher upper water column tempera- tures in October 2015 also correlated with lower densities in the upper 300 m (as can be seen from the selected isopycnals in Fig. 9) despite the concurrent influence on density from the salinity increase. Accordingly the density changes are temperature dominated. In December 2012 there was strong upwelling at∼9◦S with the < 5 µmol kg−1O2layer located below∼30 m depth, while in October 2015 this low oxygen layer was only found below 240 m depth. The October 2015 nutrient profiles obtained from shelf stations at∼9◦S with water depths of little more than 100 m (not shown) highlight the fact that nitrate, phosphate, and silicate concentrations were lower, and nitrite concentrations were higher in compar- ison to profiles from the same location in December 2012, as
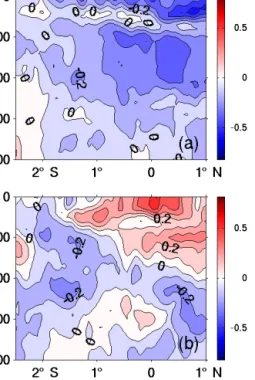
Figure 9.Oxygen section (color; in µmol kg−1; same color scale in both frames) at ∼9◦S off the Peruvian shelf for Decem- ber 2012(a)and October 2015(b). Three selected isopycnals are included as white dashed lines. Please note that the section in Octo- ber 2015 reaches further west than in December 2012.
would be expected for El Niño periods. Although the isopy- cnals and parameter distribution show that upwelling at 9◦S was occurring in October 2015, it is clear that warmer, saline, and oxygen-replete water was being upwelled, and that the contribution of oxygen-depleted and nutrient-rich water was strongly reduced.
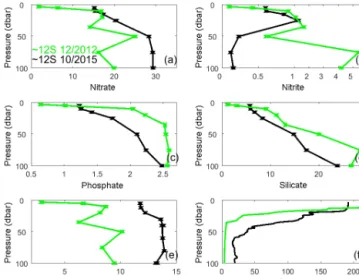
At∼12◦S the measured oxygen distributions for Decem- ber 2012 and October 2015 are quite similar in the upwelling region at the easternmost station pair with oxygen concen- trations of less than 5 µmol kg−1(Fig. 10). The oxygen con- centration between the isopycnalsσθ=25.6 and 25.8 kg m−3 was even lower in October 2015 than in December 2012 in the upwelling region east of∼77◦300W (Fig. 10). However, below the oxycline below 50 m depth, temperature, salinity, and oxygen concentrations (Fig. 11f) were higher in October 2015 than in December 2012 and indicate the transition to El Niño conditions. The seasonal signal in the time-series sta- tion at∼12◦S, 77◦300W shows a shallower 15◦C isotherm and oxycline depth of about 20 m in October than in Decem- ber (Graco et al., 2016); hence, the deeper oxycline in Octo- ber 2015 compared to December 2012 is not a seasonal sig- nal but an El Niño influence. The nutrient distribution at the shelf at∼12◦S (Fig. 11) also shows El Niño influence with lower phosphate and silicate in October 2015 than in Decem- ber 2012. This is in agreement with the observed increase in temperature and salinity, and the lower phosphate and sili- cate at the time-series station at ∼12◦S during the strong 1997/1998 El Niño (Graco et al., 2016). Under El Niño con- ditions upwelling is reduced and this prevents nutrients such as phosphate and silicate from becoming enriched in the mixed layer. Nitrate and nitrite are different, however, be- cause their distributions are driven more by oxygen availabil- ity, which regulates nitrification and denitrification. Indeed, nitrate was lower and nitrite was higher in December 2012 than in October 2015, with nitrite reaching 5.4 µmol L−1at 75 m in December 2012 (Fig. 11), consistent with the obser- vations of Kock et al. (2016). At the depths of the high nitrite concentrations in December 2012, very low oxygen concen- trations of less than 2 µmol kg−1were measured. Under low oxygen conditions, incomplete nitrification, incomplete den- itrification, or a combination of both, can result in accumula-
Figure 10.Oxygen section (color; in µmol kg−1; same color scale in both frames) at∼12◦S off the Peruvian shelf for December 2012 (a)and October 2015(b). Three selected isopycnals are included as white dashed lines.
Figure 11.Nutrient profiles at shelf stations with water depth of slightly more than 100 m in December 2012 at 12◦150S, 77◦310W (green) and in October 2015 at 12◦210S, 77◦250W (black) for(a) nitrate in µmol L−1, (b) nitrite in µmol L−1, (scale change at 1 µmol L−1),(c)phosphate in µmol L−1,(d)silicate in µmol L−1, (e)N : P ratio, and(f)CTD oxygen in µmol kg−1.
tions of nitrite (e.g., Codispoti and Christensen, 1985; Gru- ber, 2008; Brockmann and Morgenroth, 2010), as was likely the case during 2012. The higher oxygen concentrations in the ODZ at∼12◦S during October 2015 would have pre- vented the build-up of nitrite, as under these conditions deni- trification shuts off and nitrification goes to completion, pro- ducing more nitrate.
Another notable difference between December 2012 and October 2015 at∼12◦S is the lower N : P ratios in the upper 150 m during 2012 vs. 2015 (Fig. S6e). Again, higher oxy- gen concentrations in the upper 150 m during the 2015 El Niño probably reduced the impact of fixed N loss processes on the N : P signatures of near-surface waters. These results imply that El Niño conditions could, at least, partially alle- viate phytoplankton N limitation due to the reduction in the magnitude of denitrification. While it is beyond the scope of the focus of this study, it would be interesting to exam- ine whether this increase in N : P ratios during the 2015 El
Niño impacted the phytoplankton communities within this region. The expectation that they may have impacted the phy- toplankton communities is certainly reasonable (Rousseaux and Gregg, 2012), as Hauss et al. (2012) observed an increase in diatom biomass when the NO−3 : PO3−4 ratios of water col- lected from the Peruvian upwelling region were increased.
The results from ∼12◦S shelf water indicate that up- welling of oxygen-poor water was still continuing in Octo- ber 2015 at 12◦S in the near-surface layer, despite the en- hanced SST anomaly related to El Niño. Below the oxycline, however, El Niño conditions were developing. The observa- tions west of 77◦480W in the upper 75 m show that oxygen as well as temperature (not shown) were lower in October 2015, maybe related to a stronger poleward flow of the Peru–Chile Undercurrent (PCUC), which has been shown to be a charac- teristic of El Niño events (Strub et al., 1998). The PCUC ad- vects seawater property anomalies from equatorial to extrat- ropical regions and shoals during El Niño despite the velocity and transport intensification (Montes et al. 2011; Chaigneau et al., 2013).
At ∼14◦S at the easternmost station near the shelf, the oxygen distribution is quite similar for December 2012 and October 2015 (Fig. S6), indicating non-El Niño oxygen-poor upwelling near the shelf. West of 77◦W, the isopycnals are deeper in October 2015, related to a deeper thermocline with warmer water in the upper 100 m (not shown) and higher oxygen in October 2015 compared to December 2012. Sim- ilar to∼12◦S the nutrient distribution shows higher nitrate and lower phosphate and silicate in October 2015 compared to December 2012 at∼14◦S. As outlined above, the higher nitrate concentrations in October 2015 likely result from less denitrification and more complete nitrication, as a result of the increased oxygen concentrations, and this again provides evidence of a developing El Niño situation.
At ∼16◦S the oxygen concentrations at the shelf were lower in October 2015 than in December 2012 (Fig. S7), in- dicating similarity to∼14◦S non-El Niño upwelling close to the shelf. The higher oxygen near the shelf in December 2012 was probably related to an unusual distribution related to an eddy located near the∼16◦S section (e.g., Stramma et al., 2013; Czeschel et al., 2015). The SST at∼14 and ∼16◦S was lower in October 2015 than in December 2012; hence, the slight increase in SST by El Niño did not compensate for the typical seasonal SST signal. Different to the sections at
∼9◦S,∼12, and∼14◦S, at∼16◦S the density distribution below the thermocline did not shift to higher densities in Oc- tober 2015, which shows that the El Niño influence at 16◦S was the weakest of the four shelf sections. The observed tran- sitional feature of normal conditions near-shore and El Niño conditions offshore is probably a consequence of the cross- shore pattern in vertical velocity during upwelling. The near- shore vertical velocity is expected to be substantially larger than the offshore vertical velocity (Fennel, 1999). A down- welling Kelvin wave could then neutralize the weak offshore upwelling and bring down the thermocline, while near-shore
the strong upwelling would hardly weaken and for some time still bring up remnants of cold oxygen-poor water, until sup- plies feed from the offshore warmer and oxygen-replete wa- ters. The wind field would not need to change in order to produce this transition pattern in hydrography.
6 Conclusions
In this study, hydrographic measurements from a cruise to the eastern tropical Pacific in October 2015 were used to in- vestigate the signal of the strong 2015 El Niño in the wa- ter mass distribution and in the EUC in comparison to mea- surements from the years 1993, 2009, and 2012. An increase in temperature from the surface to 350 m depth, and salin- ity in the 40 to 350 m depth layer, appeared at the Equator east of the Galapagos Islands at 85◦300W in October 2015.
The warmer temperature led to lower densities despite the concurrent influence of the salinity increase on density. In October 2015, nitrate, phosphate, and silicate concentrations were all lower in the upper 200 m when compared with previ- ous non-El Niño periods; however, higher oxygen concentra- tions, which are characteristic of El Niño events, were only located between 40 and 130 m at the Equator. Except for an oxygen increase in the upper∼60 m at 2◦300S, no obvious large vertical oxygen increase appeared at 1◦N and 2◦300S at 85◦300W. This weak oxygen increase at and near the Equator might be related to the weak EUC, which would otherwise be expected to bring oxygen-richer water eastwards.
Due to the influence of seasonal and El Niño signals, the velocity and transport observations of the EUC east of the Galapagos Islands were quite variable in the direct veloc- ity measurements in different years. In addition, intrasea- sonal signals with the passage of upwelling and downwelling waves at intraseasonal timescales (Cravatte et al., 2003;
Echevin et al., 2014) might modify the measurements. As previously observed in the central and western Pacific, and as predicted from model simulations, the EUC at the Equa- tor almost disappeared, with a transport of only 0.02 Sv be- tween 1◦S and 1◦N in October 2015 related to the El Niño conditions. Although weak, the EUC had shifted southward, with a transport of 0.78 Sv between 2◦300and 1◦S in Octo- ber 2015. These observations are in agreement with the pre- dicted weakening and southward shift of the EUC in model results for El Niño periods (Montes et al., 2011). According to earlier observations, the disappearance of the EUC in the eastern Pacific seems to be related mainly to strong El Niño events. For the very strong 1982/83 El Niño, a disappearance of the EUC was described for the eastern Pacific (Halpern, 1997), whereas for the strong 1997/98 El Niño the EUC dis- appeared over all longitudes (Izumo, 2005). In contrast, dur- ing the moderate El Niños of 1986/87 and 1991/92 a disap- pearance was described in the western and central Pacific, but only a weakening in the eastern Pacific (McPhaden et al.,
1990; McPhaden and Hayes, 1990; Izumo, 2005; Kessler and McPhaden, 1995; Seidel and Giese, 1999).
Four hydrographic sections near the Peruvian shelf be- tween∼9 and∼16◦S had different El Niño related signals in October 2015. At∼9◦S there was a large SST increase, and we observed upwelling of lighter water that was both warmer and more oxygenated, all of which are characteris- tic upwelling features of El Niño events. Between 12 and 16◦S the SST increase in October 2015 was weaker than at 9◦S, and at the easternmost stations near the Peruvian shelf at∼12,∼14 and∼16◦S cold and oxygen-poor water was upwelled as during regular upwelling conditions, probably some leftover water from the pre-El Niño period. West of the easternmost stations, El Niño type changes were also ob- served below the thermocline and oxycline, a feature that weakened southward and that may be related to the shoal- ing and intensification of the PCUC and the influence of a downwelling Kelvin wave.
The 2015 El Niño started strongly early in the year, and by October 2015 had an ONI similar to earlier major El Niño events. The water characteristics at 85◦300W at the Equator and EUC variability and upwelling at∼9◦S also indicated that a strong EP El Niño had developed. However, at 1◦N and 2◦300S at 85◦300W and at the sections near the shelf be- tween 12 and 16◦S, the El Niño influence was still weak. To this end, the weak EUC clearly indicated a strong EP El Niño at the Equator, while off the South American continent the distribution of hydrographic parameters, oxygen, and nutri- ents indicated a transition period from regular to El Niño con- ditions progressing southward along the Peruvian shelf. De- spite the strong 2015 El Niño, the shift to El Niño distribution in the eastern Pacific was surprisingly slow. As the ONI in- creased to the end of 2015, we expect that the El Niño condi- tions were strengthening in the eastern Pacific after the cruise in October 2015. Measurements carried out by CNRS, IRD, and IMARPE with a glider from IFREMER at about 8◦S off Peru between 7 November and 17 December 2015 showed an increase in temperature and oxygen and a decrease in den- sity at∼100 m when compared to October 2015, thus con- firming the expected strengthening of the El Niño conditions (https://www.ird.fr/toutel-actualite/actualites/).
In summary, the temperature, salinity, and oxygen mea- surements all indicate that during October 2015 the El Niño was strongest along our northern transects and weakest along our southern transects. This was also apparent in the nutri- ent properties between the northern and southern portions of our study region. As outlined above, at 12◦S the N : P ratio was higher and nitrite concentrations were lower during Oc- tober 2015 when compared to the non-El Niño period of De- cember 2012, both of which point to a reduction in the mag- nitude of denitrification. When comparing the differences be- tween coastal nutricline N : P ratios and nitrite concentrations along the coast, we found that the differences between Oc- tober 2015 and December 2012 decreased between 12 and 14◦S, and again between 14 and 16◦S (data not shown). This
again highlights the potential for El Niño events to impact N loss processes and upper water column biogeochemistry.
7 Data availability
The data from the R/VKnorr cruise in March/April 1993 are available for ADCP at ftp://ftp.soest.hawaii.edu/caldwell/
adcp/DATABASE/00015.html, for CTD data as https://doi.
pangaea.de/10.1594/PANGAEA.294039, and for nutrients as https://doi.pangaea.de/10.1594/PANGAEA.837024. The assembled measurements of the Meteor cruises in Febru- ary 2009, November 2012, and December 2012 and the Sonnecruise in October 2015 used in this paper are available at https://doi.pangaea.de/10.1594/PANGAEA.861392.
The Supplement related to this article is available online at doi:10.5194/os-12-861-2016-supplement.
Author contributions. Lothar Stramma and Tim Fischer conceived the study, wrote the manuscript, and carried out the ADCP and hy- drographic measurements on the R/VSonnecruise in 2015 as well as on some of the R/VMeteorcruises. Damian S. Grundle was co- chief scientist of the R/VSonnecruise in October 2015, organized the nutrient sampling, and interpreted the nutrient data. Gerd Krah- mann calibrated the R/VMeteorand R/VSonneCTD data and in- terpreted the hydrographic data. Hermann W. Bange was chief sci- entist on R/VMeteorin December 2012, he was responsible for the nutrient measurements on this cruise and interpreted the nutrient data. Christa A. Marandino was chief scientist on the R/VSonne cruise in October 2015 and interpreted the nutrient data. All authors discussed and modified the manuscript.
Acknowledgements. The Deutsche Forschungsgemeinschaft (DFG) provided support as part of Sonderforschungsbereich 754:
Climate-Biogeochemistry Interactions in the Tropical Ocean and for the R/V Meteor cruises. The Bundesministerium für Bildung und Forschung (BMBF) supported this study as part of the SOPRAN project (03F0611A, 03F0662A) and through funding of the R/VSonnecruise in October 2015 (03G0243A). We thank the captains and crews of the R/VMeteorand R/VSonnecruises for their help, R. Czeschel for helpful comments on the graphic software, T. Steinhoff for co-organizing the R/V Sonne cruise, and M. Lohmann and H. Campen for the oxygen and nutrient measurements.
Edited by: M. Hoppema
References
Ashok, K. and Yamagata, T.: The El Niño with a difference, Nature, 461, 481–484, 2009.
Bange, H. W.: Surface Ocean – Lower Atmosphere Study (SOLAS) in the upwelling region off Peru – Meteor Cruise No M91, Me- teor Berichte, Bremerhaven, 69 pp., 2013.
Brockmann, D. and Morgenroth, E.: Evaluating operating condi- tions for out-competing nitrite oxidizers and maintaining par- tial nitrification in biofilm systems using biofilm modeling and Monte Carlo filtering, Water Res., 44, 1995–2009, 2010.
Cai, W., Borlace, S., Lengaigne, M., van Rensch, P., Collins, M., Vecchi, G., Timmermann, A., Santoso, A., McPhaden, M. J., Wu, L., England, M. H., Wang, G., Guilyardi, E., and Jin, F.-F.: In- creasing frequency of extreme El Niño events due to greenhouse warming, Nature Climate Change, 4, 111–116, 2014.
Chaigneau, A., Dominguez, N., Eldin, G., Vasquez, L., Flores, R., Grados, C., and Echevin, V.: Near-coastal circulation in the Northern Humboldt Current system from shipboard ADCP data, J. Geophys. Res., 118, 5251–5266, 2013.
Changnon, S. A.: El Niño 1997–1998: the climate event of the cen- tury, Oxford University Press, New York, ISBN 019-513552-0, 2000.
Chavez, F. P. and Messié, M.: A comparison of eastern boundary upwelling ecosystems, Prog. Oceanogr., 83, 80–96, 2009.
Colas, F., Capet, X., McWilliams, J. C., and Shchepetkin, A.: 1987–
1998 El Niño off Peru: A numerical study, Prog. Oceanogr., 79, 138–155, 2008.
Collins, C., Mascarenhas, A., and Martinez, R.: Structure of ocean circulation between Galapagos Islands and Ecuador, Adv.
Geosci., 33, 3–12, 2013.
Codispoti, L. A. and Christensen, J. P.: Nitrification, denitrification, and nitrous oxide cycling in the eastern tropical South Pacific Ocean, Mar. Chem. 16, 277–300, 1985.
Cravatte, S., Picaut, J., and Eldin, G.: Second and first baroclinic Kelvin modes in the equatorial Pacific at in- traseasonal timescales, J. Geophys. Res., 108, 3266, doi:10.1029/2002JC001511, 2003.
Cravatte, S., Madec, G., Izumo, T., Menkes, C., and Bozec, A.: Progress in the 3-D circulation of the eastern equato- rial Pacific in a climate model, Ocean Model., 17, 28–48, doi:10.1016/j.ocemod.2006.11.003, 2007.
Czeschel, R., Stramma, L., Schwarzkopf, F. U., Giese, B. J., Funk, A., and Karstensen, J.: Middepth circulation of the eastern trop- ical South Pacific and its link to the oxygen minimum zone, J.
Geophys. Res., 116, C01015, doi:10.1029/2010JC006565, 2011.
Czeschel, R., Stramma, L., and Johnson, G. C.: Oxygen decreases and variability in the eastern equatorial Pacific, J. Geophys. Res., 117, C11019, doi:10.1029/2012JC008043, 2012.
Czeschel, R., Stramma, L., Weller, R. A., and Fischer, T.: Circula- tion, eddies, oxygen, and nutrient changes in the eastern tropical South Pacific Ocean, Ocean Sci., 11, 455–470, doi:10.5194/os- 11-455-2015, 2015.
Dewitte, B., Vazquez-Cuervo, J., Goubanova, K., Illig, S., Taka- hashi, K., Cambon, G., Purca, S., Correa, D., Gutierrez, D., Sifeddine, A., and Ortlieb, L.: Change in El Niño flavours over 1958–2008: Implications for the long-term trend of the upwelling off Peru, Deep-Sea Res. Pt. II, 77–80, 143–156, 2012.
Echevin, V., Colas, F., Chaigneau, A., and Penven, P.: Sensitivity of the Northern Humboldt Current System nearshore modelled
circulation to initial boundary conditions, J. Geophys. Res., 116, C07002, doi:10.1029/2010JC006684, 2011.
Echevin, V., Albert, A., Lévy, M., Graco, M., Aumont, O., Piétri, A., and Garric, G.: Intraseasonal variability of nearshore productiv- ity in the Northern Humboldt current system: The role of coastal trapped waves, Cont. Shelf Res., 73, 14–30, 2014.
Enfield, D. B.: Thermally driven wind variability in the planetary boundary layer above Lima, Peru, J. Geophys. Res., 86, 2005–
2016, 1981.
Fennel, W.: Theory of the Benguela upwelling system, J. Phys.
Oceanogr., 29, 177–190, 1999.
Fiedler, P. C. and Talley, L. D.: Hydrography of the eastern tropical Pacific: A review, Prog. Oceanogr., 69, 143–180, 2006.
Firing, E., Lukas, R., Sadler, J., and Wyrtki, K.: Equatorial Un- dercurrent disappears during 1982–1983 El Niño, Science, 222, 1121–1123, 1983.
Fuenzalida, P., Schneider, W., Garces-Vargas, J., Bravo, L., and Lange, C.: Vertical and horizontal extension of the oxygen min- imum zone in the eastern South Pacific Ocean, Deep-Sea Res., Pt. II, 56, 992–1003, 2009.
Graco, M., Purca, S., Dewitte, B., Morón, O., Ledesma, J., Flores, G., Castro, C., and Gutiérrez, D.: The OMZ and nutrients fea- tures as a signature of interannual and low frequency variabil- ity off the peruvian upwelling system, Biogeosciences Discuss., doi:10.5194/bg-2015-567, in review, 2016.
Gruber, N.: The marine nitrogen cycle: overview and challenges, in:
Nitrogen in the Marine Environment, edited by: Capone, D. G., Bronk, D. A., Mulholland, M. R., and Carpenter, E. J., Academic Press, Burlington, MA, 1–50, 2008.
Grundle, D. S., Juniper, S. K., and Giesbrecht, K. E.: Euphotic zone nitrification in the NE subarctic Pacific: Implications for mea- surements of new production, Mar. Chem., 155, 113–123, 2013.
Gutiérrez, D., Enríquez, E., Purca, S., Quipúzcoa, L., Marquina, R., Flores, G., and Graco, M.: Oxygenation episodes on the conti- nental shelf of central Peru: Remote forcing and benthic ecosys- tem response, Prog. Oceanogr., 79, 177–189, 2008.
Gutiérrez, D., Bouloubassi, I., Sifeddine, A., Purca, S., Goubanova, K., Graco, M., Field, D., Méjanelle, L., Velazco, F., Lorre, A., Salvatteci, R., Quispe, D., Vargas, G., Dewitte, B., and Ortlieb, L.: Coastal cooling and increased productivity in the main up- welling zone off Peru since the mid-twentieth century, Geophys.
Res. Lett., 38, L07603, doi:10.1029/2010GL046324, 2011.
Halpern, D.: Observations of annual and El Nino flow variations at 0◦, 110◦W and 0◦, 95◦W during 1980–85, J. Geophys. Res., 92, 8197–8212, 1987.
Halpern, D.: Offshore Ekman transport and Ekman pumping off Peru during the 1997–1998 El Niño, Geophys. Res. Lett., 29, 1075, doi:10.1029/2001GL014097, 2002.
Hansen, H. P.: Determination of oxygen, in: Methods of Seawater analysis, edited by: Grasshoff, K. K. and Ehrhardt, M., Wiley- VCH, Weinheim, Germany, 75–89, 1999.
Hauss, H., Franz, J., and Sommer, U.: Changes in N : P stoichiom- etry influence taxonomic composition and nutritional quality of phytoplankton in the Peruvian upwelling, J. Sea Res., 73, 74–85, 2012.
Hayes, S. P., Mangum, L. J., Barber, R. T., Huyer, A., and Smith, R.
L.: Hydrographic variability west of the Galapagos Islands dur- ing the 1982–83 El Niño, Prog. Oceanogr., 17, 137–162, 1986.
Helly, J. J. and Levin, L. A.: Global distribution of naturally occur- ring marine hypoxia on continental margins, Deep-Sea Res. Pt.
I, 51, 1159–1168, 2004.
Huyer, A., Smith, R. L., and Paluszkiewicz, T.: Coastal upwelling off Peru during normal and El Niño times, 1981–1984, J. Geo- phys. Res., 92, 14297–14307, 1987.
Izumo, T.: The equatorial undercurrent, meridional overturning cir- culation, and their roles in mass and heat exchanges during El Nino events in the tropical Pacific ocean, Ocean Dynam., 55, 110–123, 2005.
Johnson, G. C., McPhaden, M. J., Rowe, G. D., and McTaggert, K.
E.: Upper equatorial Pacific Ocean current and salinity variability during the 1996–1998 El Niño-La Niña cycle, J. Geophys. Res., 105, 1037–1053, 2000.
Johnson, G. C., Sloyan, B. M., Kessler, W. S., and McTaggert, K.
E.: Direct measurements of upper ocean currents and water mass properties across the tropical Pacific during the 1990s, Prog.
Oceanogr., 52, 31–61, 2002.
Kalvelage, T., Lavik, G., Lam, P., Contreras, S., Arteaga, L., Löscher, C. R., Oschlies, A., Paulmier, A., Stramma, L., and Kuypers, M. M. M.: Nitrogen cycling driven by organic matter export in the South Pacific oxygen minimum zone, Nat. Geosci., 6, 228–234, doi:10.1038/NGEO1739, 2013.
Karnauskas, K. B., Murtugudde, R., and Busalacchi, J.: Observing the Galapagos-EUC interaction: Insights and challenges, J. Phys.
Oceanogr., 40, 2768–2777, 2010.
Karstensen, J., Stramma, L., and Visbeck, M.: Oxygen minimum zones in the eastern tropical Atlantic and Pacific oceans, Prog.
Oceanogr., 77, 331–350, 2008.
Kessler, W. S.: The circulation of the eastern tropical Pacific: A re- view, Prog. Oceanogr., 69, 181–217, 2006.
Kessler, W. S. and McPhaden, M. J.: The 1991–1993 El Niño in the central Pacific, Deep-Sea Res. Pt. II, 42, 295–333, 1995.
Kintisch, E.: “The Blob” invades Pacific, flummoxing climate ex- perts, Science, 348, 17–18, 2015.
Kock, A., Arévalo-Martínez, D. L., Löscher, C., and Bange, H. W.:
Extreme N2O accumulation in the coastal oxygen minimum zone off Peru, Biogeosciences, 13, 827–840, doi:10.5194/bg-13-827- 2016, 2016.
Lomas, M. W. and Lipschultz, F.: Forming the primary nitrite maximum: Nitrifiers or phytoplankton?, Limnol. Oceanogr., 51, 2453–2467, 2006.
McPhaden, M. J. and Hayes; S. P.: Variability in the eastern equa- torial Pacific during 1986–1988, J. Geophys. Res., 95, 13195–
13208, 1990.
McPhaden, M. J., Hayes, S. P., Mangum, L. J., and Toole, J. M.:
Variability in the western equatorial Pacific during the 1986–87 El Nino-Southern Oscillation event, J. Phys. Oceanogr., 20, 190–
208, 1990.
McPhaden, M. J., Zebiak, S. E., and Glantz, M. H.: ENSO as an Integrating Concept in Earth Science, Science, 314, 1740–1745, 2006.
Montes, I., Schneider, W., Colas, F., Blanke, B., and Echevin, V.:
Subsurface connections in the eastern tropical Pacific during La Niña 1999–2001 and El Niño 2002–2003, J. Geophys. Res., 116, C12022, doi:10.1029/2011JC007624, 2011.
Paulmier, A. and Ruiz-Pino, D.: Oxygen minimum zones (OMZs) in the modern ocean, Prog. Oceanogr., 80, 113–128, 2009.
Pennington, J. T., Mahoney, K. L. Kuwahara, V. S., Kolber, D. D., Calienes, R., and Chavez, F. P.: Primary production in the eastern tropical Pacific: A review, Prog. Oceanogr., 69, 285–317, 2006.
Rousseaux, C. S. and Gregg, W. W.: Climate variability and phy- toplankton composition in the Pacific Ocean, J. Geophys. Res., 117, C10006, doi:10.1029/2012JC008083, 2012.
Schmidtko, S., Johnson, G. C., and Lyman, J. M.: MI- MOC: A global monthly isopycnal upper-ocean climatol- ogy with mixed layers, J. Geophys. Res., 118, 1658–1672, doi:10.1002/jgrc.20122, 2013.
Seidel, H. F. and Giese, B. S.: Equatorial currents in the Pacific Ocean 1992–1997, J. Geophys. Res., 104, 7849–7863, 1999.
Stramma, L., Johnson, G. C., Sprintall, J., and Mohrholz, V.: Ex- panding oxygen-minimum zones in the tropical oceans, Science, 320, 655–658, 2008.
Stramma, L., Bange, H. W., Czeschel, R., Lorenzo, A., and Frank, M.: On the role of mesoscale eddies for the biological productiv- ity and biogeochemistry in the eastern tropical Pacific Ocean off Peru, Biogeosciences, 10, 7293–7306, doi:10.5194/bg-10-7293- 2013, 2013.
Strub, P. T., Mesías, J. M., Montecino, V., Rutllant, J., and Salinas, S.: Coastal ocean circulation off western South America coastal segment (6,e), The Sea, edited by: Robinson A. R. and Brink, K.
H., 11 273–313, ISBN 0-471-11545-2, 1998.
Tsuchiya, M. and Talley, L. D.: A Pacific hydrographic section at 88◦W: Water property distribution, J. Geophys. Res., 103, 12899–12918, 1998.
Ulloa, O., Escribano, R., Hormazabal, S., Quiñones, R. A., González, R. R., and Ramos, M.: Evolution and biological effects of the 1997–98 El Niño in the upwelling ecosystem off northern Chile, Geophys. Res. Lett., 28, 1591–1594, 2001.
Vergara, O., Dewitte, B., Montes, I., Garçon, V., Ramos, M., Paul- mier, A., and Pizarro, O.: Seasonal Variability of the Oxygen Minimum Zone off Peru in a high-resolution regional coupled model, Biogeosciences Discuss., doi:10.5194/bg-2015-631, in review, 2016.
Wang, C. and Fiedler, P. C.: ENSO variability in the eastern tropical Pacific: A review, Prog. Oceanogr., 69, 239–266, 2006.
Ward, B. B.: Nitrification in marine systems, in: Nitrogen in the Marine Environment, edited by: Capone, D. G., Bronk, D. A., Mulholland, M. R., and Carpenter, E. J., 2nd Edn., Elsevier, Am- sterdam, 199–261, 2008.
Winkler, L. W.: Bestimmung des im Wasser gelösten Sauerstoffs, Ber. Dtsch. Chem. Ges., 21, 2843–2855, 1888.