Supplement of Ocean Sci., 12, 861–873, 2016 http://www.ocean-sci.net/12/861/2016/
doi:10.5194/os-12-861-2016-supplement
© Author(s) 2016. CC Attribution 3.0 License.
Supplement of
Observed El Niño conditions in the eastern tropical Pacific in October 2015
Lothar Stramma et al.
Correspondence to:Lothar Stramma (lstramma@geomar.de)
The copyright of individual parts of the supplement might differ from the CC-BY 3.0 licence.
2 3 4
5 6
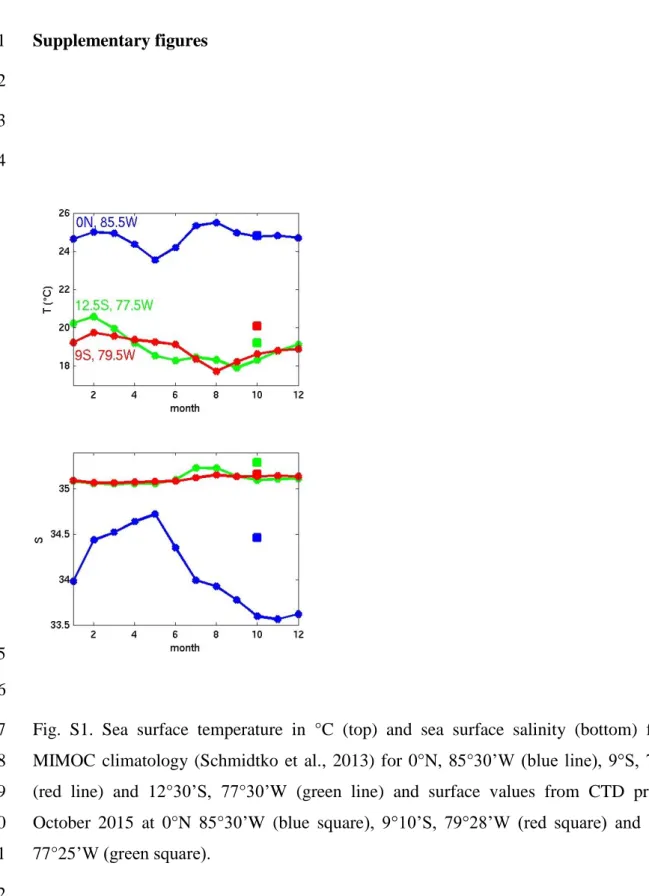
Fig. S1. Sea surface temperature in °C (top) and sea surface salinity (bottom) from the 7
MIMOC climatology (Schmidtko et al., 2013) for 0°N, 85°30’W (blue line), 9°S, 79°30’W 8
(red line) and 12°30’S, 77°30’W (green line) and surface values from CTD profiles in 9
October 2015 at 0°N 85°30’W (blue square), 9°10’S, 79°28’W (red square) and 12°21’S, 10
77°25’W (green square).
11 12
1
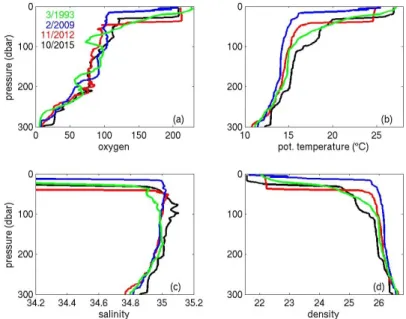
Fig. S2. Upper 300 m profiles at 1°N, 85°50’W for 31 March 1993 (green), 13 February 2009 2
(blue), 2 November 2012 (red) and at 85°30’W for 7 October 2015 (black) for (a) oxygen in 3
mol kg-1, (b) potential temperature in °C, (c) salinity and (d) potential density in kg m-3. 4
5
2
3
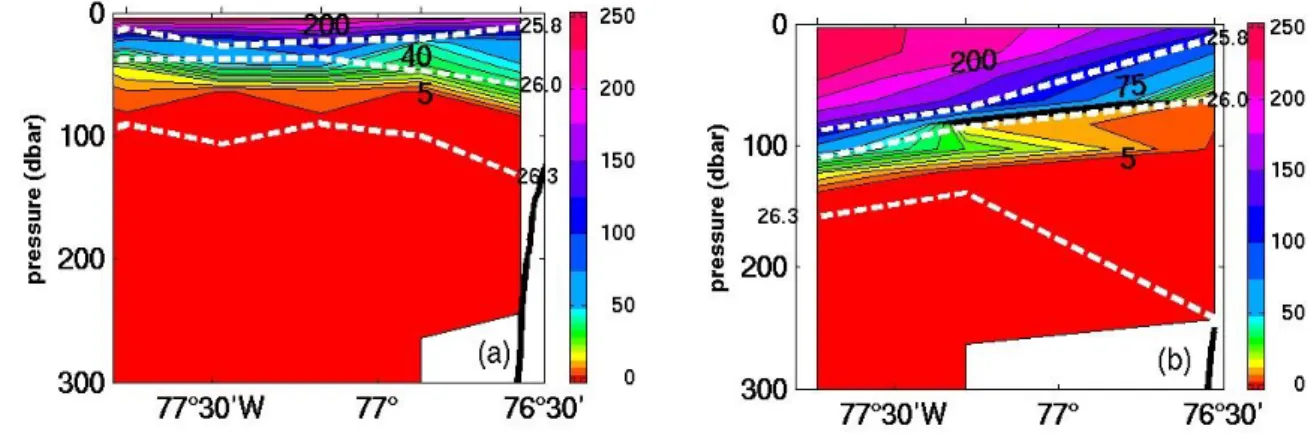
Fig. S4. Temperature section (color; in C; same color-scale on both frames) at ~9°S off the 4
Peruvian shelf for December 2012 (a) and October 2015 (b). Three selected isopycnals are 5
included as white dashed lines.
6 7 8
9
Fig. S5. Salinity section (color; same color-scale on both frames) at ~9°S off the Peruvian 10
shelf for December 2012 (a) and October 2015 (b). Three selected isopycnals are included as 11
white dashed lines.
12 13
1
Fig. S6. Oxygen section (color; in mol kg-1; same color-scale on both frames) at ~14°S off 2
the Peruvian shelf for December 2012 (a) and October 2015 (b). Three selected isopycnals are 3
included as white dashed lines.
4 5
6
Fig. S7. Oxygen section (color; in mol kg-1; same color-scale on both frames) at ~16°S off 7
the Peruvian shelf for December 2012 (a) and October 2015 (b). Three selected isopycnals are 8
included as white dashed lines.
9 10
11