Research Collection
Journal Article
Vegetation cover and plant-trait effects on outdoor thermal comfort in a tropical city
Author(s):
Meili, Naika; Acero, Juan Angel; Peleg, Nadav; Manoli, Gabriele; Burlando, Paolo; Fatichi, Simone Publication Date:
2021-05-15 Permanent Link:
https://doi.org/10.3929/ethz-b-000473566
Originally published in:
Building and Environment 195, http://doi.org/10.1016/j.buildenv.2021.107733
Rights / License:
Creative Commons Attribution 4.0 International
This page was generated automatically upon download from the ETH Zurich Research Collection. For more information please consult the Terms of use.
ETH Library
Building and Environment 195 (2021) 107733
Available online 22 February 2021
0360-1323/© 2021 The Authors. Published by Elsevier Ltd. This is an open access article under the CC BY license (http://creativecommons.org/licenses/by/4.0/).
Contents lists available atScienceDirect
Building and Environment
journal homepage:www.elsevier.com/locate/buildenv
Vegetation cover and plant-trait effects on outdoor thermal comfort in a tropical city
Naika Meili
a,b,∗, Juan Angel Acero
a,c, Nadav Peleg
b, Gabriele Manoli
d, Paolo Burlando
b, Simone Fatichi
eaFuture Cities Laboratory, Singapore-ETH Centre, 1 Create Way, 138602, Singapore
bInstitute of Environmental Engineering, ETH Zurich, Stefano Franscini-Platz 5, 8093 Zürich, Switzerland
cCENSAM, Singapore-MIT Alliance for Research and Technology, 1 Create Way, 138602, Singapore
dDepartment of Civil, Environmental and Geomatic Engineering, University College London, London WC1E 6BT, United Kingdom
eDepartment of Civil and Environmental Engineering, National University of Singapore, 1 Engineering Drive 2, 117576, Singapore
A R T I C L E I N F O
Keywords:
Outdoor thermal comfort UTCI
Urban vegetation Ecosystem services Heat mitigation in the tropics Urban ecohydrological model
A B S T R A C T
An increase in urban vegetation is an often proposed mitigation strategy to reduce urban heat and improve outdoor thermal comfort (OTC). Vegetation can alter urban microclimate through changes in air temperature, mean radiant temperature, humidity, and wind speed. In this study, we model how street tree and ground vegetation cover and their structural, optical, interception, and physiological traits control the diurnal cycle of OTC in different urban densities in a tropical city (Singapore). For this purpose, we perform a variance based sensitivity analysis of the urban ecohydrological model UT&C. Model performance is evaluated through a comparison with local microclimate measurements and OTC is assessed with the Universal Thermal Climate Index (UTCI).
We find a pronounced daily cycle of vegetation effects on UTCI. Tree cover fraction is more efficient in decreasing UTCI during daytime, while a higher vegetated ground fraction provides more cooling during night. Generally, increasing vegetation cover fractions do not deter OTC, except in certain urban densities during some periods of the day. An increase in tree and ground vegetation fractions provides a higher average UTCI reduction compared to a change in vegetation traits (0.9 – 2.9 ◦C vs. 0.7 – 1.1 ◦C during midday, 10 month average). The increase in humidity related to plant transpiration prevents further reduction of UTCI.
However, the choice of vegetation traits enhancing tree transpiration can decrease UTCI during hot periods.
These results can inform urban planners on the selection of vegetation amount and traits to achieve feasible OTC improvements in tropical cities.
1. Introduction
The number of people living in urban areas is increasing globally, and especially cities in Asia and Africa are foreseen to grow rapidly in the coming years [1]. Increasing urbanization, combined with the projected rise in global temperature due to climate change [2], is likely to further elevate temperatures in cities [2–5] with potential adverse effects on the outdoor thermal comfort (OTC) of their inhabitants [2, 6,7]. To reduce urban heat stress and improve OTC of city dwellers, increasing urban vegetation cover is an often proposed mitigation strategy [8–11]. Urban vegetation influences the urban climate during daytime as well as nighttime [10], during average climatic conditions as well as during heat waves [12], and requires planting, continuous
∗ Corresponding author at: Future Cities Laboratory, Singapore-ETH Centre, 1 Create Way, 138602, Singapore.
E-mail addresses: meili@ifu.baug.ethz.ch(N. Meili),juanangel@smart.mit.edu(J.A. Acero),nadav.peleg@sccer-soe.ethz.ch(N. Peleg),g.manoli@ucl.ac.uk (G. Manoli),paolo.burlando@ifu.baug.ethz.ch(P. Burlando),ceesimo@nus.edu.sg(S. Fatichi).
maintenance, and possibly irrigation — all factors that have associated costs [13].
In several cases, such as in tropical hot humid cities, the effects of vegetation on OTC are not straightforward to predict. OTC is influ- enced by climatic variables, such as air temperature, relative humidity, mean radiant temperature, and wind speed [14–17], as well as hu- man behaviour, clothing, acclimatisation, activity levels, and personal perception [18–21]. While vegetation can decrease air temperature and reduce mean radiant temperature through shade provision during certain hours of the day, benefiting OTC in hot cities [22,23], plants transpire and increase humidity which might deter OTC in humid climates [22]. Furthermore, vegetation can shelter and block wind
https://doi.org/10.1016/j.buildenv.2021.107733
Received 21 September 2020; Received in revised form 14 February 2021; Accepted 16 February 2021
flow, which could further reduce OTC in warm and calm-windless locations [22].
In tropical cities, which are characterized by high temperatures year-round, low diurnal temperature range, as well as high night time humidity [24], this trade-off of temperature decrease and humidity increase needs to be properly analysed to evaluate the overall benefits of urban vegetation. OTC should be quantified throughout the diurnal cycle as well as under different climatic conditions with a compre- hensive thermal comfort index [25], which is sensitive to humidity changes, such as the Universal Thermal Climate Index (UTCI) [15] or the Modified Physiologically Equivalent Temperature (mPET) [26].
Not only vegetation amount and type, such as grass or trees, can influence the effects of urban vegetation on OTC, but also vegetation structural, optical, interception, and physiological traits [10,27]. Plant- traits identifies morphological, anatomical, biochemical, physiological and phenological features of plant individuals [28] and are influenced by the choice of vegetation species. In land surface models, plant traits are defined through a set of parameters [27,29,30], which can influence simulation outputs [31]. A systematic sensitivity analysis can quantify the expected effects of certain vegetation traits, such as vegetation structure, interception capacity, albedo, and physiology on the OTC, for varying combinations of vegetation types and amount. Hence, nu- merical models offer the opportunity to identify vegetation amount and traits that provide the highest possible enhancement of OTC. Such knowledge is fundamental to guide and inform urban planners and landscape designers on the selection of plant species and vegetation cover, as well as set expectations within the limits of attainable OTC improvements.
Furthermore, a systematic sensitivity analyses can identify impor- tant model parameters [31], which need to be specified carefully, due to their impact on model outputs. While information on urban form and composition is readily available nowadays for many cities [32,33], it can be hard to determine the accurate values of vegetation parameters for a given urban environment, as they depend on plant species, age, and environmental and management conditions. Hence, knowledge on parameter sensitivity can be beneficial to concentrate efforts in model parameter estimation.
The urban ecohydrological model, Urban Tethys-Chloris (UT&C) [27], is currently one of the few models that is able to assess the impacts of vegetation physiology on urban climate [27,29]. UT&C includes a large set of parameters, specifying vegetation amount, structure, optical properties, canopy interception, and plant physiology. Using UT&C to simulate OTC in different urban densities, this study aims to answer the following questions: (i) which vegetation properties are the most influential in modifying OTC in humid tropical climates? (ii) Are there substantial differences in the effects of vegetation types and properties across hours of the day or during the hottest periods of the year? The city of Singapore is used as an exemplary case-study; model performance is assessed in five different locations with varying urban density and green cover.
2. Methods
2.1. Urban Tethys-Chloris (UT&C) and outdoor thermal comfort The urban ecohydrological model UT&C is based on a combination of an urban canyon scheme and an ecohydrological model [27]. The average urban form at the neighbourhood scale is defined with the area averaged building height (𝐻𝑐𝑎𝑛), canyon width (𝑊𝑐𝑎𝑛), and roof width (𝑊𝑟𝑜𝑜𝑓) (see Fig. 1). The building height variability, used in the formulation of the urban aerodynamic roughness and displacement height [34,35], is defined by the maximum building height (𝐻𝑐𝑎𝑛,𝑚𝑎𝑥) and building height variability (𝐻𝑐𝑎𝑛,𝑠𝑡𝑑). UT&C includes street tree (𝜆𝑇 𝑟𝑒𝑒) and ground vegetation (𝜆𝐺,𝑣𝑒𝑔) plan area fractions within the canyon (Fig. 1), and their structural, optical, interception, and phys- iological properties (Table 1). UT&C accounts for the interaction of
urban vegetation with radiation, such as for example shade provision by trees [36] or modification of urban albedo. It calculates transpi- ration based on environmental conditions and plant photosynthetic activity [27,36], which is an important factor to determine the evap- otranspirative responses and impacts of urban vegetation on relative humidity and, therefore, OTC. UT&C further includes the interception of precipitation on plant canopies and the infiltration of water into the soil column underneath vegetation. The model calculates wind speed at any height z,𝑊 𝑠(𝑧), combining a logarithmic and exponential wind profile above and within the urban canyon [37,38], which accounts for average urban geometry and tree cover [34,35]. Through these processes, influenced by the properties of vegetation, the effects of different vegetation types and traits on the urban micro climate and hydrology can be modelled, as well as the feedback of the urban environment on plant performance [36].
UT&C calculates the 2𝑚air temperature𝑇2𝑚, 2𝑚humidity𝑅𝐻2𝑚, and the urban and vegetation surface temperatures as a solution of the urban energy and water budget [27]:
𝑅𝑛+𝑄𝑓=𝐻+𝜆𝐸+𝐺 (1)
𝑃+𝐼 𝑟=𝑅+𝐸+𝐿𝑘+𝛥𝑆 (2)
where𝑅𝑛 is the net short- and longwave radiation [W m−2], 𝑄𝑓 the anthropogenic heat flux [W m−2],𝐻 the sensible heat flux [W m−2], 𝜆𝐸the latent heat flux [W m−2], which is calculated as the product of evapotranspiration𝐸[kg m−2 s−1] and the latent heat of vaporization 𝜆[J kg−1], 𝐺the conductive heat flux including heat storage effects [W m−2],𝑃 the precipitation [kg m−2s−1],𝐼 𝑟the water input through irrigation [kg m−2s−1],𝑅the surface runoff [kg m−2s−1],𝐿𝑘the deep leakage at the bottom of the soil column [kg m−2 s−1], and 𝛥𝑆 the change in water storage [kg m−2s−1]. The detailed description of the UT&C model process formulation and𝑇2𝑚,𝑅𝐻2𝑚, and𝑊 𝑠calculation can be found in [27] and its accompanying technical reference material.
The calculation of mean radiant temperature𝑇𝑚𝑟𝑡is introduced in this article and described in the Supplementary Information A.
UT&C assesses OTC using UTCI [15], which is calculated using the polynomial regression described in [14,39], as a function of the simulated𝑇2𝑚,𝑅𝐻2𝑚,𝑇𝑚𝑟𝑡and𝑊 𝑠10𝑚[14]. UTCI is one of the four OTC indices identified as suitable for human biometeorological assessment by [25] as it provides an equivalent air temperature and is based on the energy budget model of a human body.
2.2. Case study: Singapore
The city of Singapore is chosen as a case study in this work due to its representative tropical climate (Köppen classification: Af) with high air temperatures, high relative humidity, and abundant rain- fall year round [40]. Additionally, Singapore has a wealth of past studies analysing and modelling its urban climate, heat island, and OTC [e.g.,5,22,41], which leads to the availability of high-quality data, such as a high resolution land cover and building height map [33], and energy flux measurements of an eddy-covariance tower [40,42]. Us- ing these eddy-covariance measurements, UT&C’s model performance at the neighbourhood scale was previously evaluated in Singapore through the comparison of simulated and measured energy fluxes of net radiation, sensible heat, and latent heat, which showed good model performance in the tropical context [27]. In this study, UT&C’s per- formance is further assessed against microclimate variables influencing OTC in Singapore.
2.2.1. Meteorological and microclimate measurements
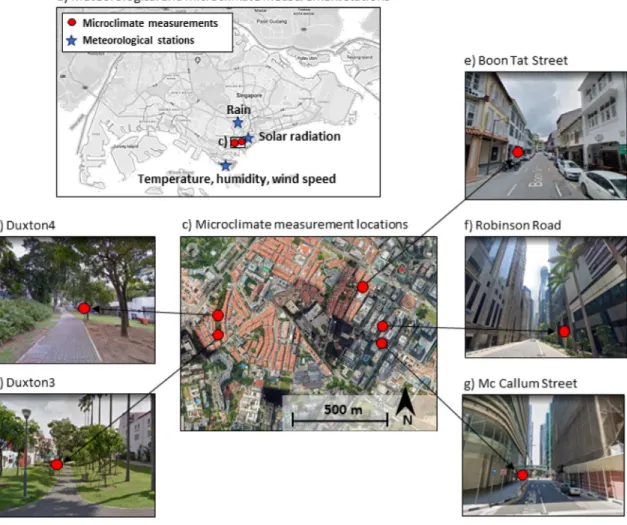
Near pedestrian level microclimate variables (𝑇2𝑚, 𝑅𝐻2𝑚, 𝑊 𝑠2𝑚, 𝑇𝑚𝑟𝑡) were measured at five locations with varying urban density and vegetation cover in the city centre of Singapore (Fig. 2). The measure- ment campaign included three sites in dense low to mid-rise urban settings: (1) Boon Tat St. without vegetation cover, (2) Duxton3 with a
Fig. 1. Specification of urban geometry, vegetation cover, and structure in UT&C based on an infinite urban canyon parameterization.𝑊𝑐𝑎𝑛refers to the average canyon width, 𝑊𝑟𝑜𝑜𝑓to the average roof width,𝐻𝑐𝑎𝑛to the average canyon height, and𝐻𝑐𝑎𝑛,𝑚𝑎𝑥to the maximum building height observed in the neighbourhood. Vegetation fractions are specified by𝜆𝑇 𝑟𝑒𝑒 and𝜆𝐺,𝑣𝑒𝑔, which are the plan area fraction of tree and vegetated ground cover within the canyon, respectively.𝐻𝑇 refers to the tree height,𝑅𝑡𝑟𝑒𝑒to the tree radius, which is one fourth of𝜆𝑇 𝑟𝑒𝑒.𝜆𝐺,𝑖𝑚𝑝refers to the impervious ground fraction within the canyon.
Fig. 2. Measurement locations of the data used as meteorological forcing to the model (temperature, humidity, wind speed, solar radiation, and rain) and locally observed microclimate variables (𝑇2𝑚,𝑅𝐻2𝑚,𝑊 𝑠2𝑚, and𝑇𝑚𝑟𝑡). (a) Overview of measurement locations in Singapore, (c) Overview of the microclimate measurement locations in (b) Duxton4, (d) Duxton3, (e) Boon Tat Street, (f) Robinson Road, and (g) Mc Callum Street. Red points indicate the lamp posts on which the measurement equipment was mounted on. Pictures are from Google maps [43].
high fraction of grass covering the ground, young tree cover, as well as tall palm trees, and (3) Duxton4 with a high ground vegetation fraction as well as mature tree canopies covering the measurement site. Furthermore, two of the microclimate stations were set-up in perpendicular dense high-rise urban canyons: Robinson Rd. (north-east
orientation) with little vegetation cover and Mc Callum St. (north-west orientation) without vegetation in the Central Business District (CBD) of Singapore. The extraction of the landcover fractions, urban form, and vegetation physical properties surrounding the measurement locations is described in Section2.2.2.
Measurement duration was approximately four months (4th of July 2019 – 11th of November 2019) for Duxton3 and Duxton4, five months (15th of November 2019 – 18th of April 2020) for Boon Tat St., six months (25th of October 2019 – 18th of April 2020) for Robinson Rd., and only two months for Mc Callum St. (15th of November 2019 – 13th of January 2020) due to damage of the instruments. Note, that the measurement periods differ for the locations in Duxton versus CBD, so that concurrent differences cannot be computed.
Two devices were used to measure the required climate vari- ables: (1) The passively ventilated Weather Transmitter (WXT520) from Vaisala measured wind speed, air temperature and relative humidity, (2) a black globe radiant temperature sensor (150 mm diameter) from Scientific Campbell measured globe temperature, from which𝑇𝑚𝑟𝑡was derived. The sensors were mounted on a metallic arm extending up to 1.2 m laterally from a lamppost to avoid any wind obstructions from the post. The sensors in Duxton3 and Duxton4 were mounted at a height of 2.2 m while in the other locations the sensors were mounted at a height of 2.4 m due to requirements aiming to avoid interference with pedestrians and vehicles. 1-min records were stored in a datalogger (Scientific Campbell CR300). From these, 1-h mean climatic values were calculated and used for the model performance assessment.
UT&C requires incoming short (𝑆↓) and longwave (𝐿↓) radiation, precipitation (𝑃 𝑟), air temperature (𝑇𝑎𝑡𝑚), humidity (𝑅𝐻𝑎𝑡𝑚), and wind speed (𝑊 𝑠) at forcing height (typically above the city canyon) as mete- orological input to the model specifying the local weather conditions.
The meteorological forcing data (𝑇𝑎𝑡𝑚, 𝑅𝐻𝑎𝑡𝑚, 𝑊 𝑠, 𝑃 𝑟), is obtained from the meteorological network of the National Environment Agency (NEA) of Singapore. Station selection is based on proximity to the microclimate measurement locations and continuous data availability.
Measurement height of𝑇𝑎𝑡𝑚,𝑅𝐻𝑎𝑡𝑚, and𝑊 𝑠is at 37 m. The incoming direct and diffuse solar radiation data was acquired from the Solar Energy Research Institute of Singapore (SERIS). Incoming longwave radiation was calculated using a weather generator [44]. The location of the meteorological and radiation stations in relation to the micro climate measurement location is displayed inFig. 2and the time series of the meteorological forcing data (𝑆↓,𝐿↓,𝑇𝑎𝑡𝑚,𝑅𝐻𝑎𝑡𝑚,𝑊 𝑠,𝑃 𝑟) is displayed in Fig. B.1. The whole data time series to force the model spans from 1st of July 2019 to 1st of May 2020 at hourly resolution.
2.2.2. Model set-up: Urban geometry
UT&C requires specification of parameters describing urban and vegetation geometry and properties. The average urban form and com- position, such as𝐻𝑐𝑎𝑛,𝐻𝑇,𝜆𝑇 𝑟𝑒𝑒,𝜆𝐺,𝑣𝑒𝑔,𝜆𝐺,𝑖𝑚𝑝, and plan area fraction of buildings surrounding each measurement location was extracted from a landcover, building and tree height map [33] within a radius of 150 m.
𝑊𝑟𝑜𝑜𝑓,𝑊𝑐𝑎𝑛, and𝑅𝑡𝑟𝑒𝑒were calculated based on the landcover plan area fractions and under the assumption that the total tree cover is present within the urban canyon.
The 5 measurement locations are within and around Singapore’s CBD, which is highly heterogenous with patches of low and high-rise urban areas next to each other. The presence of high-rise buildings next to low-rise areas can affect the heat and water vapour convec- tion efficiency through the interaction with the wind flow above the buildings and the enhancement of turbulence (Fig. B.3). While a radius of 150 m from the measurement points provided a fairly homogeneous urban form as required by UT&C’s radiation parameterization, a radius of 300 m was chosen to extract the 𝐻𝑐𝑎𝑛,𝑠𝑡𝑑 and 𝐻𝑐𝑎𝑛,𝑚𝑎𝑥 for the calculation of urban roughness and displacement height [35] to account for the influence of the observed urban heterogeneity on the turbulent energy exchange. In homogeneous urban areas such a variation of the extraction radii would not be necessary, as roughness properties would also be homogenous [e.g.27].
The high vegetation and tree cover amount at measurement loca- tions Duxton3 and Duxton4 is not representative of this neighbourhood but unique to a backlane rebuilt as a park within an urban canyon.
Hence, the ground vegetation and tree fractions calculated within a 150
m radius from locations Duxton3 and Duxton4 is considerably lower than the vegetation cover directly surrounding the sensor. Especially 𝑇𝑚𝑟𝑡and𝑊 𝑠2𝑚can be heavily influenced by the presence or absence of trees in the direct proximity, as trees cast shade as well as alter the wind flow. To analyse this effect, model simulations were also performed with the average vegetation cover amount directly surrounding the sensors within a radius of 15 m.
Furthermore, the measurement location in Boon Tat Street is located in close proximity to high-rise buildings, which can cast shade onto Boon Tat Street. Hence, the shade at street level, used in the computa- tion of𝑇𝑚𝑟𝑡in Boon Tat Street, is calculated using the radiation terrain algorithm of T&C [30,45] and a digital surface model of the area [33].
The extracted urban form and vegetation cover for each of the five measurement locations used in the model performance assessment are summarized in Table B.1. Anthropogenic heat input was based on literature [46] and depends on urban density and use. Furthermore, the parameters specifying urban and vegetation properties were assigned based on literature and expert knowledge. These values are summarized in Table 1 (specified as ‘‘Default value SG’’ in which SG denotes
‘‘Singapore’’) and Table B.3.
2.2.3. Model performance assessment
Model simulations were compared against microclimate measure- ments of𝑇2𝑚 [◦C],𝑅𝐻2𝑚 [%],𝑊 𝑠2𝑚 [m s−1], and 𝑇𝑚𝑟𝑡 [◦C], as well as their aggregation into the OTC index UTCI [14,15], to assess model performance. Note, that wind speed was measured at 2.2 and 2.4 m (in different locations) height, but UTCI requires a wind speed input at a height of 10 m. Hence, measured wind speed was back-computed to 10 m height using the wind profile calculated in UT&C, which applies a logarithmic wind profile above the urban canyon and an exponential wind profile within the urban canyon [27].
Model performance assessment is based on the coefficient of deter- mination (𝑅2), total, systematic, and unsystematic root mean square error (𝑅𝑀 𝑆𝐸, 𝑅𝑀 𝑆𝐸𝑠𝑦𝑠,𝑅𝑀 𝑆𝐸𝑢𝑛𝑠𝑦𝑠), mean bias error (𝑀 𝐵𝐸), and mean absolute error (𝑀 𝐴𝐸) [47], which were calculated including the full measurement time period at hourly time steps. Furthermore, the simulated and measured average diurnal cycles of the microclimate variables and UTCI were compared.
2.3. Sensitivity analysis
UT&C includes a large set of parameters, that specify vegetation amount, structure, optical properties, canopy interception, and plant physiology. All these parameters influence the model output, but accu- rate parameter values can be difficult to estimate due to limited data as well as naturally occurring variability and heterogeneity within the urban environment and within vegetation. We perform a sensitivity analysis of UT&C’s vegetation parameters that can (a) quantify the uncertainty in model output due to uncertainty in vegetation input parameters (Section2.3.2), hence, (b) pin-point important parameters, which need to be assigned carefully (Section2.3.3and Section2.3.4), and (c) quantify the overall expected effect of a change in urban vegetation cover on UTCI in Singapore (Section 2.4). The variance based sensitivity analysis is performed in four different urban densities as specified in Section2.3.1.
The model structure of UT&C is complex with non-linear interac- tions between parameters. Hence, the model is treated as a black-box in the performed sensitivity analysis without any assumption on parame- ter interactions. The sensitivity analysis is focused on OTC represented with UTCI and its contributing meteorological variables (𝑇2𝑚,𝑅𝐻2𝑚, 𝑊 𝑠10𝑚, and𝑇𝑚𝑟𝑡).
2.3.1. Specification of urban form for the variance based sensitivity analysis The vegetation parameter sensitivity analysis is performed in four urban densities, which are defined according to representative values of local climate zones LCZ 2 (compact midrise), LCZ 3 (compact lowrise), LCZ 5 (open midrise), and LCZ 6 (open lowrise) as defined by [48].
The canyon aspect ratio𝐻𝑐𝑎𝑛∕𝑊𝑐𝑎𝑛is equal to the average aspect ratio defined by [48] for each analysed LCZ,𝐻𝑐𝑎𝑛 is equal to the average height of roughness elements,𝐻𝑐𝑎𝑛,𝑚𝑎𝑥is equal to the maximum height of roughness elements, and𝐻𝑐𝑎𝑛,𝑠𝑡𝑑is assumed to be 1/4 of the range of height of roughness elements for each analysed LCZ as specified by [48].𝑊𝑐𝑎𝑛was calculated based on the ratio of𝐻𝑐𝑎𝑛∕𝑊𝑐𝑎𝑛.𝑊𝑟𝑜𝑜𝑓was calculated based on the average building plan area fraction specified by [48] and 𝑊𝑐𝑎𝑛. The vegetation fraction is allowed to vary in the analysed LCZs as it is the focus of this study. A priori, the vegetation parameter effects on UTCI are expected to be different between urban densities, for example, due to varying sunlight availability for plant photosynthesis or convection efficiency. The urban geometry of the four analysed urban densities (LCZ2, LCZ3, LCZ5, and LCZ6) is defined in Table B.2. Note, that the four analysed LCZ scenarios in the sensitivity analysis do not correspond to the exact urban density and land cover around the micro climate measurement stations used for model per- formance assessment but are four hypothetical scenarios. UT&C also includes a range of parameters that specify material properties. These parameters are assigned to standard values as summarized in Table B.3.
2.3.2. Parameter selection and range
A total of 25 vegetation parameters were selected for the sensitivity analysis (Table 1). These parameters can be grouped in five broad categories that specify: (1) vegetation amount, (2) physical structure, (3) optical properties, (4) rainfall interception, and (5) physiology of trees and ground vegetation.
For sake of generality, the parameter range (Table 1) is determined according to parameter values representing global observations, as plant properties vary widely also within the same climate and non- native species are common in Singapore’s urban greenery [49–52].
Such a global parameter range quantifies the maximum expected effect of vegetation on UTCI. Model parameters are considered independent random variables and their occurrence over the parameter spaces is defined by either a uniform or a symmetric Beta distribution. The parameters of the Beta distribution were selected such that±3 standard deviations cover the full parameter space. A Beta distribution is chosen for parameters where extreme values are representative of rare plant species and are less likely to occur. This reduces the overestimation of model sensitivity and uncertainty caused by unrealistic parameter combinations.
Model simulations for the subsequent analyses (Sections 2.3.3to 2.5) were performed over a time period of 10 months (July 2019 to May 2020) using the forcing data described in Section2.2.1and shown in Fig. B.1. Vegetation is assumed to be fully irrigated through drip irrigation to exclude any effect of water stress in the analysis. While water stress could be important when analysing vegetation effects on urban climate, it represents an unusual condition for Singapore’s climate and is not the focus of this study.
It is important to note that in this study the mean radiant tempera- ture is calculated at a point 1 m from the tree trunk at a height of 2 m if the tree height and crown area permit. In the case of shorter trees, the point is placed 0.5 m from the tree crown at 2 m height. Such a placement assumes that people would walk underneath tree cover if possible and hence, the average𝑇𝑚𝑟𝑡exposure, includes both sun and shade, depending on the time of the day and year.
2.3.3. Parameter screening: Elementary effects
A full variance based sensitivity analysis with many parameters is computationally expensive as a large number of model evaluations are needed to reach sensitivity index convergence [65]. Under the
assumption that UT&C has a few influential parameters and many non- influential ones, a computationally less expensive screening sensitivity analysis can be performed [31,66], such as the method of elementary effects (EE) [31,65,67].
This method uses individually randomized one-at-a-time designs that cover a wide range of variations over the entire parameter space.
The absolute mean (𝜇|𝐸𝐸|) and the standard deviation (𝜎𝐸𝐸) of the derivatives, called elementary effects (𝐸𝐸𝑖), are used to rank the rel- ative parameter importance [31,65,67]. 𝐸𝐸𝑖 is calculated as follows, defining𝑌 =𝑓(𝑋)as a generalized model output and𝑋=𝑋1,…, 𝑋𝑘 as the vector of k probabilistically distributed parameters [65,67]:
𝐸𝐸𝑖=𝑌(𝑥1,…, 𝑥𝑖+𝛥,…, 𝑥𝑘) −𝑌(𝑥1,…, 𝑥𝑘)
𝛥 , (3)
where𝛥is the parameter variation magnitude, and𝑥1,…, 𝑥𝑘are the realizations of𝑋1,…, 𝑋𝑘. The mean of the elementary effect (𝜇|𝐸𝐸|) is an estimator of the total parameter influence on the output variable, while the standard deviation (𝜎𝐸𝐸) indicates higher-order effects. In the presented study, the Euclidian distance of (𝜇|𝐸𝐸|, 𝜎𝐸𝐸) from the origin (0,0),𝜖=√
𝜇2
|𝐸𝐸|+𝜎2
𝐸𝐸, is used for the overall parameter ranking [31].
The computational protocol of the method of EE is described in detail in [67].
The EE screening test is performed for all four urban densities (LCZ2, LCZ3, LCZ5, LCZ6) to qualitatively assess the relative impor- tance of each of the 25 parameters (Table 1). As model outputs are time series, the mean of the output variable over the total simulation period (10 months at hourly time steps) is used to perform the EE screening. Parameter importance is determined according to whether a parameter ranks in the top 10 𝜖𝑖 for any of the analysed LCZs.
The EE method output is qualitative and parameters are ranked in terms of relative importance without information on how much more important a given parameter is compared to the others or how pa- rameters interact [31,66]. Hence, a variance based sensitivity analysis is subsequently performed (Section2.3.4) to quantitatively assess the individual parameter importance.
2.3.4. Variance based sensitivity analysis
The subset of most important parameters identified through the EE screening method (Section 2.3.3) is further analysed through a variance-based sensitivity analysis following the Sobol methodology [31,68–70]. The Sobol sensitivity analysis is based on a functional analysis of variance (ANOVA) [71] under the assumption that model uncertainty is fully captured by its output variance [31].
Model response Y of a generalized model𝑌 = 𝑓(𝐗) with a total number of k probabilistically distributed parameters specified in vector 𝐗= {
𝑋1,…, 𝑋𝑘}
is partitioned into summands of increasing dimen- sionality according to the criteria specified by [68]. The decomposition is then squared and integrated to partition the output variance,𝑉𝑌, into terms of increasing dimensionality as:
𝑉𝑌=𝑉[𝑌] =𝑉[𝑓(𝐗)] =
∑𝑘
𝑖
𝑉𝑖+
∑𝑘
𝑖=1
∑𝑘
𝑗>𝑖
𝑉𝑖𝑗+⋯+𝑉1...𝑘 (4)
where𝑉𝑖=𝑉[ 𝐸[
𝑌 ∣𝑋𝑖=𝑥∗𝑖]]
, and 𝑉𝑖𝑗 =𝑉[
𝐸[
𝑌 ∣𝑋𝑖=𝑥∗𝑖, 𝑋𝑗= 𝑥∗𝑗]]
−𝑉𝑖−𝑉𝑗.𝐸[⋅|⋅]denotes the condi- tional expectation, and𝑥∗𝑖, 𝑥∗𝑗are the respective real values of parameter i and j. Subsequently, the sensitivity indices are calculated as the ratio of partial variance caused by parameter i to the overall output variance:
1 =
∑𝑘 𝑖
𝑆𝑖+
∑𝑘
𝑖=1
∑𝑘 𝑗>𝑖
𝑆𝑖𝑗+⋯+𝑆1...𝑘 (5)
where𝑆𝑖is the main effect of parameter i (first order sensitivity index), while𝑆𝑖𝑗represents the interactions of parameter i and j (second order sensitivity index).
In this study, the total order sensitivity index 𝑆𝑇 𝑖 is analysed, which includes the main effects as well as all interaction effects of
Table 1
Vegetation parameter ranges and distribution for the elementary effects (EE) prescreening and the variance based sensitivity analysis. Singular vegetation parameters used for the model comparison simulations (Default value SG) are also reported. In performing the EE prescreening, all listed vegetation parameters vary across the specified ranges. In performing the variance based sensitivity analysis, only the vegetation parameters with parameter ranges marked in bold vary, while the remaining vegetation parameters are set at the default value for Singapore. For the model comparison simulations, all vegetation parameters are set at the default value for Singapore unless otherwise specified in the table. Parameter range selection is based on literature values, or approximated based on expert judgement.
Parameter Description Parameter range Sample
distribution
Default value SG Reference
Vegetation amount
𝜆𝑇 𝑟𝑒𝑒 Tree cover within canyon (−) 0.05–0.95 Uniform site specific
𝜆𝐺,𝑣𝑒𝑔 Vegetated ground fraction within canyon (−) 0–1 Uniform site specific
𝐿𝐴𝐼𝑇 Tree leaf area index (−) 0.5–6.5 Beta 3 [53,54]
𝐿𝐴𝐼𝐺 Ground vegetation leaf area index (−) 0.5–6.5 Beta 2.5 [53]
Vegetation structure
𝐻𝑇 Tree height (m) 3-𝑯𝑐𝑎𝑛 Beta site specific [55]
𝑑𝑇 Distance of tree trunk from wall within available space (−)
0.05–0.95 Uniform site specific
ℎ𝑐𝐺 Canopy height of ground vegetation (m) 0.02–0.15 Uniform 0.05
𝑑𝑙𝑒𝑎𝑓 ,𝑇 Tree leaf dimension (cm) 1–10 Uniform 5 [56]
𝑑𝑙𝑒𝑎𝑓 ,𝐺 Ground vegetation leaf dimension (cm) 0.5–3 Uniform 2 [56]
𝐾𝑜𝑝𝑡,𝑇 Tree canopy light extinction coefficient (−) 0.38–0.70 Beta 0.5 [57]
𝐾𝑜𝑝𝑡,𝐺 Ground vegetation canopy light extinction
coefficient (−)
0.22–0.74 Beta 0.5 [57]
Optical properties
𝛼𝑇 Albedo of tree (−) 0.15–0.25 Beta 0.27 [58,59]
𝛼𝐺 Albedo of vegetated ground (−) 0.18–0.3 Beta 0.27 [58,59]
Canopy interception parameters
𝑆𝑃 ,𝐼 𝑛,𝐺 Specific water retained by ground vegetation
surface (mm m2 PFT area m−2 leaf area)
0.1–0.4 Beta 0.2 [60,61]
𝑆𝑃 ,𝐼 𝑛,𝑇 Specific water retained by tree surface (mm m2
PFT area m−2 leaf area)
0.1–0.4 Beta 0.1 [60,61]
Physiological parameters Trees
𝛥0,𝑇 Empirical coefficient that expresses the value of vapour pressure deficit at which𝑓(𝛥𝑒) = 0.5(Pa)
800–2500 Beta 2000 [62]
𝑎1,𝑇 Empirical parameter linking net assimilation𝐴𝑛𝐶 to stomatal conductance𝑔𝑠,𝐶𝑂
2(−)
5–10 Beta 9 [62]
𝐾𝑁 ,𝑇 Canopy nitrogen decay coefficient (−) 0.2–0.5 Beta 0.5
𝑉𝑐,𝑚𝑎𝑥,𝑇 Maximum Rubisco capacity at 25◦C leaf scale
(μmol CO2 m2s)
20–100 Beta 49 [27,63,64]
𝑆𝐿𝐴𝐼 ,𝑇 Specific leaf area (m2 LAI gC−1) 0.012–0.032 Beta 0.02
Ground vegetation
𝛥0,𝐺 Empirical coefficient that expresses the value of vapour pressure deficit at which𝑓(𝛥𝑒) = 0.5(Pa)
800–2500 Beta 2000 [62]
𝑎1,𝐺 Empirical parameter linking net assimilation𝐴𝑛𝐶 to stomatal conductance𝑔𝑠,𝐶𝑂
2(−) (C4 grass)
3–5 Beta 5 [62]
𝐾𝑁 ,𝐺 Canopy nitrogen decay coefficient (−) 0.1–0.4 Beta 0.3
𝑉𝑐,𝑚𝑎𝑥,𝐺 Maximum Rubisco capacity at 25◦C leaf scale
(μmol CO2m2s)
20–100 Beta 54 [27,63,64]
𝑆𝐿𝐴𝐼 ,𝐺 Specific leaf area (m2LAI gC−1) 0.015–0.045 Beta 0.025
the parameter of interest.𝑆𝑇 𝑖 gives a robust estimation of parameter importance and interactions [72,73]. For independent parameters (or- thogonal case),𝑆𝑇 𝑖can be calculated as the sum of all terms of Eq.(5) that include parameter i [66], and is defined as:
𝑆𝑇 𝑖= 𝐸[ 𝑉[
𝑌 ∣𝐗∼𝑖]]
𝑉[𝑌] = 1 −𝑉[ 𝐸[
𝑌 ∣𝐗∼𝑖]]
𝑉[𝑌] (6)
where 𝐗∼𝑖 is a vector of all probabilistically distributed parameters except the𝑖th. There are multiple computational methods to calculate 𝐸[
𝑉[ 𝑌 ∣𝐗∼𝑖]]
[72,74,75], and we follow the approach of [74]. Further information and the detailed computational protocol of Sobol’s sensitiv- ity analysis [68] can be found in [31,69,70]. The Sobol low discrepancy sequence [76,77] is chosen as sampling strategy due to its enhanced convergence rate of the numerically estimated sensitivity indices [69].
A convergence test was conducted to define the necessary number of model runs. A total of 14,336 model evaluations per LCZ were selected. Uncertainty bars of the sensitivity indices were calculated using bootstrapping [71] with 1000 bootstrap replicates.
As model outputs are time series, the mean of the output variables including the entire 10 months (all weather conditions) is used to calculated 𝑆𝑇 𝑖 for four different time periods of the day. The four groups were night (1900–0700 local time, LT), morning (0800–1100
LT), midday (1200–1400 LT), and afternoon (1500–1800 LT). In Sin- gapore, there is minimal difference in daylight length throughout the year and solar noon is around 1300 LT.
2.4. Influence of vegetation amount and properties on diurnal outdoor thermal comfort
The influence of vegetated ground and tree cover plan area fraction within the urban canyon, 𝜆𝐺,𝑣𝑒𝑔 and𝜆𝑇 𝑟𝑒𝑒 (Fig. 1), as well as of the remaining vegetation parameters on UTCI is analysed for the four different urban densities (LCZ 2, 3, 5, and 6, Section2.3.1) and the four different time periods using the 14,336 model evaluations necessary for the variance based sensitivity analysis (Section2.3.4). The results are analysed as follows:
1. The hourly simulation outputs of each time series and for each model evaluation are binned according to the time periods i.e., portions of the day as specified above (Section2.3.4) using the entire 10 months time series with all occurring weather conditions.
2. These binned time series are averaged for each model evaluation within each time bin.
3. For each combination of𝜆𝐺,𝑣𝑒𝑔and𝜆𝑇 𝑟𝑒𝑒:
(a) the average UTCI is calculated including all model evalu- ations.
(b) the difference between the 95th and 5th percentiles of UTCI in the different model evaluations is calculated.
The result of step 3a represents the average expected UTCI, if only ground vegetation and tree fractions are specified but vegetation prop- erties are allowed to vary. For example, in a defined urban density at 30% grass and 20% tree cover plan area fraction within the urban canyon, the UTCI is expected to be x◦C on average if there is no accu- rate assignment of tree height, leaf area index, or tree photosynthetic properties. The result of step 3b represents the range of variability (5th–95th percentile) expected for UTCI that can be achieved through a change in vegetation properties for a given combination of𝜆𝐺,𝑣𝑒𝑔and 𝜆𝑇 𝑟𝑒𝑒. For example, in a defined urban density with 30% grass and 20%
tree cover plan area fraction within the urban canyon, it represents how much UTCI could be modified if plant parameters were changed according to the above specified ranges, which leads to a best and worse OTC for a given configuration of vegetation fractions.
The effect of humidity increase on UTCI due to vegetation is further analysed through the removal of variability of humidity with 𝜆𝐺,𝑣𝑒𝑔 and𝜆𝑇 𝑟𝑒𝑒. This means that UTCI is also calculated with the average simulated humidity in the vegetation fraction combination bin of 0
< 𝜆𝐺,𝑣𝑒𝑔<0.05 and 0.05< 𝜆𝑇 𝑟𝑒𝑒<0.1 (Figure C.11).
2.5. Vegetation properties that enhance thermal comfort during periods of extreme heat
Urban vegetation should not only improve climatic conditions on average, but it should do so especially during heat waves. Hence, the distribution of vegetation parameters, which provide the lowest UTCI during the 5% hottest hours of the years is also analysed. For this purpose, we first determine the 95% percentile of UTCI for each model evaluation time series. Subsequently, the 10% model evaluations with the lowest 95% percentile of UTCI are selected. For these 10% ‘‘coolest’’
model evaluations, histograms of parameter distributions are plotted, which identify parameter selections that result in higher cooling during peak temperatures. Note, the histograms would show a uniform distri- bution if all or a random selection of model evaluations were included as this is the set-up of the sensitivity analysis. For the parameters which follow a Beta distribution, the displayed parameter distribution in the results section is back-transformed to also follow a uniform distribution if all model evaluations were included.
3. Results
3.1. Model performance assessment
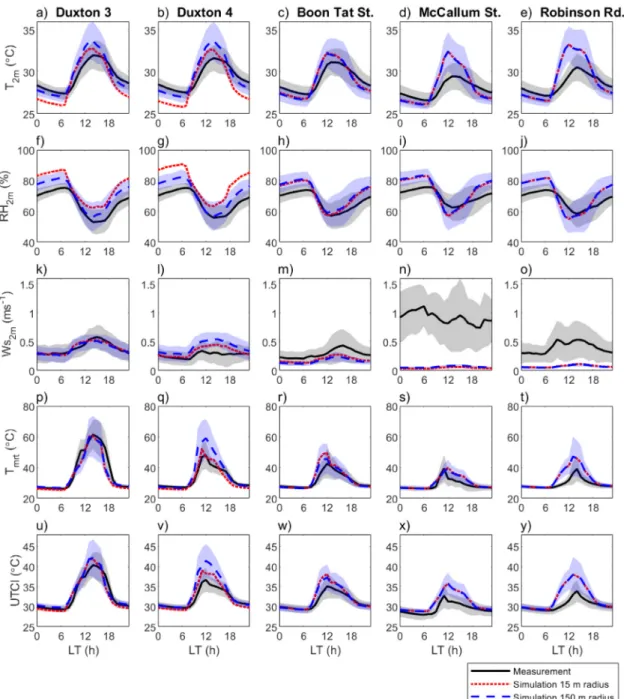
The model and measurements comparison (Fig. 3,Table 2) shows a relatively good agreement considering any lack of model calibration between simulated and measured𝑇2𝑚,𝑅𝐻2𝑚,𝑇𝑚𝑟𝑡, and UTCI in low to mid-rise settings such as Boon Tat St., Duxton3, and Duxton4. However, this is true only if the high tree cover, surrounding the measurement location at Duxton4, is included in the calculation of 𝑇𝑚𝑟𝑡 and UTCI, otherwise,𝑇𝑚𝑟𝑡and UTCI are over-predicted in Duxton4 due to the lack of tree shade as illustrated inFig. 3q and v (blue vs red lines).
High𝑅2values are observed for𝑇2𝑚with 0.82, 0.79, and 0.81 and 𝑅𝐻2𝑚 with 0.86, 0.82, and 0.86 for Duxton3, Duxton4, and Boon Tat St., respectively. The RMSE for the same sites is 1.2◦C, 1.4◦C, and 1.2
◦C, and 6.7 %, 6.7 %, and 7.0 % for𝑇2𝑚and𝑅𝐻2𝑚, respectively. There is a very likely constant offset between the humidity measurements, which are used as model forcing data, and the real relative humidity above the microclimate measurements leading to a consistent over- prediction of𝑅𝐻2𝑚. This offset is most clearly shown at night (Fig. B.2).
Additional discrepancies might be due to the fact, that UT&C is likely
underestimating daytime convection efficiency for the turbulent trans- port of heat and water vapour, which leads to a slight overestimation of the𝑇2𝑚mean diurnal cycle amplitude as can be seen inFig. 3.
High𝑅2 values are also observed for𝑇𝑚𝑟𝑡in Duxton3 and Duxton4 with 0.80 and 0.81, while 𝑅2 is lower for Boon Tat St. with 0.59.
Boon Tat St. has a higher unsystematic than systematic RMSE (5.2◦C vs 0.8◦C) indicating that most of the error is likely introduced by a process that cannot be reproduced by the model.𝑇𝑚𝑟𝑡is highly influenced by the presence or absence of direct solar radiation. During the measurement period at Duxton3 and Duxton4 (July 2019 to mid November 2019) incoming solar radiation is high and rainfall scarce, while during the measurement period at Boon Tat St. (mid November 2019 to mid April 2020) incoming direct solar radiation decreases and rain occurs more often (Fig. B.1). Such a shift in meteorological conditions likely emphasizes the slight mismatch between the meteorological conditions at the location where model forcing data was measured and the actual meteorological conditions directly above the micro climate stations and decreases the modelled𝑅2for𝑇𝑚𝑟𝑡as rainfall and cloud cover are highly localized in Singapore. The RMSE for𝑇𝑚𝑟𝑡is 6.5◦C, 7.2◦C, and 5.3◦C for Duxton3, Duxton4, and Boon Tat St., respectively.
Similar to𝑇𝑚𝑟𝑡, UTCI shows high𝑅2values for Duxton3 and Duxton4 with 0.84 and 0.81, and a lower𝑅2for Boon Tat St. with 0.70 which is likely caused by the effects of𝑇𝑚𝑟𝑡. The RMSE for𝑈 𝑇 𝐶𝐼is 2.0◦C, 2.8
◦C, and 1.9◦C for Duxton3, Duxton4, and Boon Tat St., respectively.
In dense high-rise settings, such as McCallum St. and Robertson road,𝑇2𝑚,𝑇𝑚𝑟𝑡, and UTCI are overestimated by the model simulations during daytime (Fig. 3). This overestimation is possibly caused by the integrated radiation scheme of UT&C, which overpredicts surface temperatures at pedestrian level in dense high-rise settings, as the absorbed radiation by a partly sunlit wall is averaged over the total wall area. Such a higher surface temperature also leads to higher𝑇𝑚𝑟𝑡 and possibly higher𝑇2𝑚 as seen inFig. 3s, t, d, and e. As the general trends of UTCI in dense high-rise settings are not properly reproduced by UT&C as shown here, the sensitivity analysis (Sections3.2to3.5) will only focus on low and mid-rise urban areas.
As shown by the low 𝑅2 values (Table 2), wind speed is not well predicted by UT&C in any of the analysed scenarios. However, the average magnitude is correctly reproduced for medium to low rise settings. The lack of temporal correlation between observed and simulated wind speed was expected, as wind speed is highly influenced by the detailed urban geometry while UT&C applies a general wind profile parameterization calculated based on the observed average urban fabric.
In summary, UT&C’s parameterization is based on the neighbour- hood scale, which is likely also the spatial scale that determines the measured 𝑇2𝑚 and𝑅𝐻2𝑚 due to turbulent mixing of air, while𝑇𝑚𝑟𝑡 and 𝑊 𝑠2𝑚 are highly influenced by the local geometry which can cast shade or block wind-flow at the specific point of observation.
Hence, while UT&C predicts 𝑇2𝑚 and 𝑅𝐻2𝑚 well using the average neighbourhood landcover fraction (radius 150 m), it performs better for𝑇𝑚𝑟𝑡when using the landcover composition of the immediate sensor environment (radius 15 m), as seen by the example of Duxton4. In the subsequent sensitivity analysis, it is assumed that the low- to mid- rise urban settings (LCZ2, LCZ3, LCZ5, and LCZ6) are homogeneous neighbourhoods to align the scales of𝑇2𝑚,𝑅𝐻2𝑚,𝑇𝑚𝑟𝑡,𝑊 𝑠2𝑚, and UTCI.
3.2. Elementary effects
The performed EE pre-screening of 25 selected vegetation param- eters identifies vegetation amount, structure, and tree physiological parameters as the most influential on UTCI in Singapore (Fig. 4). The parameters specifying plant interception, albedo, and ground vegeta- tion physiology influence UTCI to a lesser extent. This is largely due to the amount of photosynthetic active radiation available to both vegetation types (ground vegetation and trees). Ground vegetation is more often shaded by buildings and tree canopies than trees themselves
Fig. 3. Model performance assessment through the comparison of mean diurnal cycles±1 standard deviation of measured and simulated𝑇2𝑚,𝑅𝐻2𝑚,𝑊 𝑠2𝑚,𝑇𝑚𝑟𝑡, and UTCI for the measurement locations of (a) Duxton3, (b) Duxton4, (c) Boon Tat St., (d) McCallum St., (e) Robinson Rd using the whole simulation period for each location. Red lines depict the simulated mean diurnal cycle obtained with simulations using the vegetation cover fractions within a 15 m radius of the microclimate sensors rather than 150 m. (For interpretation of the references to colour in this figure legend, the reader is referred to the web version of this article.)
and hence, receives on average less solar radiation to perform pho- tosynthesis. Therefore, the physiological parameters governing ground vegetation response become less important.
As parameter sensitivity can depend on time of the day, the Eu- clidean distance (𝜖𝑖) was also analysed for day and night time separately in each urban density (not shown). Although, the relative ranking of the top 10 parameters varied between day and night time, this did not translate into a different selection of the most important parameters.
Furthermore, there are no clear differences in the results of the EE pre-screening between the analysed LCZs (Fig. 4).
The EE pre-screening lead to a selection of a total of 12 parameters used in the variance based sensitivity analysis: vegetation parameters defining vegetation amount (𝜆𝑇 𝑟𝑒𝑒, 𝜆𝐺,𝑣𝑒𝑔, 𝐿𝐴𝐼𝑇, 𝐿𝐴𝐼𝐺), vegetation structure (𝐻𝑇, 𝑑𝑇, 𝑑𝑙𝑒𝑎𝑓 ,𝑇, 𝐾𝑜𝑝𝑡,𝑇, ℎ𝑐,𝐺), as well as tree physiology (𝑉𝑐,𝑚𝑎𝑥,𝑇,𝑎1,𝑇,𝛥0,𝑇) were selected. The remaining parameters were set
at their default value (Table 1). The selected parameter ranges and values for the full variance based sensitivity analysis are marked in bold inTable 1.
3.3. Variance based sensitivity analysis
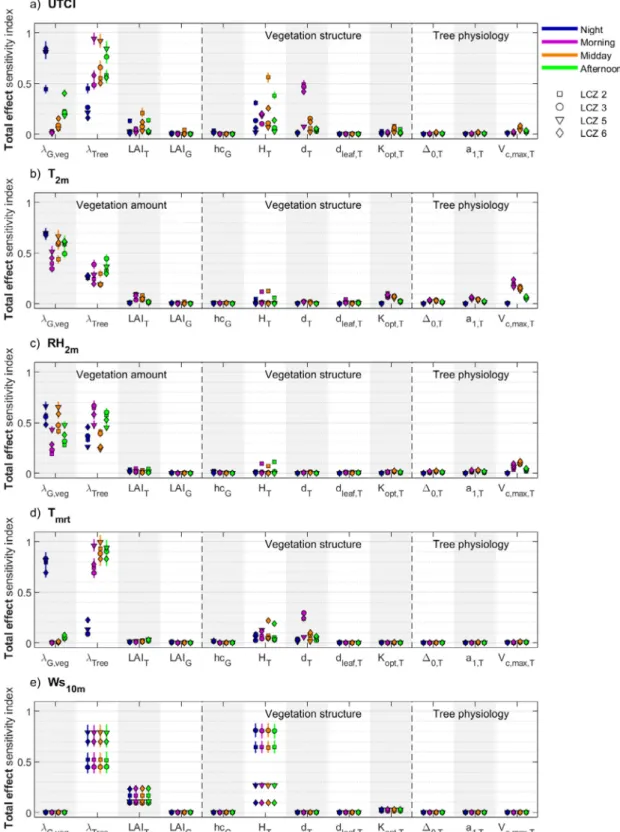
UTCI is influenced by ground vegetation, 𝜆𝐺,𝑣𝑒𝑔, and tree cover fraction,𝜆𝑇 𝑟𝑒𝑒, but also by the tree height and placement (Fig. 5a).
The effects of𝜆𝑇 𝑟𝑒𝑒and𝜆𝐺,𝑣𝑒𝑔differ during day and night time. During daytime,𝜆𝑇 𝑟𝑒𝑒has a higher influence on UTCI than 𝜆𝐺,𝑣𝑒𝑔, while the opposite is true during night time, a trend also shown in Section3.4.
Furthermore, during midday and afternoon, the parameter maximum Rubisco capacity,𝑉𝑐,𝑚𝑎𝑥,𝑇, governing photosynthesis, as well as LAI and optical density of the tree canopy, 𝐾𝑜𝑝𝑡,𝑇, also affect UTCI, but to a lesser extent than the other parameters.