Research Collection
Report
Outdoor Thermal Comfort and Cognitive Performance of Older Adults in Singapore: A field quasi-experiment
Author(s):
Borzino, Natalia; Chng, Samuel; Chua, Rochelle; Nevat, Ido; Schubert, Renate Publication Date:
2020-08-20 Permanent Link:
https://doi.org/10.3929/ethz-b-000432015
Rights / License:
In Copyright - Non-Commercial Use Permitted
This page was generated automatically upon download from the ETH Zurich Research Collection. For more information please consult the Terms of use.
SMU Classification: Restricted
DELIVERABLE TECHNICAL REPORT
Version 20/08/2020
2.3.3. OUTDOOR THERMAL COMFORT AND COGNITIVE PERFORMANCE OF OLDER ADULTS IN SINGAPORE: A FIELD
QUASI-EXPERIMENT
Project ID NRF2019VSG-UCD-001
Project Title Cooling Singapore 1.5:
Virtual Singapore Urban Climate Design
Deliverable ID 2.3.3 Outdoor Thermal Comfort And Cognitive
Performance Of Older Adults in Singapore: A Field Quasi-Experiment
Authors Natalia Borzino, Samuel Chng, Rochelle Chua,
Ido Nevat, Renate Schubert DOI (ETH Collection)
Date of Report 20/08/2020
Version Date Modifications Reviewed by
1 09/08/20 Renate Schubert
2 11/08/20 Ido Nevat
2
1 Abstract
This field quasi-experiment with 109 older in Singapore adults examined their cognitive performance in outdoor naturalistic environments and how it is potentially influenced by the Physiological Equivalent Temperature (PET) index(proxy for outdoor thermal comfort (OTC)) and individual climatic conditions (i.e. air temperature, relative humidity, mean radiant temperature and wind speed). Cognitive performance was evaluated when older adults performed physical and sedentary outdoor activities in residential and commercial areas at different times of the day (i.e. morning, afternoon and evening) using a Stroop game. Besides, we collected socio-economic and demographic characteristics and lifestyle data of the participants. Overall, our results show that a higher PET (could also be interpreted as a lower OTC) was negatively related to older adults’ cognitive performance. Wind speed improved cognitive performance while air temperature, relative humidity and mean radiant temperature have detrimental effects on their cognitive outcomes, however in dissimilar magnitude. Social isolation, the use of air-conditioning at home, low levels of educational attainment, poor self-rated health and the engagement in sedentary activities were also related to poorer cognitive performance. These findings suggest that older adults’ cognitive performance was poorer when OTC was lower and this effect might be exacerbated by lifestyle and demographic characteristics. Further investigation into the effects of the lower OTC on older adults’ cognitive performance in different areas of Singapore will be useful for the identification of potential mitigation and adaptation actions.
3
Table of Content
1 Abstract ... 2
2 Introduction ... 4
2.1 Objectives ... 5
3 Method ... 5
3.1 Experimental design ... 5
3.2 Instruments ... 6
3.3 Protocol ... 8
3.4 Sample description ... 10
4 Results ... 11
4.1 Description of the survey data ... 11
4.2 Determinants of the cognitive performance ... 12
5 Conclusion ... 19
6 Future steps ... 20
7 Glossary ... 21
7.1 Acronyms used ... 21
7.2 Definition of key terms used ... 21
8 References ... 24
9 Annex ... 25
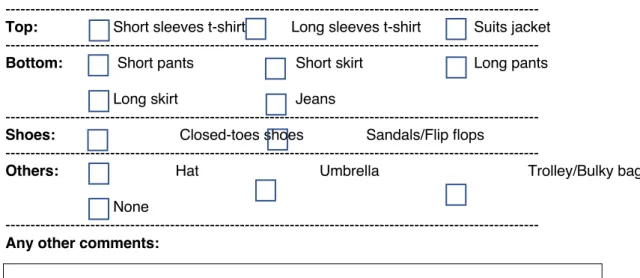
9.1 Annex 1 - Participant Information Sheet, Consent form, Survey Questionnaire ... 25
9.2 Annex 2 - Description of study neighbourhoods & study sites ... 35
9.3 Annex 3 – Stroop Game Screenshots ... 37
9.4 Annex 4 – Image of Kestrel 5400 Heat Stress Meters Deployed ... 38
4
2 Introduction
Cognition (the ability to learn, solve problems, remember, and appropriately use stored information) is a key to successful health and aging. Cognitive performance is critical for functional independence as people age, including if someone can live and work independently, manage finances, take medications correctly, or drive safely (Murman, 2015).
Cognitive abilities tend to decline with age (Glisky, 2007; Murman, 2015) and with age there is also a natural concurrent reduction in thermoregulatory abilities (Holowatz and Kenney, 2010; Holowatz, et al., 2011). The reduction of both the cognitive performance and thermoregulation capacities suggest that older adults might be highly susceptible to the increasing ambient temperature outdoors.
Singapore has experienced an increase in air temperature and humidity over the past three decades (Meteorological Service Singapore (MSS), 2020), and so it seems important to examine the effect of outdoor thermal comfort (OTC) on older adults’ cognitive performance in Singapore.
Heng and Chow (2019) calibrated the outdoor thermal comfort thresholds of Physiological Equivalent Temperature (PET) for Singapore’s outdoor spaces, wherein thermal neutrality was achieved at 27.2°C for acclimatised respondents while PET above 31.1°C was considered thermally stressful. The PET index was used as a proxy for OTC by capturing how changes in the thermal environment can affect an individual’s outdoor thermal comfort (Deb and Ramachandraiah, 2010; Heng and Chow, 2019).
Using the PET index presents several advantages: 1) combines outdoor climatic conditions (wind, Tmrt, air temperature and humidity) and thermo-physiological factors (activity of humans and clothing); 2) has a thermo-physiological background and so it gives the real effect of the sensation of climate on human being; 3) it is measured in °C and so can be easily related to common experience; 4) It does not rely on subjective measures and; 4) it is useful in both hot and colder climates (Deb and Ramachandraiah, 2010).
Published studies also evaluated the effect of some of the individual outdoor climatic conditions in older adults’ cognitive performance. Older adults’ cognitive performance was negatively correlated to relative humidity (Moyen et al., 2014; Trezza et al, 2015). Similarly, higher air temperature (Hancock et al., 2007; Holowatz and Kenney, 2010; Holowatz et al., 2010) and prolonged exposure to mean radiant temperature were related to lower cognitive performance (Piil et. al, 2020). These studies were conducted in controlled laboratory settings and they were done in either the United States or the European countries. To our knowledge, no study has been conducted in natural outdoor settings and in a tropical country. In this sense, we sought to bridge this gap by examining the impact of naturalistic outdoor climatic conditions on older adults’ cognitive performance in a tropical country like Singapore.
5 2.1 Objectives
The study aimed to:
• Examine the effects of individual climatic conditions (which include wind speed, air temperature, relative humidity and mean radiant temperature (Tmrt)1 on older adults’ cognitive performance.
• Establish the relationship between PET2 and older adults’ cognitive performance, and
• Examine the cognitive performance of older adults across sociodemographic and varying lifestyle characteristics.
To do so, we implemented an exploratory quasi-experimental design in naturalistic outdoor environments in different moments of the day (i.e. morning, afternoon and evening) and in two different neighbourhoods (i.e. residential and commercial) in Singapore.
3 Method
3.1 Experimental design
We conducted a quasi-experiment naturalistic outdoor environments with 109 older adults from December 2019 to February 2020. Participants were recruited based on a convenient sample approach.
We measured their cognitive performance by evaluating the attention span, cognitive load and information processing time using a Stroop game (see Section 2.2. for details of the game). This was done at different times of the day (i.e. morning, afternoon and evening) in two neighbourhoods (i.e.
Punggol and CDB area). The data collection at different moments of the day allowed us to have more diverse climatic conditions, under which our participants performed the Stroop games. The neighbourhoods represented the residential and commercial parts of Singapore respectively (see Annex 2 for the map on both study neighbourhoods and study sites). This feature of the design allowed us to collect observations from participants with diverse demographic, socio-economic and lifestyle characteristics. It is important to note that the annual mean air temperature (data provided by MSS3) of both neighbourhoods between 2010 – 2019 were compared and no significant differences was observed (see Annex 2 for comparison).
1Refer to section 7.2 for definitions of each climatic conditions examined
2 Refer to section 7.2 for definitions and components of PET calculated.
3 A ten-year mean annual air temperature reading between 2010 to 2019 was provided by the Meteorological Services of Singapore department. The data provided represented the mean air temperature of each typical month within a calendar year.
6
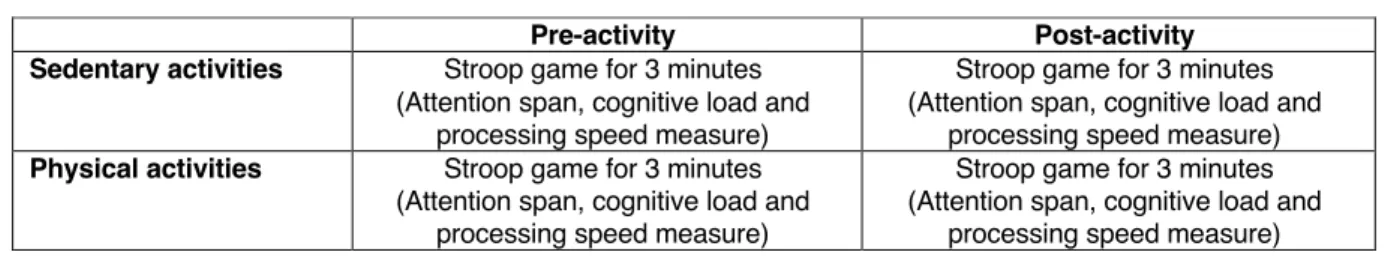
Table 1. Experimental Design
Table 1 illustrates our experimental design. The 109 participants completed the Stroop game twice: 1) before performing a sedentary or physical outdoors activity (i.e. pre activity) and 2) after 40-60 minutes of performing the activity (i.e. post activity). Results from the pre-activity served as a baseline while results from the post-activity could partially account for the exposure to environmental conditions as an older adult engage in their routine activity. In both cases, the Stroop game was performed for three minutes. Before the pre-activity Stroop game, participants completed a questionnaire with items related to lifestyle, demographic and socio-economic characteristics.
As the Stroop game required participants to differentiate between colours and read basic colour names, older adults who suffer from colour blindness (assessed using the Ishihara colour-blindness test) and/or those who were unable to read colour names were excluded. Additionally, older adults who were unable to provide their informed consent were also excluded in compliance with ethical concerns. An IRB approval from the ETH Zurich Ethics Commission was obtained prior to data collection.4
3.2 Instruments
Three instruments were deployed, which included (a) a survey questionnaire for sociodemographic and lifestyle data, (b) a Stroop game for cognitive performance, and (c) mobile kestrels for capturing climatic conditions during the data collection process.
a) Survey Questionnaire:
A short survey questionnaire with four sections was administered to our participants.
Participants could choose whether to have the questionnaire administered in English or in Chinese. The first section collected sociodemographic information (i.e. gender, age, educational attainment, employment status, the average household income, dwelling type and
4IRB reference number EK 2019-N-156.
Pre-activity Post-activity
Sedentary activities Stroop game for 3 minutes (Attention span, cognitive load and
processing speed measure)
Stroop game for 3 minutes (Attention span, cognitive load and
processing speed measure) Physical activities Stroop game for 3 minutes
(Attention span, cognitive load and processing speed measure)
Stroop game for 3 minutes (Attention span, cognitive load and
processing speed measure)
7
living arrangements). In the second section, participants self-rated their health status on a 5- point Likert scale, with 1 being poor and 5 being excellent. The third section measured the strength of social support and level of isolation using the six-item Lubben Social Network Scale (Cronbach alpha = 0.86; Myagmarjav et al., 2019). On a scale of 1 to 30, scores below 12 points were classified as being socially isolated and scores of 12 and above were classified as socially active (reference group; Lubben et al., 2006). Lastly, the fourth section comprised lifestyle questions (i.e. amount of time they spent outdoors and their air-conditioning usage at home) and general attitudes and perceptions on Singapore’s climatic conditions and the rising urban heat. Participants responded on a 5-point Likert scale with 1 being “Strongly Disagree”
and 5 being “Strongly Agree” for these scales.
For potentially sensitive questions (e.g. educational attainment, employment status, the average household income, dwelling type or living arrangements), an option of “prefer not to say” was provided to participants if they chose not to answer them. This was provided for ethical compliance and to safeguard the rights of the participants.
b) Stroop game:
The Stroop game is a commonly used research tool in psychology to measure cognitive performance (MacLeod, 2010). In the game, an individual is required to focus on task-relevant stimuli properties (i.e. identifying the colours of printed words) while holding back prepotent responses (i.e. reading the words regardless of the colour). Hence, it explores the performance cost in the mismatch condition relative to the control condition (MacLeod, 2010). For this study, the Stroop game was programmed in-house to measure three components of cognitive performance experienced by older adults: processing time, attention span and interference effect. The game was programmed in English and in Chinese and the participants could choose in which language to perform the game. The game was administered using an electronic tablet and the maximum duration of each game session was 3 minutes (See Annex 3 for screenshots of the Stroop game). Participants were required to indicate their response to each question by selecting the answers presented at the bottom of the tablet screen within five seconds before the question on the screen was replaced.
Two types of questions were presented. A congruent question, also known as the control condition, was one where the ink colour coincided with the colour name flashed on the tablet screen (see Annex 3, figure 6a). An incongruent question, also known as the mismatch condition, was when the ink colour was different from colour name (see Annex 3, figure 6b).
Congruent questions mimic easy tasks in real life that require lesser cognitive effort while incongruent questions simulate difficult tasks that require more cognitive effort and longer
8
processing time (MacLeod, 2010). An equal number of eighteen congruent and eighteen incongruent questions were presented in each game session in randomised order. Accordingly, there are three possible responses: correct, wrong or missed.
In ensuring that participants were acquainted with the interface, a trial session of 1 minute with twelve questions (i.e. six congruent and six incongruent) was conducted.
c) Mobile kestrels:
Tripod-mounted Kestrel 5400 Heat Stress Trackers, also known as kestrels, were used to capture the outdoor climatic conditions (i.e. air temperature, relative humidity, wind speed and the globe temperature) during the study (see Annex 4 for the kestrels deployed on-site during the data collection sessions). These kestrels were set-up and switched-on approximately 15 minutes prior to data collection to obtain equilibrium with the surrounding environment and ensure measurement accuracy. The kestrels were placed approximately at 0.5 metre radius in front of the midpoint between two participants and positioned 1.2 metre above ground when participants engaged in the pre-activity Stroop game. When participants engaged in their routine activity, the kestrels were relocated to approximately 1.5 metre away from them to capture the climatic conditions of their exercise space. The measurement from the kestrel was also used to build the Physiological Equivalent Temperature (PET) index (see the Glossary in section 7 for further definition, explanation and calculation).
3.3 Protocol
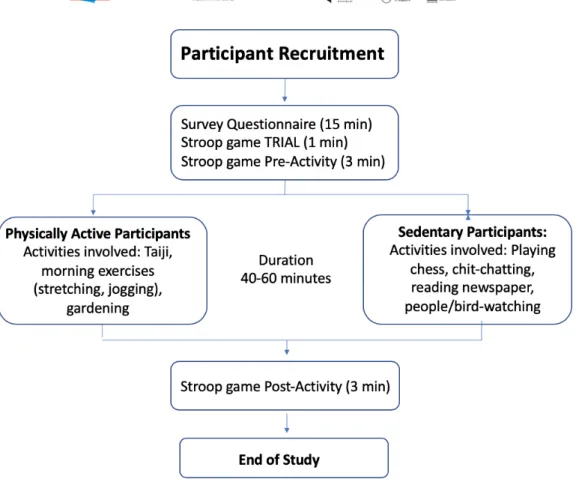
Specifically, the study protocol was as follows (see Figure 1):
1. Participants were recruited using a convenient sample approach. An information sheet5 which contained information on the project was handed out, where older adults were introduced to the purpose and goals of the project. In increasing the comprehensibility and transparency of the briefing process, researchers verbally explained the information to older adults on-site. They were also briefed on the payment breakdown, which was bifurcated into two components.
(i) A 5 dollars voucher were given for completing the survey questionnaire.
(ii) The second component depended on the performance of one out of two randomly selected Stroop game results that they engaged in as part of the data collection process (refer to table 1 in Information Sheet for the corresponding amount of gift vouchers received). The mean payment varied between SGD$5 to SGD$20 according to the number of correct answers.This incentive compatible mechanism was introduced with
5Refer to Annex 1 for the Participant Information Sheet
9
the aim of increasing both the internal and external validity of the results from the Stroop game sessions6.
2. If older adults understood the purpose of the study and agreed to participate, they were asked to
give their agreement by signing on the consent form7.
3. After signing the consent form, participants were first required to complete a survey questionnaire (in English or in Chinese accordingly to the preference of the participants) which lasted between 10-15 minutes (see Annex 1 for the survey questionnaire).
4. Following which, the rules of the Stroop game were explained to the individual participant before they engage in the trial session for 1 minute (See section 3.2 part (b) for Stroop game instructions;
see Annex 3 for screenshots of Stroop game). The actual pre-activity game proceeded if the participant was comfortable with and raised no questions about the game after the trial session was completed. Researchers on-site ensured that participants maintained a minimum physical distance of one meter between each other before the Stroop game was administered to prevent the possibility of a learning effect. Participants were also allowed to withdraw from the game (and the study) at any point by pressing the “opt-out” button located at the top right corner of the screen.
However, no participant did so during the study.
5. Once the pre-activity Stroop game was completed, participants engaged themselves in their routine activity (i.e. physical or sedentary). The duration of the activities older adults engaged in lasted between 40-60 minutes, depending on the site and the activity they typically engage in (see Figure 1 for a description of the activities).
6. After the older adults completed their routine activity, they participated in the post-activity Stroop game session.
7. Completing the post-activity Stroop game, each participant was requested to press the
“Randomized!” button where the programme randomly selected either one of the two game scores (see Annex 3 figure 7 for screen shot). The participant was rewarded with gift vouchers corresponding to the number of correct responses from the randomly selected game (refer to table 1 in Information Sheet for associated the gift voucher amount).
6Internal validity was achieved as older adults were incentivized to focus their attention on the questions and were motivated to provide as many correct responses as they possibly could. External validity was achieved as the Stroop games mimicked real-life situations, in which older adults’ attention span and the processing of information are employed to maximize their expected utility and make “optimal” decisions.
7 Refer to Annex 1 for consent form.
10
Figure 1. Summary of Study Protocol
3.4 Sample description
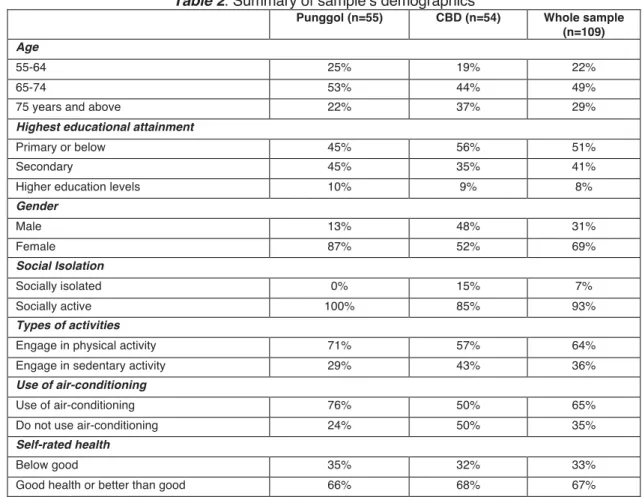
We performed 4 data collections in Punggol and 6 sessions in CBD. 55 participants were from Punggol and 54 older adults were from the CBD neighbourhood. Table 2 shows the sociodemographic, and lifestyle characteristics of our sample. We observed that 71% of participants from Punggol engaged in physical activities and 29% engaged in sedentary activities. In CBD, 57% of the participants engaged in physical activities and 43% took part in sedentary activities. In Punggol, 25% of the participants were between 55-64 years old; 53% were between 65-74 years old and; 22% were over 74 years old. In the CBD Area, 19% were between 55-64 years, 44% were between 65-74 years old and 37% were over 74 years old. Participants recruited from Punggol were socially active while 15% of the participants from the CBD Area were perceived to be socially isolated (see Section 2.1.a for details). In terms of air-conditioning usage, 76% of Punggol participants and 50% of CBD participants reported using air- conditioning at home. Overall, 92% of the sample accomplished at least a primary school education.
69% of the participants were women. More than two thirds of the participants from both neighbourhoods were positive about their health status.
11
Table 2. Summary of sample’s demographics
Punggol (n=55) CBD (n=54) Whole sample (n=109) Age
55-64 25% 19% 22%
65-74 53% 44% 49%
75 years and above 22% 37% 29%
Highest educational attainment
Primary or below 45% 56% 51%
Secondary 45% 35% 41%
Higher education levels 10% 9% 8%
Gender
Male 13% 48% 31%
Female 87% 52% 69%
Social Isolation
Socially isolated 0% 15% 7%
Socially active 100% 85% 93%
Types of activities
Engage in physical activity 71% 57% 64%
Engage in sedentary activity 29% 43% 36%
Use of air-conditioning
Use of air-conditioning 76% 50% 65%
Do not use air-conditioning 24% 50% 35%
Self-rated health
Below good 35% 32% 33%
Good health or better than good 66% 68% 67%
4 Results
4.1 Description of the survey data
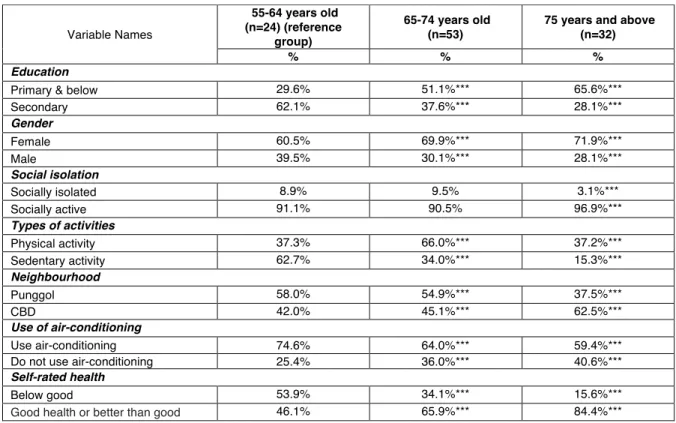
Table 3 displays the descriptive statistics of the sociodemographic and lifestyle characteristics of our sample. To account for a natural decline in cognitive performance of older adults and to control for this across our participants, we divided the sample in three age groups (i.e. 55-64 years old; 65-74 years old and above 75 years old). This age division is consistent with the one commonly used in Psychology studies (Cornwell & Waite, 2009).
A non-parametric Wilcoxon Mann-Whitney test was conducted to identify differences in mean between the socio-economic, demographic and lifestyle across the age groups, with the younger group (i.e. 55- 65 years old) being the reference group. Significant differences in educational attainment (both primary and secondary), gender, social isolation, use of air-conditioning and self-rated health were observed across age groups.
12
Educational attainment was higher among 55-64 years-old where 62.1% had at least a secondary school education, compared to 28.1% of above 75 years-old adults. There were also significantly more females than males in the three age groups. Meanwhile, social isolation were more predominant among those below 75 years old, which accounted for a total of 18.48%, juxtaposed to 3.1% of above 75 year- old adults. Concurrently, the use of air-conditioning were more commonly indicated by the groups 55- 64 and 65-74 years-old, which represented 74.6% and 64.0% of air-conditioning users respectively, as compared to 59.4% among those aged 75 years and above. On the other hand, the participants between 55-64 years old were significantly less positive about their health status than those aged 75 years and above, where 53.9% of the former rated their health as below good as compared to 15.6%
of the latter.
Table 3. Table of Descriptive Statistics
Stars report the result for Wilcoxon Mann-Whitney tests to test for differences across 65-76 and over 75 years old compared with 55 to 65 years old group (reference). *** p<0.01, ** p<0.05, * p<0.1
4.2 Determinants of the cognitive performance
In this subsection, we perform a regression analysis to study the influence of each of the climatic conditions and PET index as well as demographic, socioeconomic and lifestyle characteristics (i.e.
explanatory variables or covariates) on OAs’ cognitive performance. As stated in the Section 3.1, cognitive performance is defined as the information processing time, cognitive load and attention span of each participant.
Variable Names
55-64 years old (n=24) (reference
group)
65-74 years old (n=53)
75 years and above (n=32)
% % %
Education
Primary & below 29.6% 51.1%*** 65.6%***
Secondary 62.1% 37.6%*** 28.1%***
Gender
Female 60.5% 69.9%*** 71.9%***
Male 39.5% 30.1%*** 28.1%***
Social isolation
Socially isolated 8.9% 9.5% 3.1%***
Socially active 91.1% 90.5% 96.9%***
Types of activities
Physical activity 37.3% 66.0%*** 37.2%***
Sedentary activity 62.7% 34.0%*** 15.3%***
Neighbourhood
Punggol 58.0% 54.9%*** 37.5%***
CBD 42.0% 45.1%*** 62.5%***
Use of air-conditioning
Use air-conditioning 74.6% 64.0%*** 59.4%***
Do not use air-conditioning 25.4% 36.0%*** 40.6%***
Self-rated health
Below good 53.9% 34.1%*** 15.6%***
Good health or better than good 46.1% 65.9%*** 84.4%***
13
As proxy measures of information processing time, cognitive load and attention span, we use “Total game time”, “Interference effect” and “Correct responses”, respectively. As these three are bounded continuous response variables, Ordinary Least Square (OLS) models were employed in the regressions. Also, standard errors were clustered at the subject level for all regression analyses.
We define the response (or dependent) variables as follow:
1. Total game time: defined as the total time in seconds that each participant needed to complete the Stroop games and it is proxy for processing time.
2. Interference effect: defined as the difference in time needed for each participant to answer congruent and incongruent questions and this is a proxy for the cognitive load (see Section 2.2. for details).
3. Correct responses: defined as the number of correct responses by the participants during the Stroop games and this is a proxy of attention span.
The lower the coefficients for the “Total game time”, the faster the information processing time. The lower the coefficient displayed in the regression model for the “Interference effect”, the lower the cognitive load. Lastly, the higher the coefficients for “Correct responses”, the greater the attention span.
We also define the explanatory variables (or covariates) as follow:
1. Humidity, wind speed, air temperature and Tmrt.: these climatic variables were measured for each participant at the exact moment in which the Stroop games were performed (see Section 7 for details).
2. Mean PET: this was calculated for each participant by taking into consideration the climatic conditions at the exact moment in which participants performed the Stroop game, their clothing and the metabolic rate related to the activity (both physical or sedentary) they were engaged in during the session (see Section 7 for a detailed explanation). As a result, we have two PET, one for the pre-activity and a second one for the post-activity. Hence, as an explanatory variable, we created a variable that it is a “Mean PET”, which was built by averaging the PET of each participant during the pre-activity Stroop game and the PET during the post-activity Stroop game.
3. Control variables: Socio-economic and demographic characteristics (represented by education, gender and health) and lifestyle characteristics of our participants (represented by isolation; use of AC at home and physically active) were our control variables (all binary variables).
14
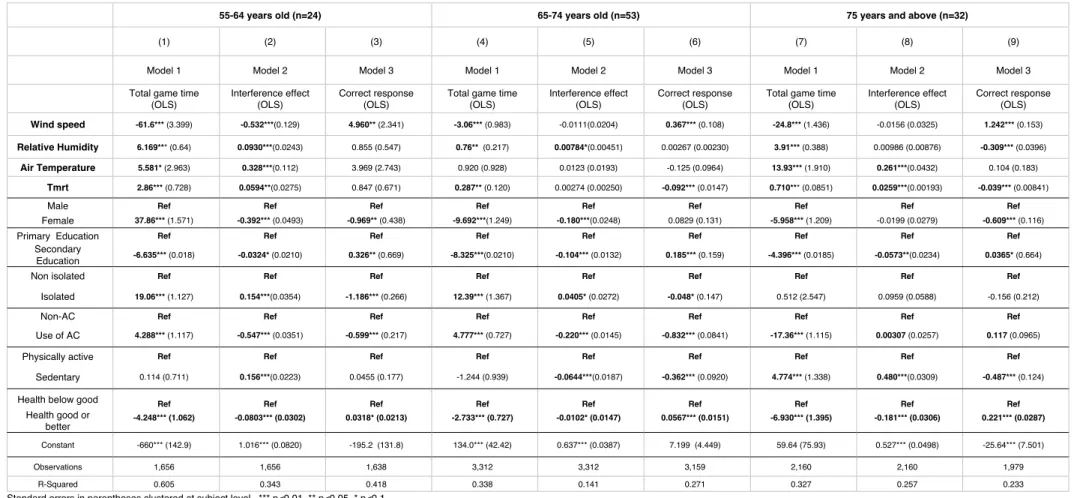
Table 4: OLS estimation on Total game time, Interference effect and Correct response. Covariates in the models: Climatic conditions, demographics and lifestyle characteristics. Regressions were done by age group.
55-64 years old (n=24) 65-74 years old (n=53) 75 years and above (n=32)
(1) (2) (3) (4) (5) (6) (7) (8) (9)
Model 1 Model 2 Model 3 Model 1 Model 2 Model 3 Model 1 Model 2 Model 3
Total game time (OLS)
Interference effect (OLS)
Correct response (OLS)
Total game time (OLS)
Interference effect (OLS)
Correct response (OLS)
Total game time (OLS)
Interference effect (OLS)
Correct response (OLS) Wind speed -61.6*** (3.399) -0.532***(0.129) 4.960** (2.341) -3.06*** (0.983) -0.0111(0.0204) 0.367*** (0.108) -24.8*** (1.436) -0.0156 (0.0325) 1.242*** (0.153) Relative Humidity 6.169*** (0.64) 0.0930***(0.0243) 0.855 (0.547) 0.76** (0.217) 0.00784*(0.00451) 0.00267 (0.00230) 3.91*** (0.388) 0.00986 (0.00876) -0.309*** (0.0396)
Air Temperature 5.581* (2.963) 0.328***(0.112) 3.969 (2.743) 0.920 (0.928) 0.0123 (0.0193) -0.125 (0.0964) 13.93*** (1.910) 0.261***(0.0432) 0.104 (0.183) Tmrt 2.86*** (0.728) 0.0594**(0.0275) 0.847 (0.671) 0.287** (0.120) 0.00274 (0.00250) -0.092*** (0.0147) 0.710*** (0.0851) 0.0259***(0.00193) -0.039*** (0.00841)
Male Ref Ref Ref Ref Ref Ref Ref Ref Ref
Female 37.86*** (1.571) -0.392*** (0.0493) -0.969** (0.438) -9.692***(1.249) -0.180***(0.0248) 0.0829 (0.131) -5.958*** (1.209) -0.0199 (0.0279) -0.609*** (0.116)
Primary Education Ref Ref Ref Ref Ref Ref Ref Ref Ref
Secondary
Education -6.635*** (0.018) -0.0324* (0.0210) 0.326** (0.669) -8.325***(0.0210) -0.104*** (0.0132) 0.185*** (0.159) -4.396*** (0.0185) -0.0573**(0.0234) 0.0365* (0.664)
Non isolated Ref Ref Ref Ref Ref Ref Ref Ref Ref
Isolated 19.06*** (1.127) 0.154***(0.0354) -1.186*** (0.266) 12.39*** (1.367) 0.0405* (0.0272) -0.048* (0.147) 0.512 (2.547) 0.0959 (0.0588) -0.156 (0.212)
Non-AC Ref Ref Ref Ref Ref Ref Ref Ref Ref
Use of AC 4.288*** (1.117) -0.547*** (0.0351) -0.599*** (0.217) 4.777*** (0.727) -0.220*** (0.0145) -0.832*** (0.0841) -17.36*** (1.115) 0.00307 (0.0257) 0.117 (0.0965)
Physically active Ref Ref Ref Ref Ref Ref Ref Ref Ref
Sedentary 0.114 (0.711) 0.156***(0.0223) 0.0455 (0.177) -1.244 (0.939) -0.0644***(0.0187) -0.362*** (0.0920) 4.774*** (1.338) 0.480***(0.0309) -0.487*** (0.124)
Health below good Ref Ref Ref Ref Ref Ref Ref Ref Ref
Health good or
better -4.248*** (1.062) -0.0803*** (0.0302) 0.0318* (0.0213) -2.733*** (0.727) -0.0102* (0.0147) 0.0567*** (0.0151) -6.930*** (1.395) -0.181*** (0.0306) 0.221*** (0.0287)
Constant -660*** (142.9) 1.016*** (0.0820) -195.2 (131.8) 134.0*** (42.42) 0.637*** (0.0387) 7.199 (4.449) 59.64 (75.93) 0.527*** (0.0498) -25.64*** (7.501)
Observations 1,656 1,656 1,638 3,312 3,312 3,159 2,160 2,160 1,979
R-Squared 0.605 0.343 0.418 0.338 0.141 0.271 0.327 0.257 0.233
Standard errors in parentheses clustered at subject level. *** p<0.01, ** p<0.05, * p<0.1
15
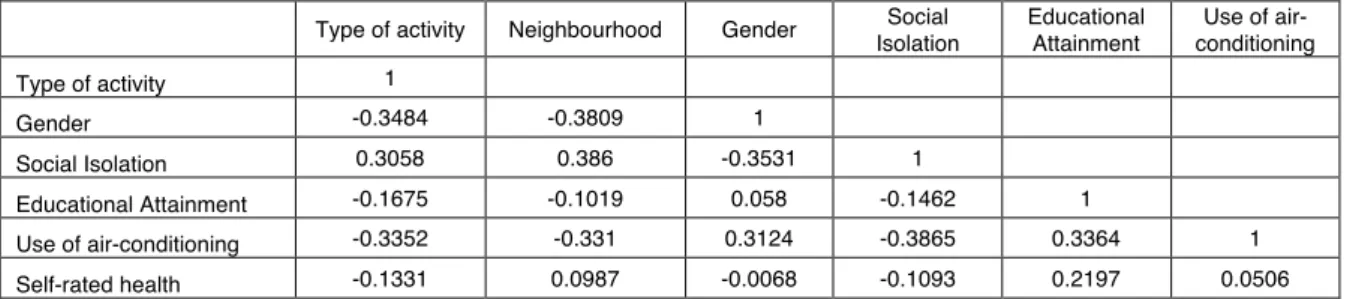
Table 5. Spearman correlation tests8
Type of activity Neighbourhood Gender Social Isolation
Educational Attainment
Use of air- conditioning
Type of activity 1
Gender -0.3484 -0.3809 1
Social Isolation 0.3058 0.386 -0.3531 1
Educational Attainment -0.1675 -0.1019 0.058 -0.1462 1
Use of air-conditioning -0.3352 -0.331 0.3124 -0.3865 0.3364 1
Self-rated health -0.1331 0.0987 -0.0068 -0.1093 0.2197 0.0506
Table 4 reports the results from OLS estimations on “Total game time”, “Interference effect” and “Correct responses”. Humidity, wind speed, air temperature and Tmrt are our key explanatory variables.
Additionally, we included in each OLS model socio-economic and demographic characteristics (i.e.
education, gender and health) and lifestyle characteristics of our participants (i.e. isolation; use of AC at home and physically active). We explored these determinants on the “Total game time”, “Interference effect” and “Correct responses” for each of the age groups separately. The results for the age group of 55-64 years old, 65-74 years old and 76 years and above are reported in Columns 1 to 3, Columns 4 to 6 and Columns 7 to 9, respectively.
Before including the socio-economic and demographic variables in our estimations, we tested for multi- collinearities. As the sociodemographic and lifestyle characteristics were weakly correlated (i.e.
coefficients of Spearman’s rho were lower than 0.5 and highly significant (p<0.05); see Table 5), they were included as covariates in the subsequent econometric analyses.
We present the results for each of our main explanatory variables in Table 4 as follows:
a) Wind Speed: Our results show that as wind speed increases, the coefficients for the “Total game time” decrease significantly and the coefficients for “Correct answers” increase significantly for all age groups. The coefficients for “Interference effect” are negative and significant for the groups 55- 64 years old and the 65-74 years old. This suggests that wind speed has a positive effect on the information processing time and attention span of all age groups and also a positive effect on the cognitive load of those under 75 years old. In particular, these effects were higher for younger older adults between 55-64 years old.
b) Relative Humidity: The coefficients for “Total game time” increase significantly as relative humidity increases for all age groups. This shows that the higher the relative humidity, the longer the processing time required. In addition, relative humidity has a negative impact on the attention span of older adults 75 years or older as the coefficient for “Correct response” is negative and
8All the coefficients of Spearman’s rho of Table 5 are highly significant (p<0.05).
16
significant for that age group. Furthermore, relative humidity also has a negative effect on the cognitive load of those under 75 years old.
c) Air temperature: The negative effects of air temperature are only observed among participants between 55-64 years old and those over 75 years-old. The higher the air temperature, the higher the coefficient for “Total response time” and “Interference effect” and these effects are significant.
This means that air temperature affects negatively the information processing time and cognitive load of older adults between 55-64 and 75 years and older. No significant effects are observed of air temperature on the “Correct responses” and so, on the attention span.
d) TMRT : We observe that as Tmrt increases, the coefficients for “Total game time” increase significantly for all age groups. This shows that Tmrt seems to have a detrimental effect on the information processing time of older adults. Additionally, Tmrt has a negative and significant effect on the coefficient for “Correct response” and “Interference effect” among participants 75 years or older. This suggests that Tmrt, apart from the information processing speed, also impacts the attention span and cognitive load of the oldest group.
We also explore in Table 4 the role of demographic, socio-economic and lifestyle characteristics of our participants on “Total time response”, “Interference effect” and “Correct responses”. The results are described as follows:
a) Gender: Across all three age groups, older female adults experienced a higher “Total response time”, compared with older male adults (the reference group). However, older female adults presents a lower “Interference effect” for those between 55 and 74 years-old compared with their male counterparts.
b) Education: The level of educational attainment is noted to have a positive effect on “Total game time”, “Interference effect” and “Correct answer” across the age groups. The coefficients for
“Secondary Education” are negative and significant for “Total game time” and “Interference effect”
and positive and significant for “Correct answers” across all age groups compared with those with only a “Primary Education” (the reference group). This result suggests that participants with secondary school education presented a shorter information processing time and a better attention span, and so an overall higher cognitive performance, than those who with primary school or below levels of educational attainment.
17
c) Isolation: We also evaluated whether isolation could affect cognitive performance of older adults when outdoors. The coefficient for “Isolated” is positive and significant for “Total game time” for those between 55 -74 years old compared with the “Non isolated” (the reference group), while
“Isolated” is negative and significant for “Correct response” only for those between 55-64 years old. This means that social isolation has a negative impact on the information processing time and attention span of older adults between 55 and 74 years old. However, the detrimental effect of isolation on the overall cognitive performance seems to affect the youngest older adults the most, i.e., those between 55 and 64 years old.
d) Use of Air-Con at home: Participants between 55-64 years old that use air-conditioning (AC) at home presents an overall lower cognitive performance than those who do not have AC (the reference group). AC usage also affects negatively the information processing time on those 75 years and older.
e) Physical activity: Older adults over 64 years old who engage in sedentary activities seem to have a shorter attention span and higher cognitive load than those who are more physically active (the reference group).
f) Stated health: Lastly, older adults of all age groups who were optimistic about their health status (“Health good or better”) seem to have a significant lower “Total response time”, lower “Interference effect” and a higher “Correct response” compared with those who declared to have a” Health below good” (the reference group).
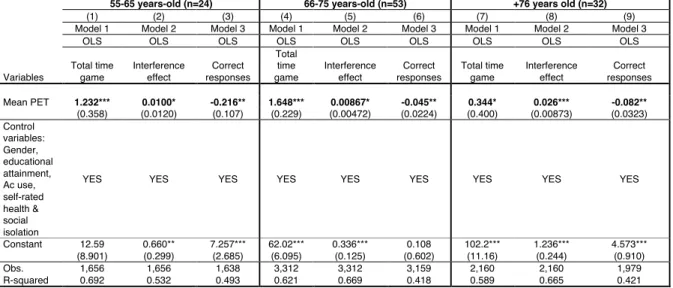
Table 6 describes the results of using the PET index to predict older adults’ cognitive performance9. We used as our main explanatory variable the “Mean PET”, that as explained above, it was built by averaging the PET of each participant during the pre-activity Stroop game and the PET during the post- activity Stroop game.
The PET index was measured in degrees Celsius. The higher the PET index, the lower the outdoor thermal comfort. In Table 6, we incorporated “Mean PET” as a covariate to capture the effect of the decreasing thermal comfort on the cognitive performance of the participants. Here again, as in Table 4, our dependent variables are “Total time game”, “Interference effect” and “Correct responses”. The effects of “Mean PET” on each of our dependent variables were calculated for each age group separately.
9Refer to glossary in section 7 for further explanation and calculation.
18
We also added sociodemographic and lifestyle variables as control variables. These variables are the same as in Table 4 (i.e. gender, educational attainment, AC use, self-rated health and social isolation).
However for simplicity, we do not show the coefficients as their effect on the dependent variables are the same as the ones displayed in Table 4.
Table 6. Effect of PET on older adults’ cognitive performance. OLS regressions on total time game, interference effect and correct answers. By age group
Our results from Table 6 suggest that:
a) Mean PET: The coefficients for “Total time game” and Interference effect” are positive and significant while the coefficients for “Correct responses” are negative and significant for all the age groups. This means that as PET increases (and so the thermal comfort decreases), the information processing time and cognitive load increase while attention span decreases. This result suggests that outdoor thermal comfort has a positive effect on the overall cognitive performance of older adults over 55 years-old.
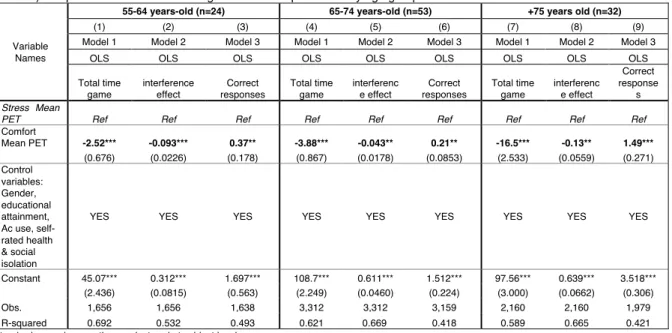
Table 7 displays a further analysis to confirm the effect of outdoor thermal comfort on older adults’
cognitive performance. We used Heng and Chow (2019)’s findings that a PET ranging between 21.1°C and 31.1°C was considered thermally comfortable for Singapore, while a PET of above 31.1°C is considered thermally stressful. In Table 7, we measure the effect of “Comfort Mean PET” (i.e. mean PET ranging between 21.1°C and 31.1°C; the reference) on older adults’ cognitive performance compared to a “Stress Mean PET” (i.e. mean PET above 31.1°C). Therefore, this analysis explores the effects on our three response variables when participants were in a “Comfort mean PET” range as compared to participants who were in a “Stress mean PET” range.
Variables
55-65 years-old (n=24) 66-75 years-old (n=53) +76 years old (n=32)
(1) (2) (3) (4) (5) (6) (7) (8) (9)
Model 1 Model 2 Model 3 Model 1 Model 2 Model 3 Model 1 Model 2 Model 3
OLS OLS OLS OLS OLS OLS OLS OLS OLS
Total time game
Interference effect
Correct responses
Total time game
Interference effect
Correct responses
Total time game
Interference effect
Correct responses
Mean PET 1.232*** 0.0100* -0.216** 1.648*** 0.00867* -0.045** 0.344* 0.026*** -0.082**
(0.358) (0.0120) (0.107) (0.229) (0.00472) (0.0224) (0.400) (0.00873) (0.0323)
Control variables:
Gender, educational attainment, Ac use, self-rated health &
social isolation
YES YES YES YES YES YES YES YES YES
Constant 12.59 0.660** 7.257*** 62.02*** 0.336*** 0.108 102.2*** 1.236*** 4.573***
(8.901) (0.299) (2.685) (6.095) (0.125) (0.602) (11.16) (0.244) (0.910)
Obs. 1,656 1,656 1,638 3,312 3,312 3,159 2,160 2,160 1,979
R-squared 0.692 0.532 0.493 0.621 0.669 0.418 0.589 0.665 0.421
Standard errors in parentheses clustered at subject level.
*** p<0.01, ** p<0.05, * p<0.1
19
Our results, following Table 7, suggest that:
a) Comfort Mean PET: The coefficient for “Comfort Mean PET” is negative and significant for
“Total time game” and “Interference effect” while it is positive and significant for “Correct responses” for all age groups. This means that participants in a comfortable mean PET zone exhibited better cognitive performance than those in a stressful mean PET zone. This result is consistent with the ones derived from Table 6 and confirms that the lower the OTC, the lower the overall cognitive performance.
Table 7. OLS regressions on meantime per “total time game”, “interference effect” and “correct answers”. Comfort PET (proxy for OTC) compared with Stress PET. Regressions were performed by age group.
Variable Names
55-64 years-old (n=24) 65-74 years-old (n=53) +75 years old (n=32)
(1) (2) (3) (4) (5) (6) (7) (8) (9)
Model 1 Model 2 Model 3 Model 1 Model 2 Model 3 Model 1 Model 2 Model 3
OLS OLS OLS OLS OLS OLS OLS OLS OLS
Total time game
interference effect
Correct responses
Total time game
interferenc e effect
Correct responses
Total time game
interferenc e effect
Correct response
s Stress Mean
PET Ref Ref Ref Ref Ref Ref Ref Ref Ref
Comfort
Mean PET -2.52*** -0.093*** 0.37** -3.88*** -0.043** 0.21** -16.5*** -0.13** 1.49***
(0.676) (0.0226) (0.178) (0.867) (0.0178) (0.0853) (2.533) (0.0559) (0.271)
Control variables:
Gender, educational attainment, Ac use, self- rated health
& social isolation
YES YES YES YES YES YES YES YES YES
Constant 45.07*** 0.312*** 1.697*** 108.7*** 0.611*** 1.512*** 97.56*** 0.639*** 3.518***
(2.436) (0.0815) (0.563) (2.249) (0.0460) (0.224) (3.000) (0.0662) (0.306)
Obs. 1,656 1,656 1,638 3,312 3,312 3,159 2,160 2,160 1,979
R-squared 0.692 0.532 0.493 0.621 0.669 0.418 0.589 0.665 0.421
Standard errors in parentheses clustered at subject level.
*** p<0.01, ** p<0.05, * p<0.1
5 Conclusion
This pilot study analyses the effect of OTC and individual climatic conditions on older adults’ cognitive performance in tropical Singapore.
Our analysis concludes that at a lower OTC, a lower overall cognitive performance was observed.
Interestingly, this effect was more pronounced on those older adults between 55 and 74 years old. It is worth to note that those between 55-64 years old are currently economically productive and so, they continue to contribute to the workforce and the economy of Singapore. A lower cognitive performance could impact on their productivity and potentially, affect their well-being in the short and long term.
Further results indicate that higher wind speed leads to higher cognitive performance (represented by attention span, cognitive load and information processing time) of older adults, particularly of those
20
between 55-64 years old. Meanwhile, higher relative humidity, Tmrt and air temperature increase the information processing time and cognitive load and reduced the attention span, resulting in an overall lower cognitive performance of all older adults. The results suggest that wind speed seems to be the most related to cognitive performance among older adults. The rest of the climatic conditions evaluated presented a negative effect on the cognitive performance. The most detrimental seems to be relative humidity, followed by air temperature and Tmrt.
Furthermore, the examination of sociodemographic characteristics unveiled the relationships between educational attainment, social isolation and physically active lifestyle with older adults’ cognitive performance. Educational attainment and health was positively related with the cognitive performance of older adults. Socially isolated participants were observed to have poorer cognitive performance, suggesting that social isolation might be a risk factor and contributor towards the decline in cognitive performance (Cacioppo & Hawkley, 2009). This effect was particularly observed in the youngest group between 55-65 years old. This further emphasizes the importance of older adults’ physical and social participation since early age to maintain their cognitive well-being.
In conclusion, our findings suggest that cognitive performance was related to OTC, in addition to socio- economic, demographic and lifestyle characteristics of older adults. Thus, it is important to consider these factors when designing and implementing mitigations and adaptation measures aimed to preserve cognitive performance of older adults in Singapore.
6 Future steps
Our results are important as they show factors that matter for older adults’ cognitive performance.
Preserving their cognitive performance might reduce the overall vulnerability of this group and increasing its well-being.
However, this study only provides an early indication about the potential impact of OTC and outdoor climatic conditions on older adults in Singapore. More comprehensive studies would be needed to assess the economic (e.g. by analysing loss in productivity), social and health impacts on older adults related to low OTC combined. More data is needed for other areas of Singapore to identify and map groups with different degrees of vulnerability (e.g. by level of OTC and/or social isolation). Furthermore, analyses on the effect of OTC on cognitive performance, as well as on health and productivity, for other vulnerable groups (like children or outdoor workers) should also be undertaken. Finally, potential measures that could contribute to the preserving of vulnerable groups’ cognitive performance need be designed, tested and evaluated. These analyses could be important to generate policy recommendations and more informed decision making.
21
7 Glossary
7.1 Acronyms used
CBD Central Business District
OTC Outdoor Thermal Comfort
PET Physiological Equivalent Temperature
T
mrtMean Radiant Temperature
OLS Ordinary Least Square
7.2 Definition of key terms used
Older Adults
For the purpose of this study, older adults are defined as adults aged 55 years and above. This includes the baby boomer generation (adults born between 1956-1965) which constitute a significant proportion of the baby-boomer generation. In line with other psychological studies, older adults were subdivided into three groups: 1) 55-64 years old , 2) 65-75 years old, and 3) 75 years and above (Cornwell & Waite, 2009).
Climatic Conditions
1. Relative humidity
Relative humidity refers to the percentage of moisture in the air relative to the total amount of moisture the air.
2. Wind speed
Wind speed refers to the rate at which air is moving and it is measured in terms of miles per hour (m/h).
3. Air temperature
Air temperature refers to the measure of how hot or cold the air is. Using the kestrels, air temperature reading is measured in terms of degree Celcius (°C).
4. Mean radiant temperature (Tmrt)
22
Tmrt summarizes the effects of heat fluxes that reaches the human body (Kantor & Unger, 2011).
The globe temperature measurements captured on-site will be first transformed into an outdoor mean radiant temperature that reflects the amount of heat fluxes experienced. The transformed mean radiant temperature (Tmrt) formula (ISO, 1998) is found below:
!!"#= #$%$+ 273*%+1,1 ∗ 10&∗ /'(.*
0$∗ 1(.% (%$− %'4
+
%− 273
Where %$ = Globe Temperature (°C);
/a = Wind Speed at the level of the globe;
%'. =Air Temperature
Globe temperature assesses a combination of solar radiation, air temperature and wind spend on human comfort. It is measured in terms of degree Celcius (°C).
Physiological Equivalent Temperature (PET)
PET is defined as “the equivalent temperature to air temperature in which in a reference environment, the thermal balance and the skin and the core temperatures are the same of that found in the environment” (Hoppe, 1999). Adapted from the Munich Energy-Balance model, PET integrates the complex thermal conditions in an outdoor environment with his/her experiences indoor. The calculation of each participant’s PET includes three parameters: physical constraints, personal variables and climate variables. Physical constraints consist of blood density, blood specific heat, air specific heat, skin emissivity, clothing emissivity and latent heat of evaporation. Personal variables include the age, sex, weight, height, metabolic activity level and the clothing level of the participants. Climatic variables refer to air temperature, air relative humidity, wind speed and Tmrt.
Cognitive Performance
For the purpose of this study, cognitive performance is defined as the information processing time, cognitive load and attention span of each participant. Cognitive performance is commonly assessed using a Stroop game.
1. The “Total response time” taken to by a participant to finalise in the Stroop games session, wherein a lower time taken reflects a faster processing speed. This means that “total response time” is a proxy for information time or speed.
2. The “Interference effect” is calculated by the difference in mean response time between the set of congruent and incongruent questions in a Stroop game. A lower interference effect indicates
23
smaller cognitive differences in responding to congruent and incongruent questions. This variable is a proxy for Cognitive load. Cognitive load is the intensity of effort required by individuals in completing the task assigned (Paas et al., 2003).
3. “Correct response” refers to the accuracy of the response by participants as they engage in the Stroop game session and is assessed by the number of correct responses. This variable is a proxy for attention span. A better attention span is indicated by a higher number of correct responses.
24
8 References
Cacioppo, J. T., & Hawkley, L. C. (2009). Perceived social isolation and cognition. Trends in cognitive sciences, 13(10), 447-454.
Cornwell, E. Y., & Waite, L. J. (2009). Measuring social isolation among older adults using multiple indicators from the NSHAP study. Journals of Gerontology Series B: Psychological Sciences and Social Sciences, 64(suppl_1), i38-i46.
Deb, C., & Ramachandraiah, A. (2010). The significance of physiological equivalent temperature (PET) in outdoor thermal comfort studies. Int J Eng Sci Technol, 2(7), 2825-2828.
Glisky, E. L. (2007). Changes in Cognitive Function in Human Aging. In D. R. Riddle (Ed.), Brain Aging: Models, Methods, and Mechanisms. CRC Press/Taylor & Francis.
Hancock, P. A., Ross, J. M., & Szalma, J. L. (2007). A meta-analysis of performance response under thermal stressors. Human factors, 49(5), 851-877.
Heng, S. L., & Chow, W. T. (2019). How ‘hot’is too hot? Evaluating acceptable outdoor thermal comfort ranges in an equatorial urban park. International journal of biometeorology, 63(6), 801-816.
Holowatz, L. A., & Kenney, W. L. (2010). Peripheral mechanisms of thermoregulatory control of skin blood flow in aged humans. Journal of applied physiology, 109(5), 1538-1544.
Holowatz, L. A., Thompson-Torgerson, C., & Kenney, W. L. (2010). Aging and the control of human skin blood flow. Frontiers in bioscience: a journal and virtual library, 15, 718.
Höppe, P. (1999). A universal index for the assessment of the thermal environment–the physiological equivalent temperature PET. In Proceedings of the 15th International Congress of Biometeorology and International Conference on Urban Climatology, Sydney, ohne Seitenangabe.
Lubben, J., Blozik, E., Gillmann, G., Iliffe, S., von Renteln Kruse, W., Beck, J. C., & Stuck, A. E. (2006). Performance of an abbreviated version of the Lubben Social Network Scale among three European community-dwelling older adult populations. The Gerontologist, 46(4), 503-513.
MacLeod, C. M. (2010). Stroop effect. The Corsini Encyclopedia of Psychology, 1-2.
Meterological Service Singapore (2020). 2019 Climate and Weather: The Year in Review. Retrieved from http://www.weather.gov.sg/climate-annual-climate-reports/.
Moyen, N. E., Ellis, C. L., Ciccone, A. B., Thurston, T. S., Cochrane, K. C., Brown, L. E., ... & Judelson, D. A.
(2014). Increasing relative humidity impacts low-intensity exercise in the heat. Aviation, space, and environmental medicine, 85(2), 112-119.
Murman D. L. (2015). The Impact of Age on Cognition. Seminars in hearing, 36(3), 111–121.
Myagmarjav, Sugarmaa, Denise Burnette, and Frank Goeddeke Jr. "Comparison of the 18-item and 6-item Lubben Social Network Scales with community-dwelling older adults in Mongolia." PloS one 14.4 (2019):
e0215523.
Paas, F., Renkl, A., & Sweller, J. (2003). Cognitive load theory and instructional design: Recent developments. Educational psychologist, 38(1), 1-4.
Piil, J. F., Christiansen, L., Morris, N. B., Mikkelsen, C. J., Ioannou, L. G., Flouris, A. D., ... & Nybo, L. (2020).
Direct exposure of the head to solar heat radiation impairs motor-cognitive performance. Scientific Reports, 10(1), 1-10.
Stern, Y. (2002). What is cognitive reserve? Theory and research application of the reserve concept. Journal of the international neuropsychological society, 8(3), 448-460.
Trezza, B. M., Apolinario, D., de Oliveira, R. S., Busse, A. L., Gonçalves, F. L. T., Saldiva, P. H. N., & Jacob-Filho, W. (2015). Environmental heat exposure and cognitive performance in older adults: a controlled trial. Age, 37(3), 43.
Wright Beatty, H. E., Keillor, J. M., Hardcastle, S. G., Boulay, P., & Kenny, G. P. (2015). Preservation of cognitive performance with age during exertional heat stress under low and high air velocity. BioMed research international, 2015.