Research Collection
Report
Outdoor thermal comfort acceptability calibration
A calibration of the PET outdoor thermal comfort index in Singapore: does comfort vary respect to land uses?
Author(s):
Kohler, Manon; Philipp, Conrad H.
Publication Date:
2020-08-05 Permanent Link:
https://doi.org/10.3929/ethz-b-000432324
Rights / License:
In Copyright - Non-Commercial Use Permitted
This page was generated automatically upon download from the ETH Zurich Research Collection. For more information please consult the Terms of use.
ETH Library
DELIVERABLE TECHNICAL REPORT
Version 05/08/2020
D 2.2 – Outdoor thermal comfort acceptability calibration
Project ID NRF2019VSG-UCD-001
Project Title Cooling Singapore 1.5:
Virtual Singapore Urban Climate Design
Deliverable ID D2.1 – Outdoor thermal comfort acceptability
calibration
Authors Dr. Manon Kohler
Dr. Conrad H. Philipp
DOI (ETH Collection) 10.3929/ethz-b-000432324
Date of Report 05/08/2020
Version Date Modifications Reviewed by
1 21/05/2020 Version 1 Prof. Dr. Winston T.L. Chow 2 27/07/2020 Version 2 Prof. Dr. Leslie K. Norford 3 04/08/2020 Version 3 Prof. Dr. Leslie K. Norford
DELIVERABLE TECHNICAL REPORT Version 05.08.2020
2
Table of contents
Abstract ……… 3
1. Introduction ………. 3
2. The case study area and method ……… 6
2.1. Tanjong Pagar – a residential and commercial central district ………... 6
2.2. Instrumentation ………... 8
2.3. The Tanjong Pagar OTC campaign ……….. 11
2.4. The Duxton OTC campaign ……… 15
2.5. Computation of the PET heat stress index and determination of the OTC acceptability scale …17 3. Results ……….. 18
3.1. The OTC perception ranges ……….. 18
3.2. Changes of OTC acceptability ranges with age ………... 29
4. Conclusions ………... 31
4.1. Summary of findings ……… 31
4.2. Limitations ………. 33
Annex ………... 38
DELIVERABLE TECHNICAL REPORT Version 05.08.2020
3
Abstract
This report presents the outcome of two biometeorological campaigns aiming to calibrate the Physiological Equivalent Temperature heat stress index (PET) locally against individual thermal perception. PET is widely used in evaluations of heat mitigation strategies. The study also aspired to determine whenever differences in individual thermal sensitivity exist between a commercial and a residential area, and a fortiori a pocket urban park.
The campaigns took place during the 2018 and 2019 wet and dry inter-monsoon periods and focused on the Tanjong Pagar mixed-use downtown precinct. The results revealed a significant seasonality in the individual thermal sensitivity and high spatial variations that are recommended to be taken into account when assessing OTC site performance. Surprisingly the pocket urban park presents poor OTC performance compared to the other built-up commercial sites. It can be attributed to the lack of sun shelter at noon despite its green nature.
1. Introduction
In “Tool comparison for urban microclimate modelling”1 (Sukma et al., 2020), the authors explained ways to assess Outdoor Thermal Comfort (OTC) performance of selected heat mitigation urban designs through modelling the Physiological Equivalent Temperature index (PET, Matzarakis & Mayer 1996;
Mayer H. & Höppe 1987). For every PET intensity and following Nazarian et al. (2019) the authors attributed scores whenever PET falls within the “comfortable” (“acceptable”) thermal sensation category cut-offs, as determined by a given thermal sensation scale shown in Table 1.
A “comfortable” range of OTC is defined physically as an energy equilibrium state of the human body at which thermoregulation is achieved with minimum metabolic rate and in the absence of evaporative cooling (Perlstein 1995). The associated PET temperature for which a subject feels neither warm nor cold is the “neutral temperature”. For many years, a universal OTC scale was commonly accepted, stating that all humans with a same body core temperature (37-38 °C) have the same adaptation capacities to heat and thus same neutral temperature (Potchter et al., 2018). Hence, the thermal sensation scale in Table 1 was used over a great variety of climates without any modifications until the work of Nikolopoulou et al., (2001), Filingeri & Havenith (2015) and Kántor et al., (2016). These authors stressed the greatest influence of human factors in the OTC scale, expressing in OTC states of acceptable and neutral temperatures the socio-cultural background of the individuals and their learning experiences (e.g. thermal history and preferences, sense of place). They demonstrated that the psychological factors can explain up to 50% of the OTC perception variability, with the heat stress
1 CS 1.5 technical report D1.2.4.1
DELIVERABLE TECHNICAL REPORT Version 05.08.2020
4 explaining the remaining share. Therefore, not only the sole ability of people to dissipate excess heat through conduction, convection, respiration and sudation explains OTC. Acknowledging this, they also recommended to calibrate the OTC scale locally through mixed-method approaches, in which subjective evaluations of a given site’s thermal condition is concurrently compared with objective meteorological measurements needed to compute an heat stress index like PET (ANSI/ASHRAE Standard 55, 2010). The subjective evaluation is made usually on a scale from -3 to 3 for reporting thermal sensation, but it can also be extended in the literature from -4 to 4 as shown in Table 1.
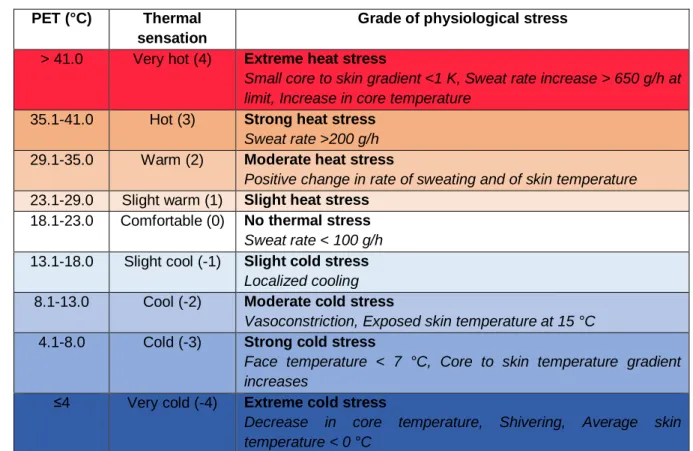
Table 1. The OTC scale: PET related thermal sensation scales (Matzarakis and Mayer, 1996; Oke 2017)
PET (°C) Thermal sensation
Grade of physiological stress
> 41.0 Very hot (4) Extreme heat stress
Small core to skin gradient <1 K, Sweat rate increase > 650 g/h at limit, Increase in core temperature
35.1-41.0 Hot (3) Strong heat stress Sweat rate >200 g/h 29.1-35.0 Warm (2) Moderate heat stress
Positive change in rate of sweating and of skin temperature 23.1-29.0 Slight warm (1) Slight heat stress
18.1-23.0 Comfortable (0) No thermal stress Sweat rate < 100 g/h 13.1-18.0 Slight cool (-1) Slight cold stress
Localized cooling 8.1-13.0 Cool (-2) Moderate cold stress
Vasoconstriction, Exposed skin temperature at 15 °C 4.1-8.0 Cold (-3) Strong cold stress
Face temperature < 7 °C, Core to skin temperature gradient increases
≤4 Very cold (-4) Extreme cold stress
Decrease in core temperature, Shivering, Average skin temperature < 0 °C
Thus, the need to calibrate OTC scales to local contexts is important, giving the potential for individuals to effect psychological, physiological and behaviour changes in adapting to different climates. PET calibration studies are quite limited in the tropics yet (Binarti et al., 2020). In Singapore, we tallied two studies. Yang et al. (2013), in line with the universal vision theory of OTC, determined a unique thermal sensation scale from aggregation of 13 different urban types (six large parks, two central squares, two busy shopping streets, two campus sites, and an entertainment area). In a different study (Chow et al., 2016; Heng and Chow, 2019) the OTC scale of the Singapore Botanic Gardens was established for given context-related high thermal perception variations with urban spaces.
DELIVERABLE TECHNICAL REPORT Version 05.08.2020
5 Thermal sensitivity changes between acclimatized and non-acclimatized individuals were noted. Their neutral temperature of 26.6 °C was -2 °C lower than the precedent study, while the lower and upper cut-offs of the slight cold and slight warm sensations were, respectively, - 2.4 °C lower and + 1.6 °C higher. Their results suggest, therefore, significant variation of OTC scales over urban land covers and wider thermally acceptable ranges in green areas compared to the other land uses. Comparisons of the OTC scales between the studies are potentially hazardous due to the influence of context-related factors (survey population sample size, sensor accuracy) and the statistical inferential methods Krüger et al., 2017; Potchter et al., 2018; Johansson et al., 2014). However, a recent review of biometeorological studies and PET calibration campaigns in tropical regions outlined additionally neutral temperatures quasi-invariantly centered at 30 °C but variable upper and lower bounds of OTC acceptability ranges (Binarti et al., 2020). There is hence a need to standardize the calibration approaches (same use of sensor) and calibrate OTC scales adequately for suitable climate and land use/land covers (e.g. high-rise or low-rise residential, commercial or industrial areas etc.).
In this work we aim to establish the OTC acceptability scale in different urban types in Singapore. We followed a case study approach in the Tanjong Pagar central district area. We posited that ambient microscale climate influences OTC differently vis-à-vis the function of the public space (residential vs.
commercial vs. urban park).
In total, two OTC perception campaigns were conducted: the first in the Tanjong Pagar area (including the Tanjong Pagar plaza, Duxton Plain park and Craig Street), and the second in the residential Duxton Plain area (Duxton Plain park only). The survey took place in the inter-monsoon seasons and some subtle differences were set because the sensors in the second campaign (Duxton Plain area) were of higher quality. We then retrieved the intensity of the relationship between the measured PET and the surveyed thermal sensations. The obtained OTC scales were then compared between the different sites and campaigns and with established literature (e.g. Heng and Chow 2019).
A description of the case study area and methodology can be found in Section 2. Section 3 discusses the results of the calibration exercise and Section 4 concludes the findings.
DELIVERABLE TECHNICAL REPORT Version 05.08.2020
6
2. The case study area and method
2.1. Tanjong Pagar – a residential and commercial central district
Tanjong Pagar is located within a historical quarter, downtown Singapore, approximately 1 km from the South container-handling harbour (Figure 1).
Figure 1. Tanjong Pagar, an historical and modern district close to the coast
It is characterized by a mix of landuses, reflected in its architecture by a combination of pre-1945 shop- houses of about 10 m height with modern high-rise residential public housing, and commercial skyscrapers typically at 240-290 m heights. Following the local climate zone classification meant for a homogeneous area of more than a square kilometre (Bechtel et al., 2015), the area is LCZ 1 (Compact High Rise). Yet at the district scale following a north-south gradient, we observed a mix of LCZ 1 (Compact High Rise), 2 (Compact mid-rise) and 10 (Heavy industry) with the container harbour 1 km south of the study area.
DELIVERABLE TECHNICAL REPORT Version 05.08.2020
7 Figure 2. Tanjong Pagar, a historical and modern district close to the coast
The area is rather busy in terms of human activity and movement. With fifty four different bus routes and three taxi stands, the area is a major public transport hub (https://landtransportguru.net/tanjong- pagar-station/). Public transport data of movement in the area indicate between 36,900-40,700 daily counts during weekdays, on average.
The dynamism of the area is also mirrored by its residents aged in majority 35-49 years old and young senior aged between 65-70 years old (Singstat, 2016), but also by the high level of amenities and services located in the neighbourhood. Along with every-day services (bank, hawkers, grocery shops), the district also provides its visitors with several terrace restaurant streets, hotels, and independent start-up companies and also state-level institutions and international company headquarters (Urban Redevelopment Authority and Monetary Authority of Singapore headquarters, and BBDO advertising agency). With a low share of public houses compared to private properties and a median rent which is one of the priciest in the island, Tanjong Pagar can be considered a more commercial and administrative district than a residential area (Property Guru, 2018). The Tanjong Pagar area also experiences a land-sea breeze regime due to its proximity to the coast. Previous research close to the area shows it is subject to a strong heat island effect of about 3 °C in average (Chow and Roth 2006).
DELIVERABLE TECHNICAL REPORT Version 05.08.2020
8
2.2. Instrumentation
Estimating PET requires measurements of four climate variables: microscale air temperature, humidity, wind speeds, as well as, short- and long-wave radiation received on bodies and originating from both the sun and the immediate surfaces. The last term can be ascertained by the temperature on a globe thermometer.
We deployed two sets of meteorological instruments. The first set of sensors consisted of four Kestrel 5400 portable Heat Stress Trackers. These sensors had thermocouples measuring air temperature and humidity, and a propeller anemometer to document wind-speed. The Kestrel 5400 had a built-in 25 mm diameter copper globe (painted black) to measure globe temperatures and to be able to compute the mean radiant temperatures, i.e. the energy exchanges between an individual and its surrounding surfaces through radiative transfer. The sensors were mounted on a tripod at 1.1 m above ground level (a.g.l., ISO 7726:2002) to be used during the Tanjong Pagar 2018-2019 inter-monsoon campaigns that focused on the OTC acceptability ranges of the residential and commercial land uses.
The second set consisted of four Vaisala WXT536 instruments combined with four Campbell Scientific 15.2 cm globe thermometers, also used for the computation of the mean radiant temperature. It was deployed within the Duxton park (same land use, different urban designs) during the 2019 wet inter- monsoon OTC campaign. The sensor specifications can be seen in Table 2. Compared to the Kestrel, the meteorological system provides more accurate measurements, notably for the wind speed. The translation of ultrasound into an electric signal ensures faster sensor time responses compared to mechanical technologies which are dependent on a minimum wind speed to rotate the propellers. For the Kestrel, the minimum wind speed requirement to ensure reliable wind speed measurements is 0.8 m/s. Additionally, the air temperature and humidity probes were protected from the sun, as well as, rain droplets by a shield and a the globe temperature was directly measured in the case of the Vaisala system, while it is further interpolated in the Kestrel from the 2 cm globe to the standard 15 cm black globe (no display of the interpolation equation by the company). Coupled to a data logger, the Vaisala system enabled storage of larger meteorological records compared to the Kestrel, which has a storage capacity limited to 10,000 data sets taking records with one-minute resolution, the Kestrels provide an autonomy of 16 h 40 min, need regular download of the data, and also more manpower since the sensors must be mounted and dismounted every day. In contrast, the Vaisala instruments were mounted on steel arms fixed to lampposts at 2.2 m a.g.l. in the Duxton Plain park after obtaining the research permit to the dedicated agency. They were powered with 12 AH batteries, and therefore had a longer autonomy (over a week).
DELIVERABLE TECHNICAL REPORT Version 05.08.2020
9 Although the 2.2 m height is not a standard in most OTC campaigns (normally 1.1 to 1.4 m to approximate the typical height of the human chest), pre-campaign tests had shown that the thermal environment within the street canyon of the park is quite homogeneous for air temperature, wind and humidity. However, globe temperature measurements can be affected by the sensor height through heterogeneous obstacle shading pattern. We therefore paid particular attention to properly set the globe thermometers respecting the sun site daily pattern (Annex 1). Table 2 documents the sensors specifications as per the manufacturer specifications.
Table 2. Accuracy of the sensors as given by the constructors
TANJONG PAGAR
Device Kestrel 5400 Uncertainties Resolution
Globe temperature (°C) Resistance inside a 25 mm black powder coated copper globe with conversion to a 150 mm standard globe.
+/- 1.4 0.1
Air temperature (°C) Thermocouple +/- 0.5 0.1
Relative humidity (%) Thermocouple +/- 2 % RH 0.1
Horizontal Wind speed (m/s) 2D vane propeller anemometer +/- 3 % 0.1
DUXTON PLAIN PARK
Device Campbell Uncertainties Resolution
Globe temperature (°C) Thermistor placed in a 152 mm black painted copper globe.
+/-0.3 ?
Device Vaisala WXT536 Uncertainties Resolution
Air temperature (°C) Capacitive ceramic sensor +/- 0.3 0.1
Air humidity (%) Conductivity between two polymer materials
+/- 3 % RH 0.1
Horizontal Wind Speed (m/s) Ultrasonic transducer +/- 3 % at 10 m/s
0.1 Wind direction (°) Ultrasonic transducer +/- 3 ° at 10 m/s 1
Precipitation Piezoelectrical sensors > 5 %,
f(weather)
0.01 mm
Each OTC campaign focused on the wet inter-monsoon while the Tanjong Pagar OTC campaign also targeted the dry inter-monsoon period to test seasonal differences. Both periods are usually characterized by light and variable winds (MSS 2019).
The campaign occurred on September 14, 19 and 25, 2018, September 9 and 11, 2019, as well as February 28, and March 1 and 3, 2019, in the Tanjong Pagar area (i.e. 8 days). The Duxton plain park was investigated on September 9, 10, 11, and 30, 2019, as well as, October 2 and 3(i. e. 6 days).
DELIVERABLE TECHNICAL REPORT Version 05.08.2020
10 During the campaign, we simultaneously administered a semi-structured survey including subjective thermal sensation and perception, as well as pertinent demographic profiles (gender, age, and health status). These were conducted over a radius of 1 to 3 metres away from the meteorological sensors to ensure that people feel the same environmental variables as measured at the location of the “interview”.
The survey was administered by the research team to randomly selected pedestrians over three time periods - 8:00-10:00 LT, 11:00-13:00 LT, and 16:30-18:30 LT - that corresponded to three major daily commuting periods. The thermal sensations were assembled using a modified version of the seven- point ASHRAE thermal scale, where the “neutral” sensation, a satisfaction opinion, was excluded (Tseliou et al., 2010; Veselý and Zeiler, 2014; Shahzad et al., 2018). There were several reasons for this choice:
First, a ‘sensation’ is a condition of mind expressing the person’s evaluation of his/her thermal environment, a conscious feeling that grades the actual thermal environment. It is not supposed to be reflective on the person’s physiology and does not grade the individual heat balance. ‘Comfort’
is a notion, in which a satisfaction is expressed with the environment. Considering a neutral sensation in the thermal sensation scale, where an individual feels “neither cold or warm”, imposes an introspective glance on the body core, skin temperatures and the existence of a zero in the thermal sensation graduation (non-monotonic OTC scale).
Second, one can be comfortable (“neither cold or warm”) in several thermal conditions depending on the time of the day, and not necessarily when the energy budget of the human body is zero.
Third, comfortable conditions have been defined based on a significant change in the sweat rate and mean skin temperature (Mayer H. & Höppe 1987), hence, referring to the warm category.
Lastly, rejecting the zero point forces people to take a decision on what they feel and avoid a common practice to always chose the middle point, the neutrality when answering a questionnaire in hurry, like our commuters. Other five-point sensation scales for humidity, wind, and sun were made for the remaining meteorological variables (Heng and Chow, 2019), and a four-point skin wetness perception scale was surveyed to measure the influence of each in the overall thermal sensations (Table 3).
DELIVERABLE TECHNICAL REPORT Version 05.08.2020
11 Table 3. Scales used for the subjective sensation assessment
TSV ASHRAE scale* Humidity Wind Sun Skin
-3 cold 0 very dry 0 no wind 0 no sun 0 none/dry
-2 cool 1 slightly dry 1 Very low wind 1 low sun 1 slightly moist -1 slight cool 2 slightly humid 2 Low wind 2 partly sunny 2 moderate moist
1 slight warm 3 humid 3 windy 3 sunny 3 profuse
2 warm 4 very humid 4 very windy 4 very sunny 3 hot
*Neutral option was removed
2.3 The Tanjong Pagar OTC campaign
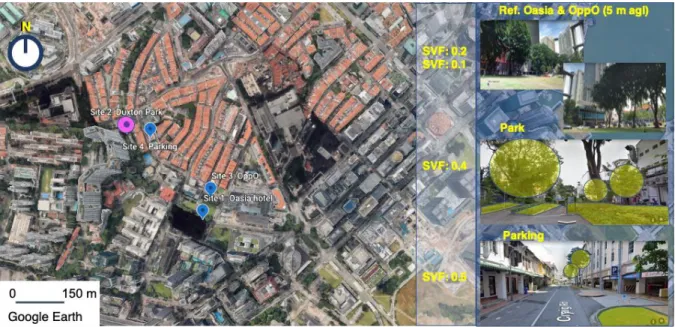
Four sites were selected in the Tanjong Pagar district (N 1° 16' 35.184", E 103° 50' 44.5596") with significant land cover differences with respect to their vegetation cover and pedestrian volume. To maximise the foot traffic of potential survey respondents, the sites were located along two major commuting routes to and from the Tanjong Pagar MRT station, a major public transportation node as described in 2.1.
Four stations were established. The Oasia station (about 5 m a.g.l; LCZ1 Compact high rise, https://wudapt.cs.purdue.edu), is set on a concrete path close to the Tanjong Pagar MRT station entrance A. Due to its orientation, the site was exposed to the sun in the afternoon, but shaded in the morning by the Oasia hotel (170 m height), as well as, rows of Robinia pseudoacacia L.mature street trees. The second, OppO station (LCZ1) is located directly opposite to Oasia. A small public square with well-maintained lawn separates the two stations. Shade is provided on the north side of this station by a row of Robinia pseudoacacia L. mature trees.
Two other stations are located 350 m away from Oasia and OppO. The first is the Duxton Park monitoring station (LCZ1-2) located along the North-South oriented Duxton Plain park corridor (10 m a.g.l.). The park is at the base of “the Pinnacle” HDB public housing complex (156 m height) and forms a popular venue for recreation of its residents. The pathway pavement at the site is rather wide and paved with light grey concrete materials. Surface vegetation is sparse, with a few young trees, (about 2.5 m) mixed with low-height low-density palm trees (Licuala garndis H., about 1.5 - 2 m), cover of cotoneaster horizontalis and ferns (Nephrolepis biserrata Sw.). The site is heavily exposed to the sun before noon and until 3 pm, but the whole afternoon shaded by the Pinnacle housing complex. The final Parking site is located on a road parallel to the park (Craig Street, LCZ2 Compact mid-rise).
DELIVERABLE TECHNICAL REPORT Version 05.08.2020
12 The public space is fringed by pre-1945 medium-rise shophouses of about 10 m height, as well as, modern constructions of about 33 m. The shade is provided via roofed continuous walkways in front of the shopfronts that are locally called “five-foot-ways”. The east sidewalk is also separated from generally light automobile traffic by a non-covered paved path, shaded until 1 pm, on which the sensors were sited. A strip of dry soil and sparse Cynometra browneoides mature trees (about 4 m height) provides irregular and little shade.
Figure 3. Locations of the monitored sites. The sky view factors (SVF) are computed following Lindberg and Holmer (2010).
The synoptic weather conditions during the eight fieldwork days were unusually dry with a particularly clear sky as reported in Changi, the mainland synoptic station (MSS 2019, 2020).
During the dry inter-monsoon (here in February and March), the rain was capitalized over 11 days according to the MSS historical daily records, while the average number of rainy days for February and March according to the 1981-2010 reference time serie is 21 (http://www.weather.gov.sg/climate- climate-of-singapore/). Total rainfall over February and March was 103.8 mm, though over 112.8 mm are expected in each month. Maximum and minimum air temperatures exceeded 34 °C and 26.2 °C, respectively, during several weeks, while they are generally 31.7 °C and 24.3 °C according to MSS and long-term average (MSS 2019). The air temperature was hence 1°C above the standard in Changi, and the local average and maximum air temperatures increased over the three days of the campaign, as measured in the four sites, reaching 36.3 °C in the Parking site. February and March 2019 ranked amongst the third warmest Februaries and March since 1929. The air moisture was decreasing along the three days by 2 hPa in all sites with the park being the driest in the four.
DELIVERABLE TECHNICAL REPORT Version 05.08.2020
13 The globe temperature was rising up from 32 °C at the start to 34.5 °C at the end of the OTC campaign.
A moderate sea breeze was noticed during the campaign with local measure of wind intensity of 3.8 m/s, well above the normal, more variable and weaker in Oasia and OppO than in the other sites.
Table 4. Meteorological conditions during the Tanjong Pagar OTC campaign.
Dry Inter-monsoon Wet inter-monsoon
Dates: February 28, and March 1 and 3, 2019 Dates: September 14, 19 and 25, 2018, September 9 and 11, 2019 Clear sky, breezy, dry air Clear sky, almost no wind, humid
Mean air temperature: 28.2 °C (ref. 27.1 °C)
Maximum air temperature: 32.4 to 34 °C (ref. 31.7 °C)
Minimum air temperature: 26.2 °C (ref. 24.3 °C)
Mean wind speed: 3.8 m/s
Daily rainfall: 0 to 0.2 mm (ref. 112.8 mm)
Mean air temperature: 28.4 °C (ref. 27.6 °C)
Maximum air temperature: 31.3 to 32.5 °C (ref. 31.4 °C)
Minimum air temperature: 24.7 to 26.4 °C (ref. 24.8 °C)
Mean wind speed: 2.2-3.2 m/s
Daily rainfall: 0 to 1.2 mm (ref. 5 mm)
In the wet inter-monsoon, the air temperature was +0.8 °C warmer and quite stable over the consecutive days except September 14, which was a bit warmer than the other days. The air moisture was increasing in contrast from 28.2 hPa to 31.5 hPa during the 2018 campaign in all sites. Light to no winds were reported in Changi. Total rainfall in September 2018 were round 144 mm in Changi for a standard being 171 mm. The minimum temperatures were 24.7 to 26.4 °C, +2°C warmer than usual. Locally, warmer conditions were observed in the most open sites: Duxton Park and Parking. The ambient humidity was the highest in the park. The wind intensity was rather strong for the season (2.2 to 3.2 m/s instead of <1.5 m/s) mainly south in Oasia and OppO and rather variable and lighter in the Parking and Duxton Park.
DELIVERABLE TECHNICAL REPORT Version 05.08.2020
14 Table 5. Surveyed population profiles per campaigns
Dry Inter-monsoon (NDry=222) Wet inter-monsoon (NWet=227) Gender
Men: 48 % / Women: 51%
Age:
21 to 35 yr. old: 51 %
36 to 50 yr. old: 28 %
51 to 65 yr. old: 13 %
Over 65 yr. old: 6 % Occupation:
Office worker: 67 %
Non office worker/Others: 14 %
Retired/Not working: 10 %
Students: 9 %
Gender
Men: 55 % / Women:45 % Age:
21 to 35 yr. old: 53 %
36 to 50 yr. old: 31 %
51 to 65 yr. old: 11 %
Over 65 yr. old: 5 % Occupation:
Office worker: 72 %
Non office worker/Others: 10 %
Retired/Not working: 10 %
Students: 8 %
Figure 4. Residence origins of the respondents
DELIVERABLE TECHNICAL REPORT Version 05.08.2020
15
2.4 The Duxton OTC campaign
The Duxton Plain Park Corridor (1°16’42°N, 103°50’29”E) offers three distinct landscapes along its North-South oriented grey paved path. The first is rather mineral with a large use of built-up materials (pavement, building façades) and is set in an asymmetrical street-canyon according to aspect ratios (α) as highlighted in Fig. 5 ( yellow lines). The path is 9.5 m wide and passes between the Pinnacle public housing buildings and the back of traditional shophouses along Craig Street. At the base of the path, next to the Pinnacle estate, there are a few prominent tropical trees (e.g. broad-leafed Mahogany,Indian rubber, Bodhi), shrubs (rhododendron, murraya paniculate) and some recreational spaces (e.g. a gym corner and some low concrete benches). Two meteorological stations were located there. Site 2 is common to the OTC Tanjong Pagar campaign, allowing comparisons between the thermal sensation scales obtained with the Kestrel and Vaisala instruments.
The second landscape in which measurements and surveys were conducted is greener and the street- canyon symmetrical in terms of aspect ratio: the path is narrower passing by the back of two rows of traditional shophouses. The grassy lawn on each side of the path is interspersed with a few palm trees of 12 m height. The third and final landscape (site 4) is shady as it is surrounded by dense foliage trees of 15 m height. Located closer to the Pinnacle entrance, Sites 1 and 2 had higher human foot traffic than sites 3 and 4.
DELIVERABLE TECHNICAL REPORT Version 05.08.2020
16 Figure 5. Location of the monitored sites in Duxton Plain Park. The sky view factors (SVF) are computed using Lindberg and Holmer (2010).
The six-day fieldwork conditions in September and early October 2019 were dry and warm. A cooler sea surface temperature and air mass blowing from Australia prevented rain cloud formation and the sky was clear. Over September, the average daily rainfall was 0.7 mm (ref. 5 mm). No rain was observed during the survey days. However, the burning of Sumatra and Borneo palm oil plantations imposed hazy conditions in October meaning that despite the clear initial sky, the air was progressively loaded with particle matters. In Changi, the mean temperature reached 28.9 °C, + 1.5 °C warmer than usual, and the maximum and minimum temperature were sometimes 4°C above the standard. However, the minimum temperature appeared - 2°C cooler than usual, leading to higher daily temperature amplitudes. There was almost no wind (1.5 to 5.2 m/s, Table 6). Locally, air temperatures ranged between 25 and 32 °C, relative air humidity varied between 68 and 81%, and globe temperatures between 23 and 50 °C. The daily variation of the globe temperature was reduced in the most shaded sites (1 and 4).
Table 6. Meteorological conditions during the Duxton OTC campaign.
Wet inter-monsoon
Dates: September 9, 10, 11, and 30 and 2, 3 October 2019 Clear sky, almost no wind at the sites, humid
Mean Air temperature: 28.9 °C (ref. 27.6 °C)
Maximum air temperature: 30.5 to 34.3 °C (ref. 31.4 °C)
Minimum air temperature: 22.9 to 27.6 °C (ref. 24.8 °C)
Mean wind speed: 1.5 to 5.2 m/s
Daily rainfall: 0.6 mm (ref. 5 mm)
References are taken from http://www.weather.gov.sg/climate-climate-of-singapore/
DELIVERABLE TECHNICAL REPORT Version 05.08.2020
17 Table 7. Surveyed population profile at Duxton and residence origin.
Wet inter-monsoon (N=371)
Residence geographic location of the respondents (Source: xy)
Gender
Men: 55 %
Women:45 % Age:
21 to 35 yr. old: 43 %
36 to 50 yr. old: 28 %
51 to 65 yr. old: 12 %
Over 65 yr. old: 17 % Occupation:
Office worker: 65 %
Non office worker/Others: 13 %
Retired/Not working: 18 %
Students: 4 %
2.5 Computation of the PET heat stress index and determination of the OTC acceptability scale
We input the air temperature, the water vapour pressure following equation 1 based on Vaisala (2013), the wind speed and the mean radiant temperature (TMRT) in the Rayman software (Matzarakis et al., 2010). The mean radiant temperature was derived from the globe temperature in situ observation using the Thorsson et al. (2006) mathematical formulation. The latter accounts for the biases induced by the globe dimension and the heat convection transfer at its surface on the radiative measurements. It is recognized to be one of the most influential parameter for OTC and PET (Kántor and Unger, 2011;
Thorsson et al. 2006).
𝑒
𝑤= 6.11 ∗ 10
[7.591386 𝑇𝑎 𝑇𝑎+240.7263](1)
where ew is the water vapour pressure at saturation for a given air temperature Ta
By default, PET considers the European clothing insulation and extra-metabolic activity of an individual performing light activities (0.9 clo and 80 Watts). PET is not sensitive to age, gender, size or height. It has been built for healthy non-acclimatized young man aged 35, 75 kg, and 1.75 m (VDI, 1998).
We then derived PET acceptability levels with the thermal sensation votes collected on the seven-point ASHRAE thermal sensation scale during the OTC campaign’s surveys. PET was regularly binned every 0.5 °C and analyzed with an Ordinary Least Square Regression (OLS), although other authors
DELIVERABLE TECHNICAL REPORT Version 05.08.2020
18 recommend the use of an ordinal logistic regression that is more adequate for categorical ordinal qualitative dependent variable (Sharim and Steemers 2020). The rationale of OLS is that the overall thermal discomfort sensation increases linearly close to neutrality (ambient temperature: 28-30 °C) and more rapidly from neutral to cold than neutral to warm with the skin temperature towards cold environments and increased sweating towards warm environments (Gagge et al., 1967; Wang et al., 2007). The choice of the regular bins was conditioned by the wish to standardize the method compared to Heng and Chow (2019) and its width based on the narrow PET statistical distribution in tropics.
All PET bounds have been associated with a confidence interval that represents the variations of the votes around a given PET intensity as in Fig. 6.
Figure 6. Example of an OLS fit model obtained between the median thermal sensation votes and PETs in Oasia (Wet inter-monsoon). LB and UB stands for lower and upper bounds for a given thermal sensation considering a confidence interval (CI) of 90%.
The lower and upper bounds (LB and UB, respectively) are given for a confidence interval equal to 90%
(CI=90%). As suggested by Kántor et al. (2016) for small sample size, we elected the median Thermal Sensation Vote as the central descriptor of each PET bin. Like Heng and Chow (2019) the “no stress”
band or OTC acceptability range is computed from the +/- 0.5 σ bounds of a normal probability density function centered on the neutral sensation (38.3% of the observations, σ being the standard deviation).
DELIVERABLE TECHNICAL REPORT Version 05.08.2020
19
3 Results
3.1 The OTC perception ranges
3.1.1 Tanjong Pagar OTC acceptability ranges and neutral temperature
The resulting comfort ranges for the four sites are given in Table 8. They are providing with the 90%
confidence interval [in brackets], hence considering the variations of the survey individual votes around central value of PET bins.
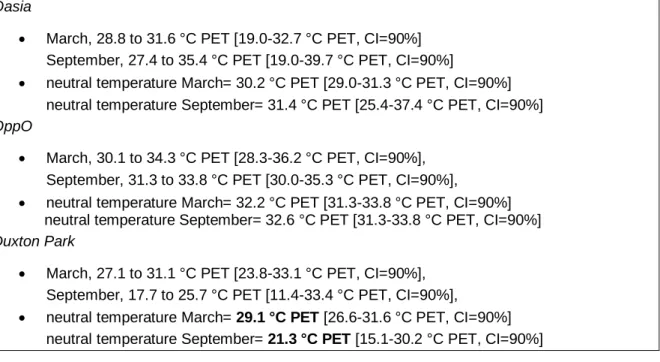
Table 8. Comfort ranges for the three sites using the OLS and considering a confidence interval (CI) around the obtained OLS model of 90%.
Oasia
March, 28.8 to 31.6 °C PET [19.0-32.7 °C PET, CI=90%]
September, 27.4 to 35.4 °C PET [19.0-39.7 °C PET, CI=90%]
neutral temperature March= 30.2 °C PET [29.0-31.3 °C PET, CI=90%]
neutral temperature September= 31.4 °C PET [25.4-37.4 °C PET, CI=90%]
OppO
March, 30.1 to 34.3 °C PET [28.3-36.2 °C PET, CI=90%], September, 31.3 to 33.8 °C PET [30.0-35.3 °C PET, CI=90%],
neutral temperature March= 32.2 °C PET [31.3-33.8 °C PET, CI=90%]
neutral temperature September= 32.6 °C PET [31.3-33.8 °C PET, CI=90%]
Duxton Park
March, 27.1 to 31.1 °C PET [23.8-33.1 °C PET, CI=90%], September, 17.7 to 25.7 °C PET [11.4-33.4 °C PET, CI=90%],
neutral temperature March= 29.1 °C PET [26.6-31.6 °C PET, CI=90%]
neutral temperature September= 21.3 °C PET [15.1-30.2 °C PET, CI=90%]
The relationship was not significant in the Parking site, explaining therefore the absence of the OTC acceptability range for this site (see please Annex 2 for details). The full thermal sensation scale can be consulted in Table 10. Apart from September in the Duxton Park, which follows a logarithmic function, the best fittings between the median thermal sensation votes and the PETs were given by linear models (Fig. 7).
DELIVERABLE TECHNICAL REPORT Version 05.08.2020
20 Figure 7. Thermal sensation-PET relationships. Note the log scale in C2 (log).A is Oasia, B is OppO and C1 and C2 correspond to the dry and wet inter-monsoon in the Duxton Park.
The logarithmic function in the park site describes a non-linear sensitivity of the individuals to the thermal conditions with higher thermal sensitivity close to neutrality and a plateau at PET over 40.4 °C indicating thermal sensation variations independent from the heat stress intensity. The plateau is also noticeable in the relatively low Pearson correlation coefficient (R2) despite the largest population sample size (N) in the Duxton park site (R2=0.24 for N=83). Because the thermal sensation varies independently from the PET, we can assume that above 40.4 °C the extreme warm sensations a more due to psychological than physiological factors. A more comprehensive OTC inferential model incorporating socio-demographic and psychologically related variables should help improve the predictability of the model in extreme warm conditions in the park.
DELIVERABLE TECHNICAL REPORT Version 05.08.2020
21 According to Table 8 the Duxton Park, although being greener, is not the most comfortable site, especially in the wet inter-monsoon. Besides, OTC perceptions change more rapidly from comfortable to uncomfortable conditions in the wet inter-monsoon compared to the dry inter-monsoon.
Duxton Park is the site that presents the highest seasonality. The neutral temperatures in the Duxton Park are close to 21 °C PET in the wet inter-monsoon season and 29 °C PET in the dry one, rather low compared to the other sites. Note that the minimum PET observed during the campaign is 26 °C PET and the first quartile is 30.5, meaning that the neutral temperature is rarely met in the residential area and especially in the wet inter-monsoon. In contrast, with neutral temperatures close to 30 and 32 °C thermal neutrality is achieved more often in the commercial sites. The seasonality in the Duxton Park induces a difference of +/- 9 °C PET when it is 1 °C in the two other sites.
Considerably higher wind speed in March in the Duxton Park site compare to September may explain this difference.
Comparing the different sites, the less open and more shaded commercial sites perform better than the residential green site.
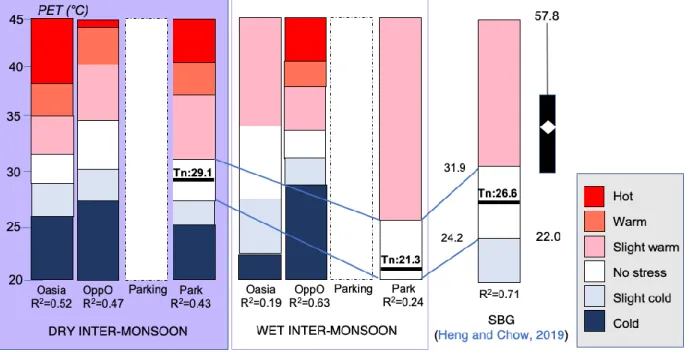
Figure 8. Thermal sensation scales in Tanjong Pagar.
When comparing the Duxton Park results with Heng and Chow (2019), our neutral temperature (Tn) is 5 °C cooler in the wet inter-monsoon and 2.5°C warmer during the dry inter-monsoon. Though the upper bound of the OTC acceptability range is close to Heng and Chow (2019), there is much contrast in the lower bounds of the OTC acceptability ranges. The lower bound in our study is significantly cooler,
DELIVERABLE TECHNICAL REPORT Version 05.08.2020
22 indicating a warmer urban pocket park than the Singapore botanic garden (SBG). The comfort range is wider in the urban pocket park than in the SBG but it is also more centred towards the cold, which temperatures rarely occur in Singapore. When considering in addition the OTC scale of Lin and Matzarakis (2008), we can observe again relatively close upper bounds in the OTC acceptability ranges among these warm and humid climate OTC studies (Table 9). It pleads for universal OTC acceptability ranges and warm thermoregulation capacity when switching from the no stress zone to the warm. On contrary the other thermal sensations are less consistent (Fig. 8).
Table 9. OTC acceptability ranges in different studies (in °C)
This study Others
Urban pocket park
Commercial SBG
(Heng & Chow, 2019)
Taiwan (square) (Lin & Matzarakis,
2008)
Singapore (aggregated, Yang
et al., 2013) 27.1 to 31.1 (dry)
17.7 to 25.7 (wet)
28.8 to 31.6 (dry) 27.4 to 35.4 (wet) 30.1 to 34.3 (dry) 31.3 to 33.8 (wet)
24.2-31.9 26-30 25.9 – 30.2
In terms of seasonality, PET has higher explanatory capacity in the dry inter-monsoon compared to the wet inter-monsoon, suggesting more influence of physiological parameters in the thermal sensations during the dry inter-monsoon. It is possible that the high temperatures and humidities, by limiting the thermoregulation capacities of individuals in the wet inter-monsoon, strengthen concomitantly the influence of psychological factors in the determination of the thermal sensations. Under this frame, it is also conversely possible that the windier and drier conditions in March improved the efficiency of the thermoregulatory system (sweat evaporative cooling) improving the inferential model capacity to predict the individual thermal sensation since people might be more conscious of the changes in their body skin temperatures and sweat rate. Again, this plaids for an enrichment of the inferential statistical model with psychological factors in atmosphere close to moisture saturation and the comparison of PET outcomes with other heat stress indices to confirm these findings.
DELIVERABLE TECHNICAL REPORT Version 05.08.2020
23 Table 10. Thermal sensation scales associated with their lower and upper bounds (LB and UB) considering a confidence interval CI=90%. The difference UB-LB is provides a range of uncertainty called “∆bounds”.
PET (°C) March September
Intercept LB UB ∆bounds Intercept LB UB ∆bounds Oasia
Slightly cold 27.5 25.7 29.3 3.6 23.3 12.3 34.3 22.0 Slightly warm 32.8 31.5 34.2 2.7 39.5 35.4 43.5* 8.1
Warm 35.5 33.4 37.6 4.2 47.6 39.7* 55.5* 15.8
Hot 38.2 35.1 41.3 6.2 55.7 42.5* 68.8* 26.3 OppO
Slightly cold 28.1 25.7 30.5 4.8 29.9 28.5 31.4 2.9 Slightly warm 36.4 33.9 38.7 4.8 35.2 33.5 36.9 3.4
Warm 40.5 36.6 44.3 7.7 37.8 35.3* 40.3* 5.0
Hot 44.6 39.2 50.0 10.8 40.4 37.0* 43.8* 6.8 Park
Slightly cold 25.0 20.9 29.1 8.2 14.6 8.7 24.8 16.1 Slightly warm 33.1 31.4 34.8 3.4 31.0 25.8 37.0 11.2
Warm 37.3 34.8 39.6 4.8 45.2 40.4 49.4 9.0
Hot 41.3 37.4 45.2 7.8 65.7 51.4 83.1 31.7
3.1.2 Duxton OTC acceptability ranges
Using more accurate sensors and a larger survey population sample size, we expected to increase the accuracy of the determined OTC acceptability ranges in the Duxton Park. The linear model was significant according to a p-value <0.05. It is given by the following equation:
September, MTSV=0.36 PET – 9.23 with R2= 0.61* (N=318, F=20.9) The OTC acceptability range is: 24.0 to 26.7 °C PET [21.5-28.2 °C; CI=90%], Neutral temperature: 25.4 °C PET [23.4-27.3 °C; CI=90%]
DELIVERABLE TECHNICAL REPORT Version 05.08.2020
24 Table 11. OTC acceptability ranges in different studies (in °C)
This study Others
Urban pocket park Commercial SBG (Heng &
Chow, 2019)
Taiwan (square) (Lin & Matzarakis,
2008)
Singapore (aggregated, Yang
et al., 2013) Tanjong Pagar:
27.1 to 31.1 (dry) 17.7 to 25.7 (wet) Duxton (all):
24.0 – 26.7 (wet)
Tanjong Pagar:
28.8 to 31.6 (dry) 27.4 to 35.4 (wet) 30.1 to 34.3 (dry) 31.3 to 33.8 (wet)
24.2-31.9 26-30 25.9 – 30.2
Table 12. Thermal sensation scale for Duxton Park. Same as Table 9.
PET (°C) September
Intercept LB UB ∆bounds Park
Slightly cold 22.6 19.6 25.6 6.0 Slightly warm 28.1 27.0 29.2 2.2
Warm 30.8 29.9 31.8 1.9
Hot 33.6 31.9 35.2 3.3
Figure 9. Thermal sensation scales in Duxton Park (all) and by sites. SVF refers to the Sky View Factor of the sites. Colour scale is same as Fig.8. The box-plot indicate the PET distribution during the campaign.
DELIVERABLE TECHNICAL REPORT Version 05.08.2020
25 The OTC acceptability ranges between sites 2 and 3 (the most exposed) are sensitively the same. The palm tree site (site 3) behaves as equivalently as the open area (site 2). The OTC acceptability ranges are then shifted towards the warm in the more shaded site (site 1) although the width of the comfort range is reduced in this site.
Compared to the SBG, the neutral temperature in the Duxton Park is now -1.4 °C cooler. It is additionally + 4.1 °C warmer than the ‘Tanjong Pagar’ Duxton Park neutral temperature. The explanatory power of the inferential model is improved since 60% of the thermal sensation variability can be here explained by the physiological thermoregulatory mechanism. The differences between the neutral temperatures may be explained by: i) the larger survey sample size; ii) the weather conditions; iii) the park spatial inhomogeneity; iv) the sensor accuracy. We hereafter attempt to identify the source of differences considering each factor separately:
i) Sample size
Larger samples provide more robust results as they are more representative of the real population characteristics. Nonetheless it is difficult to engage commuters with tight schedules. To test the effect of the sample size, we randomly select 100 then 50 records in the overall Duxton dataset. We iteratively computed 100 linear inferential models and excluded the non-significant relationships. We ultimately computed the average OTC acceptability range and neutral temperature over the iterations and compared the obtained results.
o Sample size 100:
Average neutral temperature = 24.7 °C PET [N=100; max-min=19.9 to 27.8 °C];
Average OTC acceptable range= 23.2 to 26.2 °C PET
With:
OTC lower bound amplitude: 17.4 to 27.0 °C PET OTC upper bound amplitude: 22.3 to 28.7 °C PET Coefficient of determination variations (R2): 0.25 to 0.86
o Sample size 50:
Average neutral temperature = 25.1 °C PET [N=50; max-min=20.0 to 27.7 °C];
Average OTC acceptable range= 23.6 to 26.6 °C PET
DELIVERABLE TECHNICAL REPORT Version 05.08.2020
26 With:
OTC lower bound amplitude: 17.6 to 26.9 °C PET OTC upper bound amplitude: 22.5 to 28.6 °C PET Coefficient of determination variations (R2): 0.25 to 0.73
The sample size has no significant influence on the OTC acceptability ranges.
ii) The 2018 unusual weather conditions
Looking to September 2018 and 2019 air and globe temperature distributions, we can notice differences in the extreme temperatures. The maximum air temperature was +4 °C higher in 2018 than in 2019 while the minimum globe temperature was +3°C warmer in 2018 compared to 2019. The air mass was also more humid in 2018 than 2019 (min=25.2 hPa; max=38.1 hPa in 2018 compared to min=19.2 hPa;
max=29.3 hPa in 2019). With warmer and more humid conditions and reduced globe temperature daily variations in September 2018, it is possible that the human body is less efficient in regulating its body core temperature, appealing for cooler 2018 OTC acceptability ranges (Tanjong Pagar campaign) as compared to September 2019 (Duxton campaign) as observed in our result.
iii) Spatial heterogeneity and site representativeness
Considering only site 2 (N=109), common to the two OTC campaigns, gives a significant although lower than previously relationship between the thermal sensation and the PET (R2= 0.35*). The neutral temperature turns then to be 21.6 °C PET [14.5-28.7 °C PET; CI=90%; Fig. 9]. Both the neutral temperature and the OTC acceptable range are closer to the Tanjong Pagar ’s Duxton Park results.
The lower and upper bounds are 4.5 and 3 °C cooler in the present case compared to previously when aggregating the result over the whole sites. It is therefore plausible that the difference between the Tanjong Pagar ’s Duxton Park and the Duxton’s Duxton Park OTC acceptability range is actually due to the consideration in the latter case of the landscape heterogeneity of the park. With less exposed sites (site 1 and 4), it is possible that the lower and upper bounds of the overall Duxton Park OTC acceptability range are pushed towards warmer temperatures: with shade, people become more tolerant to heat. Further, when comparing the OTC we can notice a 2 °C differences between the Site 2-only and Tanjong Pagar-Duxton Park acceptability ranges. It can be attributed to the differences in the sensor accuracies in the two campaigns.
DELIVERABLE TECHNICAL REPORT Version 05.08.2020
27 Table 13. OTC acceptability ranges in different studies (in °C). Same references as in Table 9
This study Others
Urban pocket park Commercial SBG Taiwan (square) Singapore (aggregated) Tanjong Pagar:
27.1 to 31.1 (dry) 17.7 to 25.7 (wet)
Duxton (all):
24.0 – 26.7 (wet)
Duxton (site 2 only):
19.5 – 23.7 (wet) [10.7-29.3; CI=90%]
Tanjong Pagar:
28.8 to 31.6 (dry) 27.4 to 35.4 (wet) 30.1 to 34.3 (dry) 31.3 to 33.8 (wet)
24.2-31.9 26-30 25.9 – 30.2
iv) The sensor accuracy
In September 2019, we simultaneously measured during a day the microclimate conditions in the Duxton Park site 2 with the Kestrel placed at 1.1m and the Vaisala system of sensors mounted at 2.2m.
We computed the mean biases, root mean square errors, and absolute differences for every variable.
The mean significant absolute difference (Vaisala-Kestrel differences > Kestrel sensor uncertainty) were 1 °C and 2 °C for the air and globe temperatures with a continuous over-estimation of the Kestrel globe temperature. The air temperature is on contrary over-estimated by the Kestrels only in 30% of the records and especially from 10 am to 1 pm. Figure 9 highlights an obvious heteroscedasticity of the Vaisala-Kestrel biases when globe temperatures overpass 33°C (Figure 9). The bias can reach up to -4 °C.
The relative humidity biases are steadily over-estimated by the Kestrel in the morning and evening (10%) and even more at noon (20%). This daily pattern can be due to the influence of the air temperature on the humidity air saturation. Surprisingly and although well known to provide inaccurate wind speed, the Kestrel only slightly over-estimated the measures. The bias is - 0.3 m/s in average and rarely goes up to -1 m/s.
DELIVERABLE TECHNICAL REPORT Version 05.08.2020
28 Figure 9. Vaisala-Kestrel air temperature biases respect to insolation.
By considering Figure 10, the air humidity is showed to have a non-significant influence on the PET although the Kestrel relative humidities have been lowered by 10% in the present scenario. Nonetheless the neutral temperature has dropped considerably meaning that the inferential model is very sensitive to the sensor uncertainty. On contrary, we observed a higher and more direct impact of the Kestrel air temperatures and globe temperatures’ corrections on the PET distributions (-1°C of the air temperature when globe temperature exceeds 33°C and - 2°C in the globe temperature).
-4 -3 -2 -1 0 1 2 3 4
20 25 30 35 40 45 50
Temperature Bias (°C)
Globe temperature (°C)
Vaisala-Kestrel air temperature biases with globe temperature
DELIVERABLE TECHNICAL REPORT Version 05.08.2020
29 Figure 10. Influence of the Kestrel observation biases on the PET distribution
To sum up, it is essential to use sensors with good accuracy. Although PET is more dependent on the mean radiant temperature, it is also highly sensitive to humidity. Sample size is not as significant as to ensure the site representativeness: OTC scales are highly sensitive to spatial variabilities.
3.2 Changes of OTC acceptability ranges with age
We performed in addition to the work package task, a sensitivity analysis of the thermal sensation scales with individual age also knowing PET is insensitive to it. The aim of the study is to give insight to the CS1.5 cognitive study on elderlies and recycling the data and study protocol developed in this work package. We present here the outcome of this supplementary analysis.
Because elderlies weren’t the specific target of this whole work package by their own, we have to develop a method to avoid biases due to the population sample size when intercomparing the different
DELIVERABLE TECHNICAL REPORT Version 05.08.2020
30 age classes, and especially the aged population. Elderlies above 65 yr. old only represent 54 records when young adults belonging to the 21-35 year old class (median of the class 28 yr. old) represent substantially more records. Therefore cohorts of 54 individuals belonging to the 21-35 year old class have been randomly selected in the total 28 years old surveyed population in the Duxton OTC campaign so as to consider equal population sample size among age classes. We built the inferential thermal sensation-PET model considering 20 random iterations and averaged the results to obtain a representative neutral temperature and OTC acceptable range. Due to the size of the other age classes’
populations, we did not repeat this iterative approach further.
o 28 yr. old person R2=0.4-0.8*
neutral temperature = 25.9 °C PET [N=50; 28.7 to 23.1 °C PET, CI=90%];
average OTC acceptable range= 24.5 to 27.3 °C PET [21.0-29.4 °C PET, CI=90%]
o 43 yr. old person R2=0.6*
neutral temperature = 23.9 °C PET [N=85; 21.1 to 26.6 °C PET, CI=90%];
OTC acceptable range= 22.3-25.5 °C PET [18.8 to 27.6 °C PET, CI=90%]
o 58 yr. old person R2=0.3*
neutral temperature = 26.8 °C PET [N=40; 21.2 to 30.6 °C PET, CI=90%];
OTC acceptable range= 25.6-28.0 °C PET [21.0-29.4 °C PET, CI=90%]
o Aged person > 65 yr. old
R2=0.2, p-value=0.13 neutral temperature = - OTC acceptable range= -
Though there are differences in the neutral temperatures with age, no clear patterns in the OTC acceptability ranges (e.g. systematic gradual increase or decrease of the neutral temperatures with age), OTC range cut-offs or OTC range width are visible with respect to age. The results to such extent are unfortunately inconclusive.
DELIVERABLE TECHNICAL REPORT Version 05.08.2020
31
4 Conclusions
4.1. Summary of findings
When comparing the OTC acceptability of commercial and residential areas, our study reveals more thermally efficient commercial areas (Oasia and OppO) compared to the residential green area. Less green but more shaded in our case (low sky view factor), the commercial areas are characterized by increased tolerance to heat with a shift of the OTC acceptable range towards the warm. Their comfortable ranges also correspond more to the prevailing heat stress conditions pedestrians are facing/exposed to in their everyday routine in Singapore. The PETs, indeed, are rarely below 30 °C in our case study which would correspond to the acceptable OTC range of the residential area being 17.7 to 25.7 °C in the wet inter-monsoon and 27.1 to 31.1 in the dry inter-monsoon.
The residential area was especially uncomfortable during the wet inter-monsoon due to the absence of wind and high exposure to sun at noon. Besides while in field, most of the surveyed people were complaining about the poor shading of the site, and particularly the lack of mature high trees in the park to provide shelter to sun. People referred to the tree pruning and also past tree removal. This is somehow reflected in this OTC analysis: green is not a synonym for thermal comfort. It depends on the quality of the green as observed between the palm tree and rainforest tree sites during the Duxton campaign. Greening strategies seems also more efficient when associated with building shade (Oasia, OppO).
Compared to the commercial sites, the residential green area also shows a saturation behaviour with a higher sensitivity to heat close to the neutral temperature and an insensitivity to heat for PET value above 40 °C in the wet inter-monsoon. At this PET value, conditions were invariantly hot whatever the PET values. Besides, with high humidities, the explanatory power of PET in thermal sensation decreases in most of the sites, indicating the need to include psychological factors in the inferential model for ambient conditions close to humidity saturation. Comparison of this finding with different heat stress indices is however recommended to ensure that this pattern is not inherent to the intrinsic limit of the PET index in warm and humid climates.
From a pedestrian outdoor exposure perspective, our results are important since parks are a major asset to promote and support physical activities. Further, based on three-day observations of pedestrian volume and profiles, we tallied more groups with kids and elderlies in the residential parks than in the commercial area (Fig. 11). Yet elderlies above 65 yr. old and infants below 5 yr. old are well acknowledged to be more vulnerable to heat than usual adults. In addition to the higher sensitivity of the residential area inherent to the nature of its users, the survey participants in this area reported significant seasonal and spatial variations in their thermal comfort perceptions, revealing that the
DELIVERABLE TECHNICAL REPORT Version 05.08.2020
32 population in the residential area is more exposed to uncomfortable hot conditions, more sensitive, and more aware of the prevailing weather conditions (humidity and wind) than the users of the commercial sites.
All in all, when comparing with other studies in warm and humid climate (although the studies are not performed in the same seasons, using the same sensors), it is interesting to highlight the quasi- adequacy of the upper bounds of the OTC acceptable range and the inadequacy of the lower bounds.
It translates in that body thermoregulation in the warm is universal when close to the no stress zone while none are equal in the way their body physiologically adapt to cold or extreme warm. This findings doesn’t conflict with the significant site-to site thermal sensation cut-offs variations find in the other thermal sensation cut-offs.
Figure 11. Daily pedestrian volume in Oasia, Parking, and Duxton Park resulting from the three-day pedestrian counting campaign.
Lastly and in terms of methodology, we found that whether 100 or 50, the number of records in a survey sample doesn’t have much impact on the PET-thermal sensation scale. The identity of the records composing the sample does. A fortiori, we also noted the importance to secure the representativeness of a measurement site when assessing a heterogenous space with only one station, like in the Duxton Park. Stations 2 and 3, with a similar sky view factors had the same thermal sensation scales while
DELIVERABLE TECHNICAL REPORT Version 05.08.2020
33 Station 1 was apart. The sky view factor is here an important parameter explaining the differences amongst the site.
Ultimately, a relaxation of standard height for microclimate OTC observations from 1.1 to 2.2 meters is possible, although special attention has to be paid to the globe temperature and shading pattern in the assessed environment. It can be of importance when budgeting an OTC field campaign and choosing sensors’ accuracy.
4.3. Limitations
o Need of standardized methods
Although we tried to follow as closely as possible the method of Heng and Chow (2019), it is quasi- impossible to eliminate the differences entrenched by the sensor accuracy and the sample size. While the Tanjong Pagar campaign used new generations of the Kestrel Heat Stress Tracker, Heng and Chow (2019) used an older version, and more accurate Vaisala weather stations were used in the Duxton OTC campaign. Since these studies were not performed at the same time, it is difficult to compare the obtained thermal sensation scales without considering that these scales come with a certain uncertainty of the representativeness of the sites and population sample of the area under study. It is usually recommended to have large sample sizes to avoid artifact effects of outliers. However, depending on the sites, the pedestrian volume limits the number of people recruited for the study. Besides, transiting individuals are more difficult to engage than people relaxing in an ornamental/educational park. An alternative lies in the recruitment of survey subject a priori but the method is also entrenched with biases due to repetition of experiences and subject selections, and would not allow comparing studies between them.
o Measurement at 2.2 m instead of 1.1 m:
Although the radiant temperature varies with height it wasn’t possible to place the sensor in the appropriate elevation for security reasons and in respect to the research permit recommendation of the land owners. A relaxation of the recommendation or more personnel would have been needed to place and replace the sensor from the “topical” 1.1 m height to the appropriate “safety” every field survey day.
o PET an integrative index for Europe and non-acclimatized individuals:
Developed for Europe and steady-state conditions, PET doesn’t reflect adequately tropical conditions:
individual acclimatization (faster onset of sweating), humidity impact on OTC, and tropical attires.
Additionally, the extra metabolic heat is under-estimated in our study since individuals are walking and
DELIVERABLE TECHNICAL REPORT Version 05.08.2020
34 face transient conditions and metabolism activities. To comply with this shortcoming a new index, the modified PET (mPET, Chen and Matzarakis., 2018) has been developed. It is supposed to better consider humidity and unsteady conditions by changing the thermoregulation model within PET and relaxing the clothing insulation and extra metabolic heat parameters in the inputs. While it has been tested during a pilot study in Cooling Singapore 1.5, the mPET index is now too new to allow cross- check comparisons with other established studies.
Methodologically, being an integrative PET index, PET hides the contribution of each particular meteorological variable in OTC. It enables site comparison but one PET value corresponds to various combinations of wind speed, irradiance, ambient temperatures and humidities, which are more determinant to help an urban designer to conceive adapted climate responsive outdoor environments.
Here the aim was to provide OTC acceptability ranges over sites. Other examinations of the impact of each meteorological variables on the thermal sensation votes based on an ordinal logistic model are needed to support climate responsive designs. In addition, by construction, PET is also more sensitive to radiation than other indices, meaning that other heat stress indicators should be tested to get rid of the limits inherent to the index.
Contributions
Dr. Kohler (NUS-SMU) conducted the outdoor thermal comfort campaigns. She designed the research protocol and survey questionnaire, cleared the research permit and ethic for the two OTC campaigns.
She was personally in charge of the meteorological condition monitoring campaign of the Tanjong Pagar campaign and administrated the OTC survey with the help of the NUS urban climate lab team and 8 NUS research assistants. During the Duxton OTC campaign, she was helped by Dr. Acero (SMART) who supervised and managed the meteorological condition monitoring in the Duxton park.
The collection of this dataset was facilitated by the help of the CS team. Dr. Kohler analysed the whole datasets and compiled them in this technical report. Ms. Ruefenacht facilitated the coordination of the Duxton OTC campaign as coordinator of the CS1.5 project. Dr. Philipp assisted Dr. Kohler in fieldwork in both OTC campaigns in administrating the OTC survey questionnaire to the recruited participants and further and nicely took the responsibility to upload the technical report in the ETH publication collection. Prof. Dr. Chow (NUS-SMU) supervised the whole work.
DELIVERABLE TECHNICAL REPORT Version 05.08.2020
35
Acknowledgments
The research was conducted under the Cooling Singapore project, funded by Singapore’s National Research Foundation (NRF) under its Virtual Singapore programme. Cooling Singapore is a collaborative project led by the Singapore-ETH Centre (SEC), with the Singapore-MIT Alliance for Research and Technology (SMART), TUMCREATE (established by the Technical University of Munich), the National University of Singapore (NUS), the Singapore Management University (SMU), and the Agency for Science, Technology and Research (A*STAR).
References
A.S.H.R.A.E. (2010). Standard 55-2010, Thermal Environmental Conditions for Human Occupancy.
Atlanta: American Society of Heating, Refrigerating, and Air-Conditioning Engineers.
Bechtel, B., Alexander, P. J., Böhner, J., Ching, J., Conrad, O., Feddema, J., ... & Stewart, I. (2015).
Mapping local climate zones for a worldwide database of the form and function of cities. ISPRS International Journal of Geo-Information, 4(1), 199-219.
Binarti, F., Koerniawan, M. D., Triyadi, S., Utami, S. S., & Matzarakis, A. (2020). A review of outdoor thermal comfort indices and neutral ranges for hot-humid regions. Urban Climate, 31, 100531.
Chen, Y. C., & Matzarakis, A. (2018). Modified physiologically equivalent temperature—Basics and applications for western European climate. Theoretical and Applied Climatology, 132(3-4), 1275- 1289.
Chow, W. T., & Roth, M. (2006). Temporal dynamics of the urban heat island of Singapore. International Journal of Climatology: A Journal of the Royal Meteorological Society, 26(15), 2243-2260.
Chow, W. T., Akbar, S.N.A.B.A, Heng, S.L., & Roth, M. (2016). Assessment of measured and perceived microclimates with a tropical urban forest. Urban Forestry & Urban Greening, 16, 62-75.
Del Ferraro, S., Iavicoli, S., Russo, S., & Molinaro, V. (2015). A field study on thermal comfort in an Italian hospital considering differences in gender and age. Applied Ergonomics, 50, 177-184.
Filingeri, D., & Havenith, G. (2015). Human skin wetness perception: psychophysical and neurophysiological bases. Temperature, 2(1), 86-104.
Gagge, A. P., Stolwijk, J. A. J., & Hardy, J. D. (1967). Comfort and thermal sensations and associated physiological responses at various ambient temperatures. Environmental research, 1(1), 1-20.
Heng, S. L., & Chow, W. T. (2019). How ‘hot’ is too hot? Evaluating acceptable outdoor thermal comfort ranges in an equatorial urban park. International journal of biometeorology, 63(6), 801-816.
Indraganti, M., & Rao, K. D. (2010). Effect of age, gender, economic group and tenure on thermal comfort: a field study in residential buildings in hot and dry climate with seasonal variations. Energy and buildings, 42(3), 273-281.