Age of Selection Counts:
a Cross-country Comparison of Educational Institutions
Daniel Horn
Daniel Horn
Age of Selection Counts: a Cross-country Comparison of Educational Institutions
Arbeitspapiere – Working Papers Nr. 107, 2008
Mannheimer Zentrum für Europäische Sozialforschung
Horn, Daniel:
Age of Selection Counts: a Cross-country Comparison of Educational Institutions / Daniel Horn. – Mannheim : 2008
(Arbeitspapiere - Mannheimer Zentrum für Europäische Sozialforschung ; 107) ISSN 1437-8574
Not available in book shops.
Token fee: € 3,00
Purchase: Mannheimer Zentrum für Europäische Sozialforschung (MZES), D – 68131 Mannheim WWW: http://www.mzes.uni-mannheim.de
Editorial Note:
Daniel Horn is a PhD student at the Central European University in Budapest, and a junior research fellow at the Institute of Economics of the Hungarian Academy of Sciences. The paper was prepared during his stay at the Mannheim Centre for European Social Research (MZES) in 2007 while working on the project Educational Systems and Labor Markets in Central and Eastern Europe". His main research interests are the effectiveness and equality of education, and the political economy of education.
Abstract
In this paper I combine a theoretically developed construction of the school to work transition litera- ture, namely the stratification and standardization dimensions of the education system, and the more data oriented inequality of opportunity research of the economics of education. I collect several possi- ble indicators for both dimensions to compare the countries: utilizing the PISA 2003 data and some other OECD sources I run multilevel analysis to test the effect of the collected country level stratifica- tion and standardization indicators on the inequality and on the effectiveness of education. Inequality of opportunity is indicated by the size of the parental background effect on the PISA literacy scores, while effectiveness is the literacy score adjusted for parental background and other individual charac- teristics. The results show that stratification associates strongly and positively with the inequality of educational opportunity, while standardization in general seems to enhance equality. I reject that stratification would increase effectiveness, and the association between standardization and effective- ness is not straightforward. The most robust finding of the study is that the early age of selection links closely with high inequality of opportunity.
Contents
1 Introduction... 1
2 Analytic framework ... 2
2.1 Stratification... 3
2.2 Standardization... 3
3 Hypotheses ... 5
4 Variables ... 6
4.1 Stratification... 6
4.2 Standardization... 7
4.2.1 Centralization... 7
4.2.2 Accountability... 8
5 Methods... 10
6 Results ... 13
7 Summary and concluding comments ... 18
8 Appendix ... 19
9 References ... 24
1 Introduction
To have a parent with a diploma guarantees that one will succeed in life. This may be an overly sim- plistic summary of the social mobility research, but demonstrates the incredible importance of the fam- ily, especially when it comes to educational attainment. Yet, studies comparing fairly large amount of countries show large differences in social mobility (Breen, 2005; Erikson & Jonsson, 1996b; Shavit &
Blossfeld, 1993; Shavit & Müller, 1998), and also in the impact of the socio-economic status on educa- tional literacy (OECD, 2001, 2004c). The most plausible explanation for these differences is that the possible channels through which parental background can affect the child are dissimilar across coun- tries. This dissimilarity is due mainly to institutional differences. There are numerous studies that have looked at the association between educational institutions and the impact of family background on educational attainment (Ammermüller, 2005; Arnett, 2007; Dustmann, 2004; Erikson & Jonsson, 1996b; Fertig & Kluve, 2005; Eric A. Hanushek & Wössmann, 2005; Marks, 2006; Shavit & Blossfeld, 1993; Söderström & Uusitalo, 2005; Wössmann, 2004, 2007), and most of the authors either provide a strong theoretical framework that describes the possible institutional mechanisms (e.g. Allmendinger, 1989; Erikson & Jonsson, 1996b; Kerckhoff, 2000), or use sophisticated methodology and good data to empirically test the effect of some specific institutions (e.g. Amermüller, 2005; Eric A. Hanushek &
Wössmann, 2005; Wössmann, 2004). However, the combination of these two aspects is atypical. Fill- ing this niche with this paper, I try to combine the former, theoretically oriented framework adapted from the school-to-work literature, and the latter, empirically focused research of the economics of education. Specifically, I take the stratification/standardization dimensions of the school-to-work stud- ies and systematically operationalize these dimensions to test the association between the educa- tional institutions and the inequality of opportunity and the effectiveness of education, two crucial foci of the economics of education. The explicit goal of this study is to systematically go through the possi- ble variables of stratification and standardization, and reveal those variables that are the most suitable for empirical purposes; that is to find which variables of stratification and standardization – under- scored by the theory – associate significantly with the inequality of opportunity or with the effective- ness of education. I use only internationally comparable datasets, such as the OECD Programme for International Student Assessment (PISA) 2003 study (OECD, 2004c)1 – that looks at the reading, mathematical and scientific literacy of the 15-year-olds – and other OECD indicators mainly from the Education at a Glance (EAG) series (OECD, 2004b, 2005a, 2007).
The outline of the paper is the following: the second section clarifies what I mean by effectiveness, inequality of opportunity, stratification and standardization, and lists the hypotheses that are tested in the second half of the paper. The third part introduces the possible variables that can be used as prox- ies for stratification and standardization, and the fourth elaborates on the methodology used for testing
1 Even if the new 2006 wave of PISA already was available at the publication of this paper, this was not true at the time of submission; moreover, other country level variables – gained mainly from the EAG series – usually refer to 2003, and more recent data are not yet available; which also underlines the use of the earlier wave.
the hypotheses. The next section goes over the results and expands on the conclusions that can be drawn from these, while the final part is a summary of the paper.
2 Analytic framework
The performance of the educational system will be understood throughout this paper as the average literacy scores of the students. Generally, school performance could be understood as some measure of school success, such as for instance, the average mathematical or reading literacy scores of the students, continuation rates from primary to secondary or from secondary to tertiary level, or the aver- age time students run the 100m in athletics. This measure always depends on the focus of the paper, and the availability of data. In this paper I use the combined mathematical and reading literacy skills of 15-year-olds, because I believe this is a suitable proxy of human capital and determines the future life- success of the students, and because the utilized PISA data is the only available comprehensive data set that is suitable for proper cross-country comparative purposes.
The effectiveness of the educational system is the performance controlled for exogenous effects, such as the socio-economic background of the students, their gender and age or their immigrant status. In other words, effectiveness is the “net” or adjusted performance, where all of the variables that could have an effect on the performance but are not under the control of the schools are controlled for. Natu- rally, in practice only a few of the exogenous variables can be controlled for, due to the availability of data.
The educational inequality of opportunity is understood as the effect of parental background on the performance measure, controlled for the exogenous effects; that is, I look at how much the parental background determines the students’ adjusted literacy scores. The higher the association between the parental background and the student literacy score the more unequal the system is. This understand- ing of the inequality of opportunity is in accordance to that of the OECD (2004c) or to other authors’ as well (e.g. Amermüller, 2005; Wössmann, 2004).
Two other important notions of this paper are the stratification and the standardization of the educa- tional system. Stratification is the phenomena that children with similar ability, socio-economic charac- teristics or interests are selected into separate groups/schools, and that there is no or little mobility be- tween these. Stratification, in the scientific literature, is usually referred to as tracking, streaming, sort- ing or grouping of children. Standardization can be understood as “the degree to which the quality of education meets the same standard nationwide” (Allmendinger, 1989, 233), or to put it differently, in a standardized system it does not matter where children go to school, they receive the same education.
Although this framework was initially created for different analytical purposes, to theorize the strength of association between the educational attainment and the labor market outcomes (Allmendinger, 1989; Kerckhoff, 2000; Shavit & Müller, 2000), I find it useful for analyzing educational inequalities as well.
2.1 Stratification
The stratification dimension has been extensively employed in exploring educational inequalities. The most often used proxy for stratification is the early tracking of students into separate and ability/status homogeneous groups. The logic behind the inequality advancing effect of early tracking/selection is that the earlier children are separated according to ability or merit, the more their family background will have an impact on this ability, and thus the more homogeneous groups of children will go to the same schools (Dustmann, 2004). Lower status families will also consider this choice a “hurdle” rather than a real option and thus family status will have a greater impact on this choice (Erikson & Jonsson, 1996a). Moreover, if similar status children are grouped together, positive peer-group effect will be lower in lower status schools; relying on the observation that children’s achievement depends not only on students’ own abilities, but also on the average ability of the class, this selection will help higher status students more (Betts & Shkolnik, 2000). In addition to all this, if early selection places children into different tracks that are valued differently by the labor market, the family background will also have a major impact on future wages of the child (Dustmann, 2004). Hence the more stratified a sys- tem is, the more disadvantaged families will lose and thus the higher the inequality of opportunity is.
The relationship between stratification and effectiveness is more complicated. The OECD (2004a) points out that performance and social equity goes strongly together: those countries that are less equal tend to perform better than the others. This observation, however, should not be interpreted as a causal relationship, one cannot be sure whether social equity induces higher school performance or vice-versa, or that there are some intervening variables that correlate both with social equity and per- formance. The obvious candidates for the intervening variables are the selective institutions, such as the early age of selection. However, the micro mechanisms, through which this might hamper school performance, are contradictory. Opponents of early selection argue that positive peer group effect plays an important role in raising student performance: better students help the slower ones more than they lose from this interaction; i.e. grouping children lowers the average performance of slower pupils, while better ones gain only a little from it. Empirical research also finds no positive effects of grouping (Betts & Shkolnik, 2000). On the other side, selection at an early age is supported, mostly based on the argument that every student should receive personalized education; every child is different, thus unified education would hinder progress. Early vocational specialization, for instance, might be benefi- cial for future employment chances for those who would surely not continue in academic education (Arum & Shavit, 1995).
2.2 Standardization
The use of the standardization dimension in research on educational inequalities so far has been less straightforward. This is probably due to the fact that standardization is a fuzzier notion than stratifica- tion, which is also apparent in Allmendinger’s definition: “Variables such as teachers’ training, school budget, curricula, and the uniformity of school-leaving examinations are relevant in measuring the standing of an educational system on this [standardization] dimension” (1989, 233).
There are, nevertheless, studies that do look at aspects of the standardization dimension. Gamoran (1996), for example, has looked at Scottish educational reform between 1984 and 1990. He, among other things, concluded that “when national systems of curricula and examinations are aligned, cen- trally directed reforms can be a mechanism both for raising standards, and for reducing inequality”
(17). Gamoran also emphasized that this conclusion “may be overly simplistic,” since Scotland is a small and rather homogeneous country, but “the merits of standardized curricula linked to nationally recognized examinations should be seriously considered” (18).
To overcome the troubles in understanding the notion of standardization, I propose two distinct and widely used sub-categories: the accountability and the centralization of the educational system. I de- fine accountability as a system of standardized incentives for schools. When schools face similar in- centives, their actions will most likely also be very similar, hence the more homogeneous an account- ability system is, the higher the standardization of the education system. The most straightforward in- stitutions of accountability are the school leaving exams, or other nationally recognized examinations.
Only a couple of scholars, for instance Bishop and Mane (2004), test the effect of increased academic standards on the equality of opportunity. They find that in the US a strict mode of raising academic standards – namely the curriculum-based external exit exam – lowers the achievement gap between high and low status students; however other voluntary, non-standardized exit exams or the minimum number of compulsory courses are not effective. Most of the people researching accountability look at the association between this and the effectiveness of the system; a widely accepted idea is that the power to observe schoolwork is also a requirement for high productivity i.e. increased effectiveness.
According to Hanushek and Raymond (2002), it is not the question whether accountability systems are necessary or not for increasing effectiveness (they are), but it is the type of system, and the incentives they create that needs to be studied more carefully. Several authors look at the state level account- ability systems in the United States, but the empirical evidence – whether accountability raises student performance or not – are rather mixed (Carnoy, Loeb, & Smith, 2001; Dolton, 2002; Ladd, 2001; Mur- nane & Levy, 2001). Centralization is equated throughout this paper with the strength of central regu- lation on school processes. That is, I claim that the more the central or national government is in- volved in regulating the inner lives of schools, the more standardized the system is. Kerckhoff also ar- gues that “[c]entral control does not necessarily lead to standardization of the educational system, but there is a strong tendency for it to do so” (2000, 458).
Politicians consider decentralization a panacea for all problems of the system. From the 1980s, a clear trend of decentralization of education can be observed in many developed countries. Green et al.
(1999) – looking at EU countries – argue that there are several possible reasons for this. The most relevant for my paper is the pressure to improve cost-efficiency of education, and “governments have seen ‘decentralization’ as one way of achieving this with minimum political costs” (ibid., 54). That is, most politicians would consider decentralization a tool to increase the effectiveness of the system. An- other anti-centralization measure is school autonomy. School autonomy means free decision making inside schools, to be able to construct the curriculum, to hire/fire teachers, to allocate resources freely and most importantly to select students based on any criteria. Selecting students based on merit or on
social class is shown to be detrimental to equality. If “schools and children are free to seek each other out: with some caveats, this leads to perfect segregation by child quality.” (Robertson & Symons, 2003).
Hence it seems that although there are only a few studies that consider the association between ac- countability or (de)centralization and effectiveness or inequality, they suggest that both aspects of standardization (accountability and centralization) seem to increase the equality of opportunity, while accountability might increase and centralization might decrease effectiveness.
3 Hypotheses
Based on the literature the following hypotheses are derived.
H1) Stratification increases the inequality of opportunity. The earlier children are selected into groups, or the more homogeneous these groups are, the higher the parental impact on this selection, thus the higher the inequality of opportunity.
H2) There is no association between stratification and effectiveness.
a) Arguments about peer-group effects being beneficial or detrimental to school effectiveness go both ways: it is still unclear whether more homogeneous groups, on average, would perform better or worse; whether better students would help slower students more than they lose by helping them.
b) The effects of vocational training on general skill measures should be negative; however it should advance the practical skills of the pupils.
H3) Standardization reduces the inequality of opportunity.
a) The more centralized a system is, the less parental background matters. The logic is that the more centralized the education system, the less local interest groups can influence the cur- riculum, budget, admission, personnel matters and more; hence the more similar the schools will be. If every school is similar (within the specific track, if tracking is present) then it would not matter where the child entered the school, considering that lower parental background can be associated with lower spatial mobility and thus a limited alternative set of schools, this leads to lower parental background effect on the outcome.2
b) The more transparent the school-work or the more visible its output (e.g. exit exam, more pub- lic information on student or school work) the smaller are the assumed informational advan- tages of higher status families, thus the more equal the system is.
H4) The association between standardization and effectiveness is ambiguous. Centralization (i.e. not decentralization) should dampen productivity, while accountability should enhance productivity.
2 Note that this argument does not hold, if perfect spatial status segregation is present.
a) Decentralization improves effectiveness, because it increases competition and competition is assumed to increase productivity, and because it increases local decision making so that schools can adapt more easily to the local demand (cf. EU’s subsidiarity principle).
b) Accountability raises effectiveness because it provides incentives for schools to improve school-work and it decreases transaction costs of parents (higher transparency).
H5) Stratification and standardization are two perpendicular dimensions. I assume that these two sets of institutions are separate because there are no reasons to assume the contrary.
4 Variables
When trying to create a quantified indicator of some widely defined notion – such as stratification or standardization – one always has to consider two important constraints: the data availability and the plausibility of the assumed connection between the proposed proxy and the theoretical notion. In this paper I deliberately use widely available data that can be applied to proxy stratification and standardi- zation. This allows more transparency than the use of qualitatively created tracking indicators would, although I also realize its disadvantage of being more proximate than the “hand-adjusted” proxies.
Moreover, while qualitative data generation allows the researcher to “fill in the gaps”, that is to impute missing values by hand, using remote indicators carries the problem of missing values. In this paper there are several indicators that are missing for some countries, and considering the small number of cases (29) this might introduce a serious problem to the statistical analysis. The reader must keep this in mind when interpreting the results. Nevertheless, despite the small number of cases, I find signifi- cant and robust results that make generalization possible.
4.1 Stratification
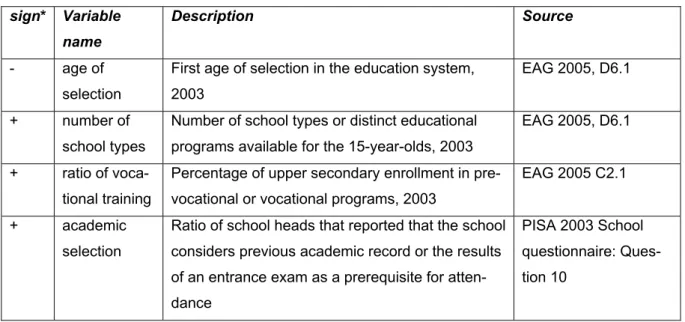
As far as the stratification dimension is concerned there are some commonly used and widely avail- able indicators (see Table 1 below).
The age of first selection and the number of school types are available for almost any country, and both of them have a strong theoretical link to stratification; the earlier children are selected the higher the parental impact on this selection and the more children are grouped (i.e. the higher the number of tracks they are selected into) the more homogeneous these groups can be. It must be noted that the age of selection is also an obvious indicator for non-comprehensiveness. The comprehensive educa- tional system is a non-selective, unified one, where children are mixed and taught the same curriculum for the possible longest time. The more comprehensive a system is, the later the age of selection.
Note that a late age of selection does not necessarily imply a comprehensive system, only an early age of selection necessitates a non-comprehensive one.
The ratio of vocationally trained students is a less direct, although very widely used, proxy for stratifi- cation. The vocational specificity of the educational system crosscuts the standardizing and stratifying dimensions. Most countries that provide state funded vocational credentials, logically, also putting
children into separate groups, hence have a selective system. On the other hand, the existence of vo- cational credentials offers a clear signal about the type of the training the pupils receive, which makes the product of education more comparable, and hence it can be considered as an aspect of standardi- zation as well.
A less popular but theoretically attractive indicator of stratification can be the percentage of schools that select children into their programs taking their former academic record or entrance exam results into account (academic selection). Assuming that academic merit correlates highly with social status, one might argue that an academically selective system is status selective as well (Robertson & Sy- mons, 2003). Necessarily, the higher the number of academically selective schools, the higher the stratification of the system will be.
Table 1 Indicators of stratification
sign* Variable name
Description Source
- age of selection
First age of selection in the education system, 2003
EAG 2005, D6.1
+ number of
school types
Number of school types or distinct educational programs available for the 15-year-olds, 2003
EAG 2005, D6.1 + ratio of voca-
tional training
Percentage of upper secondary enrollment in pre- vocational or vocational programs, 2003
EAG 2005 C2.1
+ academic selection
Ratio of school heads that reported that the school considers previous academic record or the results of an entrance exam as a prerequisite for atten- dance
PISA 2003 School questionnaire: Ques- tion 10
*The signs show the suspected association between the indicators and the unobserved stratification dimension.
See Table A1 in the appendix for descriptive data.
4.2 Standardization
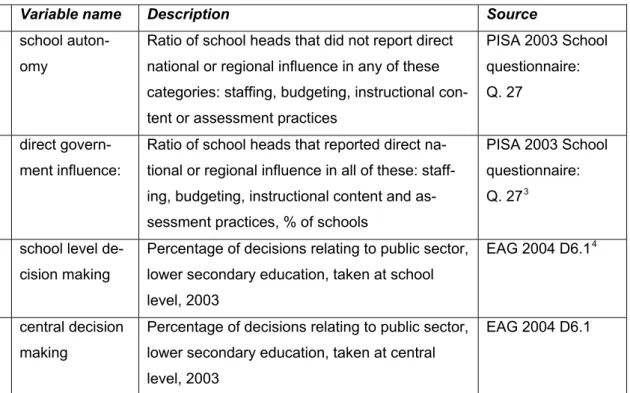
I divide the indicators of standardization into the above mentioned two separate dimensions of cen- tralization and accountability (see Table 2 below).
4.2.1 Centralization
I have found Indicators of centralization both in the PISA 2003 schools questionnaire and in the EAG 2004. In the PISA questionnaire, school heads were asked about the state or national level influence in budgeting, curriculum, personnel matters or in other matters. I assume that the higher the number of school heads that reported these influences in all of these areas, the more centralized the system is
(direct government influence) and reversely, the more school heads reported that the national or state government have no say in their school, the lower the degree of centralization is (school autonomy).
The EAG 2004 presented a different measure: local experts were asked, approximately what percent- age of the decisions relating to the public lower secondary level education is taken at school, local, sub-regional, provincial/regional, state or central level. The higher percentage given for the central level, the more centralized the system is (central level decision making), while higher percentages at the school level mean low centralization (school level decision making).
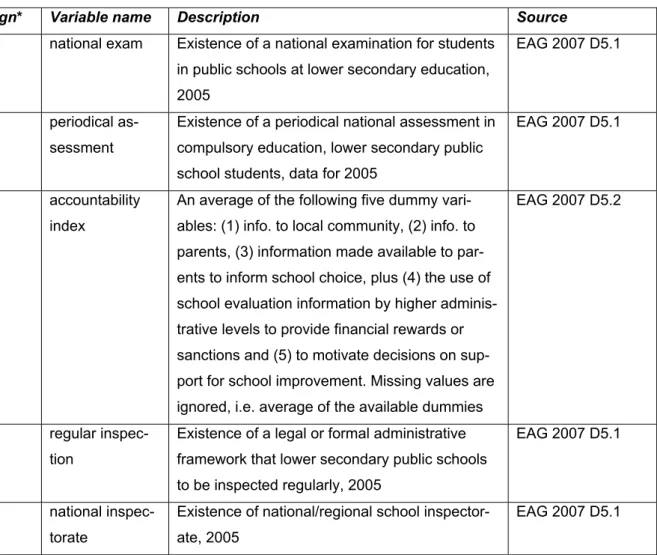
4.2.2 Accountability
As suggested by Allmendinger (1989), unified school leaving examinations can also push towards a standardized education system. If everyone is to pass an exam (national exam), or if students are evaluated periodically (periodical assessment), the students themselves as well as outsiders can eas- ily find out what is expected from the pupils. This – supposedly – decreases transaction costs or the informational advantage of the higher status families. If there is more information available on the stu- dent or on the school performance, the parents can choose more easily, or at least the comparative advantage of higher status families is smaller because it is much easier to gain information on any school. An existing system of accountability can also be considered as a standardizing institution if it provides cheap and widely available information for everyone (accountability index). The existence of national requirements that schools be regularly inspected (regular inspection) or an existing national inspectorate are also indicators of a school system that considers accountability an important issue.
Table 2 Indicators of standardization
Centralization
sign* Variable name Description Source - school auton-
omy
Ratio of school heads that did not report direct national or regional influence in any of these categories: staffing, budgeting, instructional con- tent or assessment practices
PISA 2003 School questionnaire:
Q. 27
+ direct govern- ment influence:
Ratio of school heads that reported direct na- tional or regional influence in all of these: staff- ing, budgeting, instructional content and as- sessment practices, % of schools
PISA 2003 School questionnaire:
Q. 273 - school level de-
cision making
Percentage of decisions relating to public sector, lower secondary education, taken at school level, 2003
EAG 2004 D6.14
+ central decision making
Percentage of decisions relating to public sector, lower secondary education, taken at central level, 2003
EAG 2004 D6.1
*The signs show the suspected association between the indicators and the unobserved stratification dimension.
See Table A2 in the appendix for descriptive data.
3 Note that in the PISA questionnaire, the national and state levels cannot be distinguished. That is, in federal states, e.g. Germany or the USA, the state influence is also counted as centralization. This is why school autonomy should be a better proxy for standardization.
4 Note that this measure is only available for 24 countries. See table A1. in the appendix. Data in the EAG 2004 are from the OECD-INES survey 2003 on decision making in education.
Table 2 Indicators of standardization (continued)
Accountability
sign* Variable name Description Source + national exam Existence of a national examination for students
in public schools at lower secondary education, 2005
EAG 2007 D5.1
+ periodical as- sessment
Existence of a periodical national assessment in compulsory education, lower secondary public school students, data for 2005
EAG 2007 D5.1
+ accountability index
An average of the following five dummy vari- ables: (1) info. to local community, (2) info. to parents, (3) information made available to par- ents to inform school choice, plus (4) the use of school evaluation information by higher adminis- trative levels to provide financial rewards or sanctions and (5) to motivate decisions on sup- port for school improvement. Missing values are ignored, i.e. average of the available dummies
EAG 2007 D5.2
+ regular inspec- tion
Existence of a legal or formal administrative framework that lower secondary public schools to be inspected regularly, 2005
EAG 2007 D5.1
+ national inspec- torate
Existence of national/regional school inspector- ate, 2005
EAG 2007 D5.1
*The signs show the suspected association between the indicators and the unobserved stratification dimension.
See Table A2 in the appendix for descriptive data.
5 Methods
In order to test the association between the educational inequality of opportunity and educational stratification, I use the OECD PISA 2003 data (OECD, 2004c) and other OECD sources – such as the Education at a Glance (OECD, 2005a) – for the institutional proxies. I utilize a two-level hierarchical mixed model (see Bryk & Raudenbush, 1992; Snijders & Bosker, 1999) to estimate the coefficients of the individual level socio-economic background variable on the literacy of the students.
I have used the following model. The first (individual) level estimation is (1) Literacy=β0+β1*ESCS+Σβi*X+r i=2..n
where β is the estimated individual level coefficient, n is the number of variables in the equation, r is the error term, ESCS stands for the economic, social and cultural background, the independent vari-
able in focus, and X is a vector of individual control variables, such as grade, age, gender and immi- grant status. The outcome (Literacy) is the mathematical and reading literacy plausible values in the PISA 2003 data. The dataset provides 5 plausible values for each literacy domain (5 for mathematics and 5 for reading in this case), with suggestions that the researchers use all of these for a more pre- cise estimation. The equation should be estimated as many times as many plausible values are util- ized, and the coefficients and standard errors should be estimated using the results of the separate regressions (for details on the estimation procedure see: OECD, 2005b). I have imputed the first level missing values firstly by using other available information from the dataset and secondly by substitut- ing the country mean.5 Additional control dummies for the imputed values are included in the estima- tion, but are not shown in the tables.
The second (country) level estimations are (2) β0=δ00+ δ01*INST+u0
(3) β1=δ10+ δ11*INST+u1
where δ is the estimated coefficient, and u0 and u1 are the country level error terms. Its sub-indexes are defined as follows: the first index refers to the number of the variable on the individual level, and the second represents the number on the country level. INST is an institutional indicator, listed above.
Substituting (2) and (3) into (1) I get:
(4a) Literacy= δ00+ δ01*INST+u0+( δ10+ δ11*INST+u1)*ESCS+Σβi*X+r rearranging it, I get
(4b) Literacy= δ00+δ10*ESCS+δ01*INST+δ11*INST*ESCS+Σβi*X+(r+u0+u1*ESCS)
where the coefficients of interest are the δ10 that is the effect of the ESCS on the literacy scores, that proxies the inequality of educational opportunity and the δ11 which shows how the different institutions affect the strength of the association between the socio-economic status and the literacy scores.
The estimated basic regressions are in Table 3 below, while the estimated institutional parameters are in the Tables 4 and 5 in the results section. I have standardized the literacy scores and the ESCS variables within countries, so that the unit movements are comparable (more on this see: Horn, 2007).
The ESCS index was standardized within country to have a zero mean and a unit standard deviation.
The standard deviations of the ten plausible values were transformed to be 100 within country, while their initial means were kept so the levels of literacy (the effectiveness dimension) also remained comparable.
5 For instance to impute the missing values of the ESCS I used the predicted values from an OLS regression of ESCS on years of parental education, parental work status and home possessions. Where all of these were missing I used the country mean to impute missing ESCS values.
The used method can be criticized on the ground that there are only 29 country level observations and thus including too many country level variables might decrease the degrees of freedom too much. To avoid this, I have included only one institutional variable in each regression. Despite the small number of cases some of the results are indeed statistically significant.
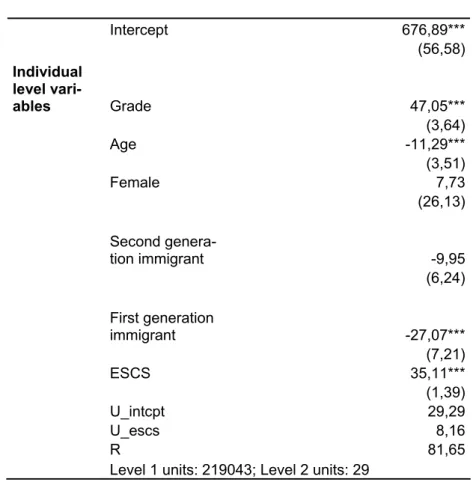
Table 3 Hierarchical linear regressions. The association of educational institutions and the educational inequality of opportunity – Basic models
Mathematical and Reading
Literacy, PISA 2003 Basic
Intercept 676,89***
(56,58)
Individual level vari-
ables Grade 47,05***
(3,64)
Age -11,29***
(3,51)
Female 7,73
(26,13)
Second genera-
tion immigrant -9,95
(6,24)
First generation
immigrant -27,07***
(7,21)
ESCS 35,11***
(1,39)
U_intcpt 29,29
U_escs 8,16
R 81,65
Level 1 units: 219043; Level 2 units: 29
Note: missing values are imputed and controlled for; robust standard errors are in parentheses; ***p<0,01
**p<0,05 *p<0,1. All of the variables in this basic regression are included in the extended regressions below
6 Results
The results support the first hypothesis (H1), namely that stratification increases inequality of opportu- nity. The age of selection and the number of school types show significant effects. Moreover, although neither the ratio of vocational training, nor the other indicators seem to associate significantly with the inequality of opportunity, all of the used proxies point in the expected direction. Since the number of observations is rather small, I believe that the results very robustly support the first hypothesis (see Table 4 below).
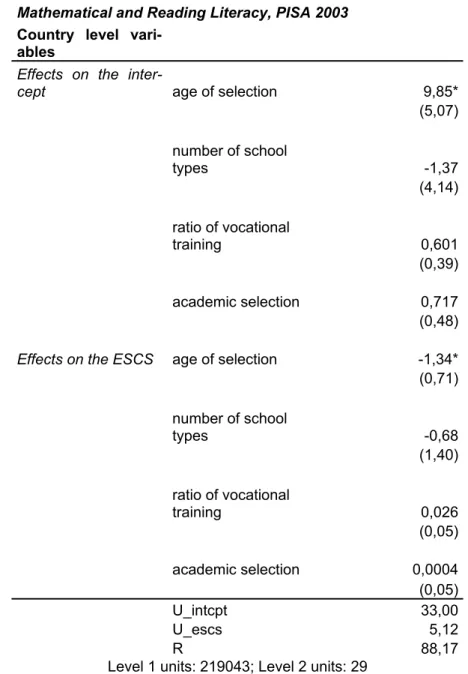
The most important conclusion of this analysis is that the age of selection is the key indicator of strati- fication. The age of selection associates very closely with the parental background effect, or in other words, the earlier countries select the higher their inequality of opportunity is. This result is also high- lighted by the model in Table A3 (in the appendix), where four proxies of stratification (age of selec- tion, number of school types, ratio of vocational training and the academic selection) were included simultaneously. The age of selection remains significant even when other stratification proxies are controlled for. Moreover, the age of selection seems to increase the adjusted literacy scores, which suggests that if other effects of stratification are controlled for, the later children are selected the higher their expected literacy scores will be.
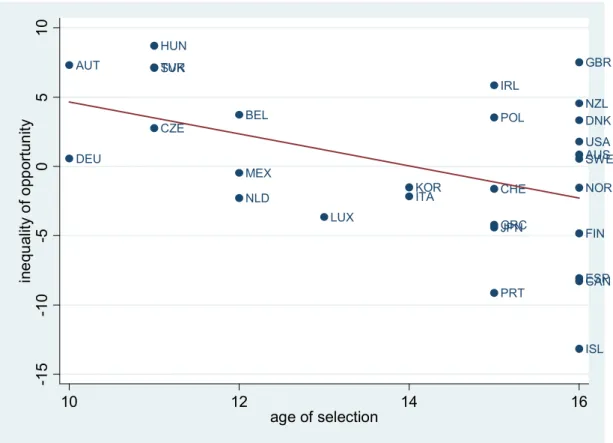
This significance of the age of selection in increasing inequality of opportunity is unsurprising but very important. Unsurprising on the one hand, since the theory of stratification, elaborated above, points out the importance of family background at an early age. The earlier children are selected, or the ear- lier they have to make decisions about their future (which track to choose), the more the parents can impact this selection. On the other hand it is very important because it points out that non- comprehensive systems are indeed very unequal. Age of selection – as I have mentioned above – is a fair indicator of non-comprehensiveness, the systems that select early are certainly not comprehen- sive. The results show that non-comprehensive systems are not equal, but they do not show that all of the systems that select late are equal (see Figure 1 below). This is due to the fact that the late age of selection does not necessitate a comprehensive system.
Additionally, I have to emphasize that PISA was taken at the age of 15. The most selective systems selected the students five years before this age, but almost half of the countries select only after the PISA measures the student literacy. This means that in these countries the children were still sitting in a mixed class, but it does not mean that they will not be separated soon. The differences between the countries might not be this obvious if I had looked at people at an older age, when all of the countries have already selected the students, and when other separate impacts could already have taken place and when one year differences in the age of selection might be negligible. This, however, does not mean that the age of selection is unimportant. On the contrary: as the OECD argues, age 15 is a vital stage in every person’s life (this is why they picked this); an unequal system at this stage can have a very long lasting, and decisive effect throughout the life course.
Figure 1 Age of selection and the inequality of opportunity
AUS AUT
BEL
CAN CHE
CZE DEU
DNK
ESP FIN GBR
GRC HUN
IRL
ISL ITA
JPN KOR
LUX MEX
NLD NOR
NZL POL
PRT SVK
SWE TUR
USA
-15-10-50510inequality of opportunity
10 12 14 16
age of selection
Table 4 Hierarchical linear regressions. The association of stratification proxies and the inequality of opportunity and the effectiveness
Stratification Country level variables age of selec-
tion (r) number of
school types ratio of vocational
training academic se- lection
Main effect (δ01, effectiveness) 4,43 -3,57 0,35 0,24
(3,46) (4,01) (0,39) (0,39)
Interaction effect (δ11, inequal-
ity of opportunity) -1,11** 1,20* 0,06 0,07
(0,42) (0,67) (0,04) (0,06)
U_intcpt 36,26 37,17 36,43 36,95
U_escs 4,88 5,18 5,26 5,31
R 88,17 88,18 88,17 88,18
Level 1 units: 219043 219043 219043 219043
Level 2 units: 29 29 29 29
Note: Coefficients for individual level variables are not shown. The titles of the regressions are the variables in- cluded as country level independent variables in the basic model. Missing values are imputed and controlled for;
robust standard errors are in parentheses; ***p<0,01; **p<0,05; *p<0,1. (r) - reverse (negative) hypothesized rela- tionship
Hypothesis two (H2) is weakly supported by the results (see Table 4 above). None of the utilized prox- ies seems to affect the effectiveness of the system. Not only the effects are non-significant (which
might be an artifact of the small number of cases), but the signs of the estimated coefficients are also contradictory. While the age of selection and the number of school types suggest that stratification is bad for effectiveness, the ratio of vocational training and the academic selection indicators offer the opposite interpretation.
Naturally, one might argue that the latter two also indicate other features of the system: large ratio of vocational training necessitates vocational specificity that children are selected according to their in- terest and academic selection suggests meritocratic selection. These could have a positive effect on the literacy scores. Moreover the association between these two variables and the inequality of oppor- tunity is very weak. Another reasonable argument would be that the age of selection and the number of school types are more plausible indicators of stratification, and thus stratification is bad for effec- tiveness. However, since the estimated coefficients are non significant, I would only conclude that stratification is certainly not good for increasing effectiveness.
Tables 5a and 5b offer the tests for the 3rd hypothesis (H3). In sum, the data does not reject that stan- dardization reduces inequality of opportunity. Centralization seems to associate negatively with the inequality of opportunity (see Table 5a below). Two of the proxies used – school autonomy and school level decision making – are significantly and positively associated with the inequality of opportunity, and the other two centralization indicators also show the expected signs. However none of the ac- countability indicators are significant (see Table 5b below), and the existence of a national inspector- ate associates positively with the inequality of opportunity.
The association of standardization and effectiveness is ambiguous, but not in line with the reasons outlined in the 4th hypothesis (H4), which claimed that centralization would decrease effectiveness, while higher accountability would increase effectiveness (these results are in Tables 5a and 5b). The empirical results are rather mixed. Central decision making is the only centralization indicator, which is significant, and it underlines that centralization hinders effectiveness, however the other three indica- tors are not significant, and also direct government influence correlates positively with the adjusted performance measure, suggesting the opposite. Note, however, that this variable treats federal states as centralized (see footnote 3), which might bias its coefficients. Similarly, there are two significant re- sults in Table 5b: the existence of a national exam shows a negative association with higher net per- formance (which is against expectations), while the accountability index correlates positively with the effectiveness. This latter index captures very important aspects of accountability (information flow, evaluation, financial incentives and decision motivating by data), and hence I would argue that its ef- fects both on the effectiveness and on the inequality dimension should be taken seriously. Based only on this I would claim that accountability raises effectiveness, but the other indicators do not seem to support this statement: the signs of the coefficients of the other three proxies are mixed. Thus I would conclude that I cannot reject the idea that decentralization – most likely through advanced competition – enhances effectiveness, however I cannot claim that higher accountability would correlate positively with effectiveness.
Table 5a Hierarchical linear regressions. The association of standardization proxies and the inequality of opportunity and effectiveness
Standardization (Centralization) Country level variables
school auton- omy (r)
direct govt.
influence
school level deci- sion making (r)
central decision making
Main effect (δ01, effective-
ness) 37,88 30,93 0,55 -0,91**
(53,37) (39,22) (0,36) (0,31)
Interaction effect (δ11, inequal-
ity of opportunity) 14,20* -5,91 0,10* -0,04
(8,18) (6,61) (0,06) (0,05)
U_intcpt 37,48 37,19 38,33 34,72
U_escs 5,34 5,37 5,11 5,53
R 88,17 88,17 88,03 88,03
Level 1 units: 219043 219043 169689 169689
Level 2 units: 29 29 24 24
Note: Coefficients for individual level variables are not shown. The titles of the regressions are the variables in- cluded as country level independent variables in the basic model. Missing values are imputed and controlled for;
robust standard errors are in parentheses; ***p<0,01; **p<0,05; *p<0,1. (r) - reverse hypothesized relationship
Table 5b Hierarchical linear regressions. The association of standardization proxies and the inequality of opportunity and the effectiveness
Standardization (accountability) Country level variables national
exam periodical as-
sessment accountability
index regular in-
spection national in- spectorate Main effect (δ01, effective-
ness) -28,26* -11,46 38,52** -8,94 17,99
(14,31) (14,21) (16,69) (13,16) (15,90)
Interaction effect (δ11,
inequality of opportunity) -1,44 -0,05 -3,23 -1,25 2,45
(2,07) (1,99) (3,18) (2,21) (2,17)
U_intcpt 35,84 38,33 34,72 38,57 37,73
U_escs 5,23 5,29 5,24 5,25 5,14
R 88,04 88,04 87,95 88,04 88,04
Level 1 units: 180098 180098 181434 180098 180098
Level 2 units: 26 26 26 26 26
Note: Coefficients for individual level variables are not shown. The titles of the regressions are the variables in- cluded as country level independent variables in the basic model. Missing values are imputed and controlled for;
robust standard errors are in parentheses; ***p<0,01; **p<0,05; *p<0,1. (r) - reverse hypothesized relationship There are only a few degrees of freedom to test institutional effects due to the small number of cases;
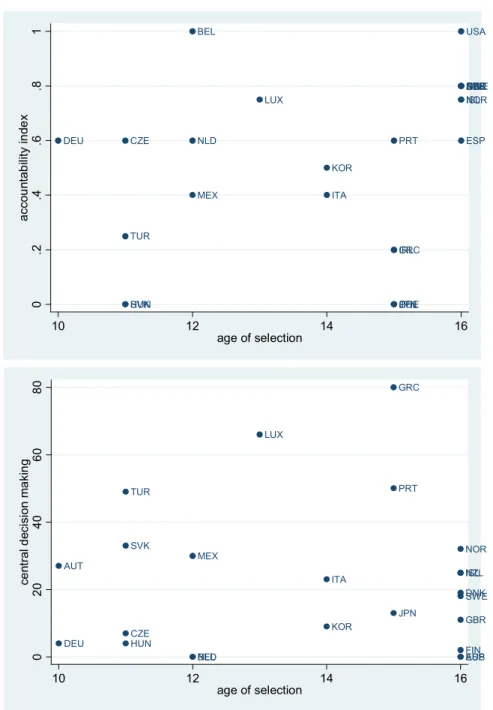
hence I have only included one institutional proxy in each model. The question is, therefore, whether the two dimensions of standardization and stratification are independent or not, or the coefficients of the proxies present the same mechanisms (H5). Figure 2 below shows the age of selection plotted against the accountability index and the central decision making proxies of standardization. Also, Ta-
ble A4 in the appendix shows the pair-wise correlations of the stratification and the standardization proxies. It is clear from these results that these stratification and standardization indexes are inde- pendent. There are many stratified countries that are standardized, and conversely many standardized that are non-stratified, and none of the proxies show a systematic positive of negative relationship with the proxies from the other dimension. Similarly, if the most important proxies of stratification (age of selection) and some proxies of standardization (central decision making or accountability index) are simultaneously included in a model, the coefficients are little changed (see Table A5 in the appendix).
Thus the two dimensions are not only independent but they have an independent effect on the ine- quality of opportunity and on the effectiveness of the education system as well.
Figure 2 Scatter-plots of age of selection and two proxies of standardization
AUS BEL
CHE CZE
DEU
DNK
ESP GBR
GRC
HUN
IRL
ISL
ITA
JPN KOR
LUX
MEX NLD
NOR NZL
POL PRT
SVK
SWE
TUR
USA
0.2.4.6.81accountability index
10 12 14 16
age of selection
AUS AUT
BEL DEU CZE
DNK
ESPFIN GBR GRC
HUN
ITA ISL
JPN KOR
LUX
MEX
NLD
NOR NZL PRT
SVK
SWE TUR
020406080central decision making
10 12 14 16
age of selection
7 Summary and concluding comments
In this paper I combined the theoretically developed construction of the school to work transition litera- ture, namely the stratification and standardization dimensions of the education system, and the more data oriented inequality of opportunity research of the economics of education. I collected several possible indicators for both dimensions and systematically tested their effects on the inequality of op- portunity and effectiveness of education. Despite the small number of countries, that puts a limit on most of the cross-country comparative studies, the results here are statistically significant. Based on the theoretical literature, I listed five hypotheses, most of which were supported by the analysis. Strati- fication associates strongly and positively with the inequality of educational opportunity, while stan- dardization in general seems to enhance equality. The conducted multilevel analysis could not show clear associations between effectiveness and the stratification proxies, but we can reject that stratifica- tion would be beneficial for higher literacy scores. The association of standardization and effective- ness is more complex: one aspect of the assumed standardization dimension – centralization – asso- ciates negatively with the effectiveness according to most of the proxies, while the other dimension–
accountability – has mixed effects, although the most reliable proxy of accountability shows a positive impact on effectiveness. Tests on the two main dimensions of stratification and standardization sup- port their independence.
The detailed results bring some very important and so far unanswered questions to light. The early age of selection seems not only to be detrimental to the inequality of opportunity, but it also correlates slightly with low effectiveness. So Why do countries select early? So far the stratified systems were defended based on the idea that selection and especially selection into vocationally specified training tracks can improve the pupils’ future employment chances (Arum & Shavit, 1995). However, there has been no argument towards the usefulness of early selection per se. This finding seems even more puzzling if we recognize that some of the Central Eastern European countries (such as Hungary, Slo- vakia or the Czech Republic) introduced early selection after the transition, while others retained or even delayed the inherited soviet tradition of selection at age 14. I believe that this question can only be answered by historical or path dependency arguments, but this might be a topic of a different pa- per.
8 Appendix
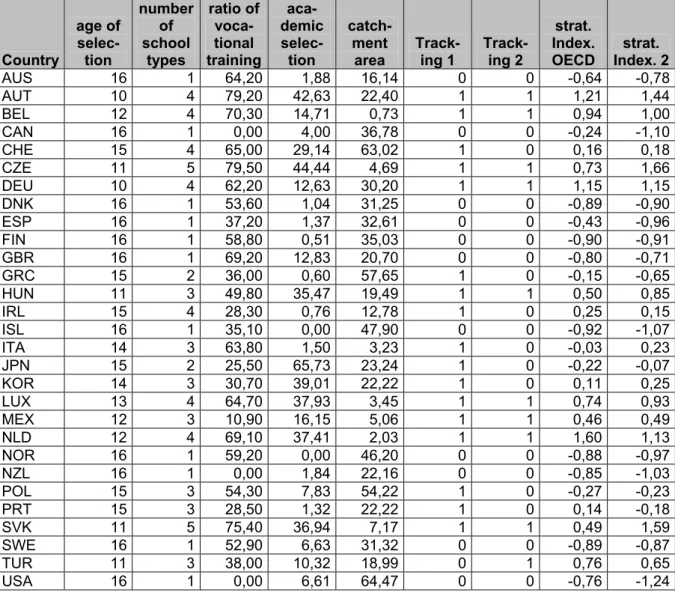
Table A1 Stratification proxies – country values
Country
age of selec-
tion
number of school
types
ratio of voca- tional training
aca- demic selec-
tion
catch- ment
area Track-
ing 1 Track- ing 2
strat.
Index.
OECD strat.
Index. 2
AUS 16 1 64,20 1,88 16,14 0 0 -0,64 -0,78
AUT 10 4 79,20 42,63 22,40 1 1 1,21 1,44
BEL 12 4 70,30 14,71 0,73 1 1 0,94 1,00
CAN 16 1 0,00 4,00 36,78 0 0 -0,24 -1,10
CHE 15 4 65,00 29,14 63,02 1 0 0,16 0,18
CZE 11 5 79,50 44,44 4,69 1 1 0,73 1,66
DEU 10 4 62,20 12,63 30,20 1 1 1,15 1,15
DNK 16 1 53,60 1,04 31,25 0 0 -0,89 -0,90
ESP 16 1 37,20 1,37 32,61 0 0 -0,43 -0,96
FIN 16 1 58,80 0,51 35,03 0 0 -0,90 -0,91
GBR 16 1 69,20 12,83 20,70 0 0 -0,80 -0,71
GRC 15 2 36,00 0,60 57,65 1 0 -0,15 -0,65
HUN 11 3 49,80 35,47 19,49 1 1 0,50 0,85
IRL 15 4 28,30 0,76 12,78 1 0 0,25 0,15
ISL 16 1 35,10 0,00 47,90 0 0 -0,92 -1,07
ITA 14 3 63,80 1,50 3,23 1 0 -0,03 0,23
JPN 15 2 25,50 65,73 23,24 1 0 -0,22 -0,07
KOR 14 3 30,70 39,01 22,22 1 0 0,11 0,25
LUX 13 4 64,70 37,93 3,45 1 1 0,74 0,93
MEX 12 3 10,90 16,15 5,06 1 1 0,46 0,49
NLD 12 4 69,10 37,41 2,03 1 1 1,60 1,13
NOR 16 1 59,20 0,00 46,20 0 0 -0,88 -0,97
NZL 16 1 0,00 1,84 22,16 0 0 -0,85 -1,03
POL 15 3 54,30 7,83 54,22 1 0 -0,27 -0,23
PRT 15 3 28,50 1,32 22,22 1 0 0,14 -0,18
SVK 11 5 75,40 36,94 7,17 1 1 0,49 1,59
SWE 16 1 52,90 6,63 31,32 0 0 -0,89 -0,87
TUR 11 3 38,00 10,32 18,99 0 1 0,76 0,65
USA 16 1 0,00 6,61 64,47 0 0 -0,76 -1,24
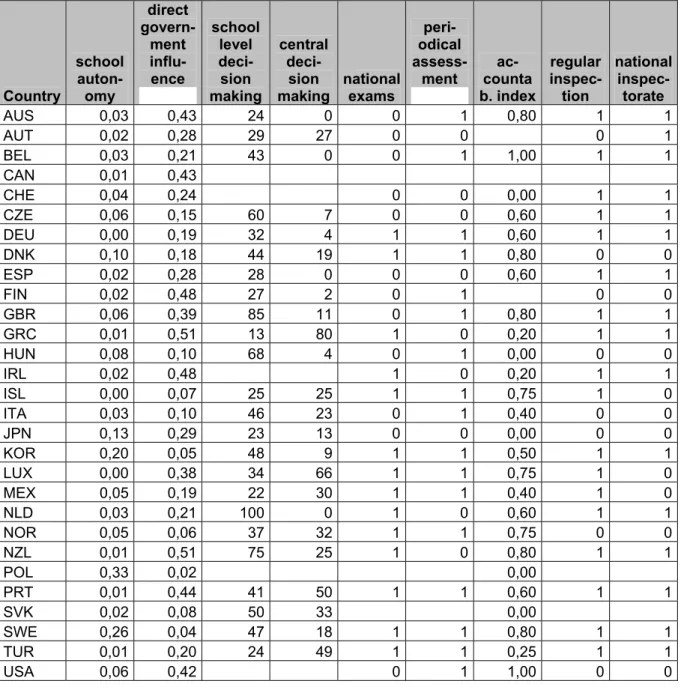
Table A2 Standardization proxies – centralization – country values
Country
school auton-
omy
direct govern-
ment influ- ence
school level deci-
sion making
central deci-
sion making
national exams
peri- odical assess-
ment ac- counta b. index
regular inspec- tion
national inspec-
torate
AUS 0,03 0,43 24 0 0 1 0,80 1 1
AUT 0,02 0,28 29 27 0 0 0 1
BEL 0,03 0,21 43 0 0 1 1,00 1 1
CAN 0,01 0,43
CHE 0,04 0,24 0 0 0,00 1 1
CZE 0,06 0,15 60 7 0 0 0,60 1 1
DEU 0,00 0,19 32 4 1 1 0,60 1 1
DNK 0,10 0,18 44 19 1 1 0,80 0 0
ESP 0,02 0,28 28 0 0 0 0,60 1 1
FIN 0,02 0,48 27 2 0 1 0 0
GBR 0,06 0,39 85 11 0 1 0,80 1 1
GRC 0,01 0,51 13 80 1 0 0,20 1 1
HUN 0,08 0,10 68 4 0 1 0,00 0 0
IRL 0,02 0,48 1 0 0,20 1 1
ISL 0,00 0,07 25 25 1 1 0,75 1 0
ITA 0,03 0,10 46 23 0 1 0,40 0 0
JPN 0,13 0,29 23 13 0 0 0,00 0 0
KOR 0,20 0,05 48 9 1 1 0,50 1 1
LUX 0,00 0,38 34 66 1 1 0,75 1 0
MEX 0,05 0,19 22 30 1 1 0,40 1 0
NLD 0,03 0,21 100 0 1 0 0,60 1 1
NOR 0,05 0,06 37 32 1 1 0,75 0 0
NZL 0,01 0,51 75 25 1 0 0,80 1 1
POL 0,33 0,02 0,00
PRT 0,01 0,44 41 50 1 1 0,60 1 1
SVK 0,02 0,08 50 33 0,00
SWE 0,26 0,04 47 18 1 1 0,80 1 1
TUR 0,01 0,20 24 49 1 1 0,25 1 1
USA 0,06 0,42 0 1 1,00 0 0
Table A3 Hierarchical linear regressions. The association of stratifying educational institu- tions and the educational inequality of opportunity
Mathematical and Reading Literacy, PISA 2003 Country level vari-
ables
Effects on the inter-
cept age of selection 9,85*
(5,07) number of school
types -1,37
(4,14)
ratio of vocational
training 0,601
(0,39)
academic selection 0,717
(0,48)
Effects on the ESCS age of selection -1,34*
(0,71) number of school
types -0,68
(1,40)
ratio of vocational
training 0,026
(0,05)
academic selection 0,0004
(0,05)
U_intcpt 33,00
U_escs 5,12
R 88,17
Level 1 units: 219043; Level 2 units: 29
Note: Coefficients for individual level variables are not shown. The titles of the regressions are the variables in- cluded as country level independent variables in the basic model. Missing values are imputed and controlled for;
robust standard errors are in parentheses; ***p<0,01; **p<0,05; *p<0,1. (r) - reverse hypothesized relationship
Table A4 Pairwise correlations of the stratification and standardization proxies
age of selection number of school types ratio of vocational training academic selection
school autonomy (r) 0,19 -0,10 0,01 0,14
(0,33) (0,59) (0,96) (0,47)
direct govt. Influence 0,34 -0,26 -0,37 -0,25
(0,08) (0,18) (0,05) (0,19)
school level decision making (r) -0,09 0,15 0,21 0,20
(0,69) (0,47) (0,32) (0,34)
central decision making 0,01 0,09 -0,24 -0,13
(0,97) (0,68) (0,26) (0,55)
national exam 0,02 0,00 -0,32 -0,26
(0,94) (1,00) (0,11) (0,20)
periodical assessment 0,05 -0,27 0,02 -0,34
(0,80) (0,18) (0,91) (0,09)
accountability index 0,29 -0,44 -0,03 -0,39
(0,15) (0,03) (0,87) (0,05)
regular inspection -0,07 0,25 -0,04 -0,11
(0,75) (0,22) (0,84) (0,60)
national inspectorate -0,17 0,30 0,18 -0,01
(0,40) (0,14) (0,37) (0,96)
Table A5 Hierarchical linear regressions. The association of stratifying and standardizing educational institutions and the educational inequality of opportunity
Mathematical and Reading Literacy, PISA 2003
Country level variables
Effects on the intercept age of selection 3,27 4,03
(3,71) (3,27)
accountability index 32,76*
(17,55)
central decision making -0,81**
(0,37)
Effects on the ESCS age of selection -0,87* -1,16**
(0,43) (0,44)
accountability index -1,61
(2,70)
central decision making -0,05
(0,04)
U_intcpt 34,77 33,85
U_escs 5,05 4,84
R 87,95 88,03 Level 1 units: 181434 169689
Level 2 units: 26 24
Note: Coefficients for individual level variables are not shown. The titles of the regressions are the variables in- cluded as country level independent variables in the basic model. Missing values are imputed and controlled for;
robust standard errors are in parentheses; ***p<0,01; **p<0,05; *p<0,1. (r) - reverse hypothesized relationship
9 References
Allmendinger, J. (1989). Educational Systems and Labor Market Outcomes. European Sociological Review, 5(3), 231-250.
Amermüller, A. (2005). Educational Opportunities and the Role of Institutions. ZEW Discussion Pa- pers, 2005(44).
Arnett, S. M. (2007). Influences of NAtional Education Policies on the Academic Achiecement of High- and Low-Social Status Students. Paper presented at the European Forum - Assessing the Quality of Education and Its Relationship with Inequality in European and Othe Modern Socie- ties, Florence.
Arum, R., & Shavit, Y. (1995). Secondary Vocational Education and the Transition from School to Work. Sociology of Education, 68(3), 187-204.
Betts, J. R., & Shkolnik, J. L. (2000). The Effects of Ability Grouping on Student Math Achievement and Resource Allocation in Secondary Schools. Economics of Education Review, 19.
Bishop, J., & Mane, F. (2004). Educational Reform and Disadvantaged Students: Are They Better or Worse Off? CESifo Working Paper, 1309.
Breen, R. (Ed.). (2005). Social Mobility in Europe. Oxford: Oxford University Press.
Bryk, A. S., & Raudenbush, S. W. (1992). Hierarchical linear models : applications and data analysis methods. Newbury Park: Sage Publications.
Carnoy, M., Loeb, S., & Smith, T. L. (2001). Do Higher State Test Scores in Texas Make for Better High School Outcomes? CPRE Research Report Series, RR-047.
Dolton, P. J. (2002). Improving Educational Quality: How Best to Evaluate Our Schools? (Discussion).
In Y. K. Kodryzcki (Ed.), Education in the 21st Century (pp. 225-235): Federal Reserve Bank of Boston.
Dustmann, C. (2004). Parental background, secondary school track choice, and wages. Oxford Eco- nomic Papers, 56(2).
Erikson, R., & Jonsson, J. O. (1996a). Explaining Class Inequality in Education: The Swedish Test Case. In R. Erikson & J. O. Jonsson (Eds.), Can Education Be Equalized? : Westview Press.
Erikson, R., & Jonsson, J. O. (Eds.). (1996b). Can Education Be Equalized? The Swedish Case in Comparative Perspecitve: Westview Press.
Fertig, M., & Kluve, J. (2005). The Effect of Age at School Entry on Educational Attainment in Ger- many. IZA Discussion Paper, 1507.
Gamoran, A. (1996). Curriculum Standardization and Equality of Opportunity in Scottish Secondary Education: 1984-90. Sociology of Education, 69(1), 1-21.
Green, A., Wolf, A., & Leney, T. (1999). Convergence and Divergence in European Education and Training Systems: Institute of Education University of London.
Hanushek, E. A., & Raymond, M. E. (2002). Improving Educational Quality? How Best to Evaluate Our Schools? Paper presented at the Education in the 21st Century: Meeting the Challenges of a Changing World.
Hanushek, E. A., & Wössmann, L. (2005). Does Educational Tracking Affect Performance and Ine- quality? Differences-In-Differences Evidence Across Countries. SIEPR Discussion Paper, 2004(26).
Horn, D. (2007). On The Importance of Within Country Standardization When Conducting Multilevel Analysis - an example of stratification and the educational inequality of opportunity Working Paper (Vol. 104): MZES.
Kerckhoff, A. C. (2000). Transition from School to Work in Comparative Perspective. In M. T. Hallinan (Ed.), Handbook of the Sociology of Education (pp. 453-474). New York: Kluwer.
Ladd, H. F. (2001). School-Based Educational Accountability Systems: The Promise and the Pitfalls.
National Tax Journal, LIV(2).
Marks, G. (2006). Are between- and within-school differences in student performance largely due to socio-economic background? Evidence from 30 countries. Educational Research, 48(1), 21- 40.
Murnane, R. J., & Levy, F. (2001). Will Standard-Based Reforms Improve the Education of Students of Color? National Tax Journal, LIV(2).
OECD. (2001). Knowledge and Skills for Life: first results from the OECD Programme for International Studnet Assessment (PISA) 2000: OECD.
OECD. (2004a). Education and Equity (No. February): OECD.
OECD. (2004b). Education at a Glance, OECD Indicators 2004: OECD.
OECD. (2004c). Learning for Tomorrow's World - First Results from PI SA 2003: OECD.
OECD. (2005a). Education at a Glance, OECD Indicators 2005: OECD.
OECD. (2005b). PISA 2003 Techincal Report: OECD.
OECD. (2007). Education at a Glance, OECD indicators 2007: OECD.
Robertson, D., & Symons, J. (2003). Self-Selection in the State School System. Education Economics, 11(3).
Shavit, Y., & Blossfeld, H.-P. (Eds.). (1993). Persistent Inequality: Chaniging Educational Attainment in Thirteen Countries. Oxford: Westview.
Shavit, Y., & Müller, W. (2000). Vocational Secondary Education, Tracking, and Social Stratification. In M. T. Hallinan (Ed.), Handbook of the Sociology of Education. New York: Kluwer.
Shavit, Y., & Müller, W. (Eds.). (1998). From School to Work, A Comparative Study of Educational Qualifications and Occupational Destinations. Oxford: Claredon Press.
Snijders, T. A. B., & Bosker, R. J. (1999). Mulilevel Analysis - An introduction to basic and advanced multilevel modeling. London: Sage.
Söderström, M., & Uusitalo, R. (2005). School choice and segregation: evidence from an admission reform. IFAU - working papers, 2005(7).
Wössmann, L. (2004). How Equal Are Educational Opportunities? Family Background and Student Achievementin Europe and the United States. IZA Discussion Paper(1284).
Wössmann, L. (2007). Fundamental Determinants of School Efficiency and Equity: German States as a Microcosm for OECD Countries. CESifo Working Paper(1981).