A note on the importance of within country standardization when
conducting multilevel analysis
An example of stratification and the
educational inequality of opportunity
Daniel Horn
Daniel Horn
A note on the importance of within country standardization when conducting multilevel analysis
An example of stratification and the educational inequality of opportunity
Arbeitspapiere – Working Papers Nr. 104, 2007
Mannheimer Zentrum für Europäische Sozialforschung
Horn, Daniel:
A note on the importance of within country standardization when conducting multilevel analysis : an example of stratification and the educational inequality of opportunity / Daniel Horn. – Mannheim: 2007
(Arbeitspapiere - Mannheimer Zentrum für Europäische Sozialforschung ; 104) ISSN 1437-8574
Not available in book shops.
Token fee: € 3,00
Purchase: Mannheimer Zentrum für Europäische Sozialforschung (MZES), D – 68131 Mannheim WWW: http://www.mzes.uni-mannheim.de
Editorial Note:
Daniel Horn is a PhD student at the Central European University in Budapest, and a junior research fellow at the Institute of Economics of the Hungarian Academy of Sciences. The paper was prepared during his stay at the Mannheim Centre for European Social Research (MZES) in 2007 while working on the project "Educational Systems and Labor Markets in Central and Eastern Europe". His main research interests are the effectiveness and equality of education, and the political economy of education.
Abstract
Most of the internationally comparable datasets are designed to be mean-comparable, i.e. the means (and high and low values, percentages…etc.) of the variables can be compared across countries. But it is less obvious that the standard deviations of the same variables are also comparable, or that the unit-movements (regression coefficients) are comparable at all. Thus when conducting multilevel analyses one must standardize the variables of interest within country in order for the regression coefficients to be comparable across countries; i.e. transfer the standard deviations to be the same in every country. Hence, the effort to obtain an additional unit on the variable becomes the same across countries. This paper uses a multilevel model on the PISA 2003 dataset to illustrate the size of the bias that occurs when one misses to standardize the variables. An example on the effects of stratifying educational institutions on the inequality of opportunity is presented.
Contents
Introduction ... 1
An imaginary example ... 2
Example of Germany and Austria... 4
An application in multilevel analysis: the inequality of educational opportunity... 6
Conclusion ... 11
Appendix ... 12
References... 13
A r b e i t s p a p i e r e - M a n n h e i m e r Z e n t r u m f ü r E u r o p ä i s c h e S o z i a l f o r s c h u n g 1 0 4
- 1 -
Introduction
A considerable debate surrounds the impact of institutions on educational inequalities. The current large cross-country “mean-comparable” datasets, such as PISA, PILRS, TIMSS or IALSS1 provide a historical opportunity to test the strength of association between the educational institutions and the inequalities in education.
Stratification is commonly acknowledged to be positively associated both with the inequality of outcome and the inequality of opportunity. There have been a great number of studies evaluating the strength of relationship between the stratifying educational institutions and the inequality in education.
Inequality of outcome is often proxied by the standard deviation of the outcome (Hanushek &
Wössmann, 2005), while the inequality of opportunity is commonly understood as the effect of parental background on the outcome (Ammermüller, 2005; Arnett, 2007; Wössmann, 2004, 2007).
Most of the studies, and indeed most of the policy-making as well, take the fact that the utilized international datasets are designed to be internationally comparable for granted, and focus more on the substantive questions, missing an important shortcoming of all the datasets. All of the above datasets are designed to be mean-comparable, i.e. the means (and high and low values, percentages…etc.) of the variables can be compared across countries, but it is less obvious that the standard deviations of the same variables are also comparable, or that the unit-movements (regression coefficients) are comparable at all.
This question is especially important if we quantify the educational inequality of opportunity as the parental background effect on the outcome. That is, most studies regress literacy scores on some socio-economic background of the students, and compare the size of the coefficients across countries, arguing that these coefficients show the size of the inequality of opportunity. However it is not evident that moving one unit upwards on some mean-comparable scale would require the same effort in country A as it would in country B. In the relatively homogeneous country A, where the spread of the parental background is smaller, one non-standardized unit movement could require more effort than in country B, which is more heterogeneous and the spread is larger. In a homogeneous country, because the relative differences are smaller, moving one unit up would mean greater social mobility as compared to a one unit upward movement in a heterogeneous country.
To give a short example: although the mean of the years of parental education across countries are usually considered to be mean-comparable, for instance the average years of schooling of the parents of the 15-year-olds in the PISA study in Germany was 13,04 years, while in Austria it was 13,05.
Although we might claim that German and Austrian parents have similar years of schooling in
1 PISA – Programme for International Student Assessment, PIRLS – Progress in International Reading Literacy Study, TIMSS – Trends in International Mathematics and Science Study, IALS – International Adult Literacy Survey
A r b e i t s p a p i e r e - M a n n h e i m e r Z e n t r u m f ü r E u r o p ä i s c h e S o z i a l f o r s c h u n g 1 0 4
- 2 -
average, it would be incorrect to claim that to obtain an additional year of schooling requires the same effort in both of these countries (see below); hence, if the efforts differ, their impact on some additional dependent variable cannot be compared properly.
The solution to this problem is straightforward and easy: one must standardize the variables of interest within country in order for the regression coefficients to be comparable across countries, but keep their original mean; i.e. transfer only the standard deviations to be one. Hence, the effort to obtain an additional unit on the variable becomes the same across observations.2 Note, that the variables should keep their initial means, so that no unnecessary information loss occurs.3 From now on I will use standardization as a synonym for transforming the variables to have a standard deviation of one while keeping their original means, as opposed to a more general understanding where standardization also involves the centering of the variable to have a mean of zero.
Most of the studies tackling the issue of educational inequality of opportunity highlight that the social background effect on educational outcomes in countries with stratifying institutions is higher than in countries without stratifying institutions. In this analysis I am not challenging this statement, but I emphasize that it is important to standardize the variables within countries if the aim is to compare the unit movements (the betas) across countries, otherwise the results are not really interpretable.
In the following chapters I will elaborate on this idea, and show a concrete example on how the results might alter when we use the original (non-, or across country standardized) and the within country standardized variables. I will use the example of stratifying institutions. The research on the strength of relationship between stratification and the inequality of educational opportunity provide an excellent playground for my purposes.
An imaginary example
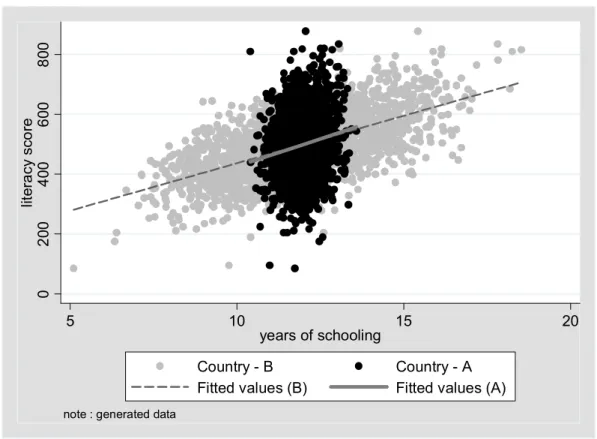
Let us assume that there are two countries, A and B, where the impact of the parental years of schooling on the student’s literacy score is the same. The only difference between these countries is the spread of the years of schooling; while country A has a small variance (homogeneous), country B is rather heterogeneous. The variance of the years of schooling variable is greater in country B than in country A. (See figure 1 below). The mean of the years of schooling and also the variance and the mean of the literacy score are the same in both countries.
2 This issue was also brought up in the Box 13.1 of the PISA 2003 Data analysis manual (OECD, 2005b, 169)
3 See Kreft (1995) for a convincing argumentation on why one should think twice before centering the variables around the group mean.
A r b e i t s p a p i e r e - M a n n h e i m e r Z e n t r u m f ü r E u r o p ä i s c h e S o z i a l f o r s c h u n g 1 0 4
- 3 -
Figure 1 – The association between parental years of schooling and student literacy scores. An imaginary example. Non-standardized values.
0200400600800literacy score
5 10 15 20
years of schooling
Country - B Country - A
Fitted values (B) Fitted values (A)
note : generated data
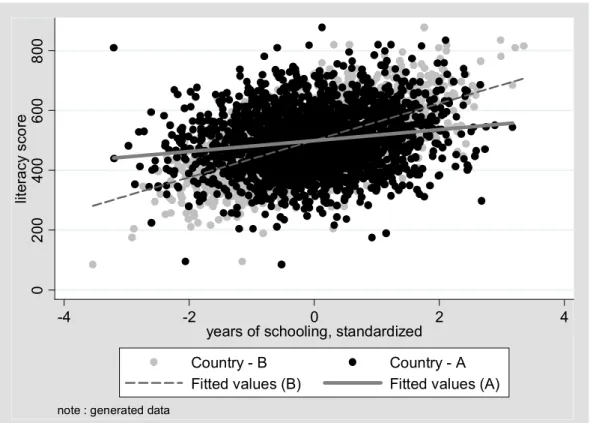
Most of the studies looking at this data would understand that these countries have the same level of inequality of opportunity: one additional year of parental schooling has the same impact on the students’ literacy score. However, substantially it is much harder to obtain one additional year in a homogeneous country than in a heterogeneous country. In country A, where most of the population have around 12 years of schooling (e.g. because it is compulsory to have at least this much on the one hand, and there are few higher educational institutes on the other), to obtain one more or one less year of schooling requires a significantly greater effort than in country B, where the education system is different. Thus if the aim is to compare the unit movements across countries it is necessary to standardize the variable within countries, so that a unit movement would require the same effort. After changing the standard deviation to one the inequality of opportunity in country B will be higher, than in country A. (See figure 2)
A r b e i t s p a p i e r e - M a n n h e i m e r Z e n t r u m f ü r E u r o p ä i s c h e S o z i a l f o r s c h u n g 1 0 4
- 4 -
Figure 2 - The association between parental years of schooling and student literacy scores. An imaginary example. Standardized values of years of schooling.
0200400600800literacy score
-4 -2 0 2 4
years of schooling, standardized
Country - B Country - A
Fitted values (B) Fitted values (A)
note : generated data
Example of Germany and Austria
The two bordering countries of Germany and Austria show very similar results on the PISA 2003 study. The average mathematical literacy of the German 15 year-olds was 503 points with a standard deviation of 103 while the average Austrian pupil gained 506 points, with a standard deviation of 93.
The average years of parental schooling, as mentioned above, was 13,05 and 13,04 respectively.
However there is a significant difference in the spread of this variable: the standard deviation of the years of schooling is 3,93 for Germany and 2,67 for Austria.
Initially the association between the non-standardized years of schooling and the mathematical literacy was very much the same. (Figure 3.) After standardizing the years of schooling the associations became much more pronounced for Germany, suggesting that the German inequality of opportunity is greater compared Austria, than the raw data would suggest. (Figure 4.) Again, the within country standardized years of schooling takes into account the country specific characteristics of the educational institutions (and other factors that might effect this variable) by comparing the individual to the mean years of schooling within his/her own country, and by converting the years to some a more general unit (standard deviation) that helps us to approximate the distance (deviation) from the mean.
Although the German and the Austrian education system is very similar, this quick result suggests that there should be differences between the two systems in how difficult it is to obtain an additional year of schooling.
A r b e i t s p a p i e r e - M a n n h e i m e r Z e n t r u m f ü r E u r o p ä i s c h e S o z i a l f o r s c h u n g 1 0 4
- 5 -
Figure 3 – The non-standardized parental years of schooling gradients of Austria and Germany
200400600800literacy score
0 5 10 15 20
years of schooling
Austria Germany
Fitted values (Aut) Fitted values (Ger)
note : PISA 2003
Figure 4 – The standardized parental years of schooling gradients of Austria and Germany
200400600800literacy score
8 10 12 14 16
years of schooling, standardized
Austria Germany
Fitted values (Aut) Fitted values (Ger)
note : PISA 2003
A r b e i t s p a p i e r e - M a n n h e i m e r Z e n t r u m f ü r E u r o p ä i s c h e S o z i a l f o r s c h u n g 1 0 4
- 6 -
The years of schooling, although widely used by economists, raise some important issues about the processes through which inequalities might be inherited from parents to children: years of schooling proxy the educational achievements only, and leaves other important factors such as the cultural capital or the impact of income or wealth. This is the reason why most researchers tend to use a complex index of socio-economic status that is designed to incorporate most of the possible ways of human/cultural/economic capital transfer.
Moreover, if one would like to compare the inequality of opportunity between countries the simple bivariate association might be misleading. The parental background is just one of the factors that affect the literacy score, and if we do not control for other things, like gender or grade, the estimated coefficients will surely be biased.
In the following chapter I introduce the economic, social and cultural status index (ESCS), developed by the OECD (2005c), and show that the same shortcomings apply to this index as well, and I illustrate how a multilevel multivariate analysis of the PISA 2003 data would lead to different conclusions with and without the within country standardization.
An application in multilevel analysis: the inequality of educational opportunity
The same problem of unit-movement comparability arises when we look at the generated socio- economic status indexes provided by international datasets, such as the economic, social and cultural status index (ESCS) in the PISA 2003 data. The OECD has generated this comprehensive index to try to incorporate three channels through which parental effects might work. (OECD, 2005c, 316) It includes the highest level of parental education (in number of years of education), highest parental occupation (ISCO codes - another generated index) and a number of home possessions; these are assumed to indicate the education, the occupational status and the income of the parents.
Most analyses with the PISA data use this index to proxy the socio-economic status. The index was estimated on the country-pooled dataset and was standardized to have a zero mean and unit standard deviation across-countries. When comparing countries one might declare that the average socio- economic status in Germany (0,16) is higher than in Austria (0,06), or that Germany is more heterogeneous than Austria (SDs are 0,98 and 0,85 respectively). However, since the index itself includes variables (such as the years of schooling) that are mean-comparable, but where the comparison of the unit-movements is inappropriate, it should also be within-country standardized when comparing the estimated regression coefficients. In short, the unit movement on the ESCS means different things in different countries; it is only adequate to see where one stands as compared to the international mean of 0.
Note moreover, that even if the unit-movements within countries are not relative (i.e. it requires the same effort to move one standard deviation in every country), within country standardization would not
A r b e i t s p a p i e r e - M a n n h e i m e r Z e n t r u m f ü r E u r o p ä i s c h e S o z i a l f o r s c h u n g 1 0 4
- 7 -
change the results; but if unit-movements are incomparable, within standardization helps the problem.
Conclusively, one should always standardize within country, when comparing the coefficients.
In order to test the association between the educational inequality of opportunity and educational stratification I use the OECD PISA 2003 data (OECD, 2004) and other OECD sources – such as the Education at a Glance (EAG) (OECD, 2005a) – for the institutional proxies. I utilize a two-level hierarchical mixed model (see Bryk & Raudenbush, 1992; Snijders & Bosker, 1999) to estimate the coefficients of the individual-level ESCS variable, and show how these differ between countries if we use non-standardized or standardized variables.
A multilevel model – either hierarchical or two-step (e.g. Lewis & Linzer, 2005) – allows the researcher to test not only the differences between the means of an outcome variable (literacy in this case) but also to see if an individual level independent variable (e.g. ESCS) associates differently with the outcome between countries, and to test whether there are some second-level (country-level) variables that correlates with this varying association.
I have used the following model. The first level estimation is (1) Literacy=β0+β1*ESCS+Σβi*X+r i=2..n
where β is the estimated individual level coefficient, n is the number of variables in the equation, r is the error term, ESCS stands for the economic, social and cultural background, and X is a vector of individual characteristics, such as grade, age, gender and immigrant status. The outcome (Literacy) is the mathematical and reading literacy plausible values in the PISA 2003 data. The dataset provides 5 plausible values for each literacy domain (5 for mathematics and 5 for reading in this case), with suggestions that the researcher uses all of these for a more precise estimation. The equation should be estimated as many times as many plausible values are utilized, and the coefficients and standard errors should be estimated using the results of the separate regressions (for details on the estimation procedure see: OECD, 2005c). I have imputed the first level missing values firstly by using other available information from the dataset,4 and secondly by substituting the country mean. Additional control dummies for the imputed values are included in the estimation.
The country level estimations are (2) β0=δ00+ δ01*INST+u0
(3) β1=δ10+ δ11*INST+u1
where δ is the estimated coefficient, and u0 and u1 are the country level error terms. Its sub-indexes are defined as follows: the first index refers to the number of the variable on the individual level, and
A r b e i t s p a p i e r e - M a n n h e i m e r Z e n t r u m f ü r E u r o p ä i s c h e S o z i a l f o r s c h u n g 1 0 4
- 8 -
the second represents the number on the country level. INST is an institutional proxy, such as the age of selection, academic selection, number of school types and the ratio of vocational training, introduced in more detail below.
Substituting (2) and (3) into (1) I get:
(4a) Literacy= δ00+ δ01*INST+u0+( δ10+ δ11*INST+u1)*ESCS+Σβi*X+r rearranging it, I get
(4b) Literacy= δ00+δ10*ESCS+δ01*INST+δ11*INST*ESCS+Σβi*X+(r+u0+u1*ESCS)
where the coefficients of interest are the δ10 that is the effect of the ESCS on the literacy scores, that proxies the inequality of educational opportunity and the δ11 that shows how the different institutions affect the strength of the association between the socio-economic status and the literacy scores.
The estimated parameters of the multilevel (non-standardized and standardized) regressions are in table 1. In the standardized regression the ESCS index was standardized within country to have a standard deviation of 1, while the standard deviations of the ten plausible values were transformed to be 100 within country. The initial means of both the ESCS variable and the outcome variables were kept so no unnecessary information is lost (Kreft, 1995) and the levels of literacy also remained comparable. Since the units of the estimated non-standardized and standardized ESCS coefficients are not comparable across the two types of regressions (one unit movement means different things in each of them), it is only rational to look at the significance levels, or the t-ratios when comparing the associations.
I must emphasize that both of the variables of interest (ESCS and literacy) were standardized in the standardized regressions.5 Consequently, those countries that are more heterogeneous according to their socio-economic indexes became more unequal, which effect interacts with the literacy- standardization effect, where those countries that have a larger literacy spread (easier to gain an additional score for anyone) became more equal.
From the analysis below it seems that not standardizing the variables within country affects the results by altering the significance of the included institutional variables, but does not affect the overall picture: the association between the inequality of opportunity and stratification is still positive.
To test the associations I have used the following proxies of stratification:
(See table A1 in the appendix for the descriptive data)
4 For instance to impute the missing values of the ESCS I used the predicted values from an OLS regression of ESCS on years of parental education, parental work status and home possessions. Where all of these were missing I used the country mean to impute missing ESCS values.
5 The arguments for standardizing the literacy score is the same as for the ESCS variable.
A r b e i t s p a p i e r e - M a n n h e i m e r Z e n t r u m f ü r E u r o p ä i s c h e S o z i a l f o r s c h u n g 1 0 4
- 9 -
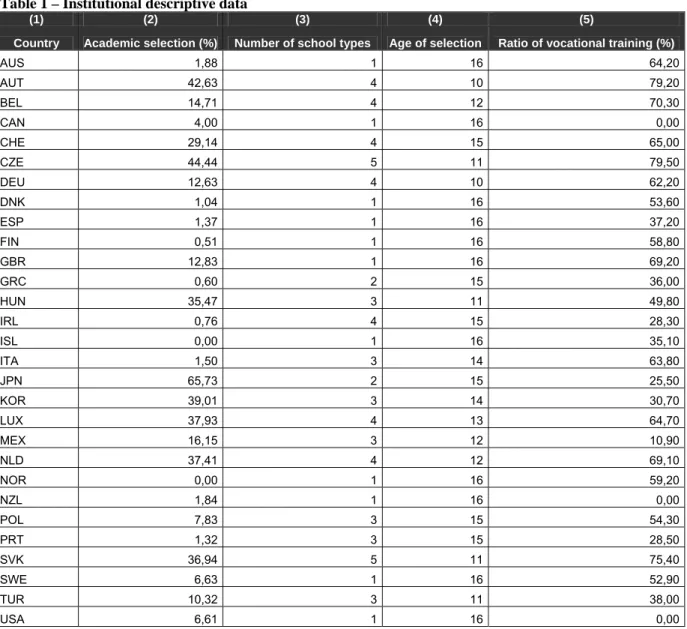
(-) Age of selection: First age of selection in the education system (EAG 2005, D6.1);
(+) Academic selection: Ratio of school heads that reported that the school considers previous academic record or the results of an entrance exam as prerequisite for attendance (PISA 2003 School questionnaire: Question 10);
(+) Number of school types: Number of school types or distinct educational programs available for the 15-year-olds (EAG 2005, D6.1);
(+) Ratio of vocational training: Percentage of upper secondary enrollment in pre-vocational or vocational programs (EAG 2005 C2.1);
Note: The signs in parentheses show the suspected association between the proxies and the unobserved stratification dimensions.
Table 1 below shows the estimated hierarchical regressions. Each estimation contains only one institutional proxy, because the indicators are highly correlated and the results would not be significant if more were included due to the small number of cases. In general it seems that stratification associates positively with the inequality of educational opportunity; all of the proxies show the predicted signs.
The inequality advancing effect of the early age of selection to secondary level – the most straightforward indicator of early tracking – becomes more pronounced if we look at the standardized effects (model 2). Similarly, the number of school types shows significant association with the standardized effects (model 4). However, the initially strongly significant impact of the academic selection (model 3) and also the weakly significant ratio of vocational training (model 5) turn out to be non-significant, when looking at the standardized estimations.
Both the academic selection and the ratio of vocational training carry an additional connotation besides indicating a stratified educational system. The academic selection – the percentage of school heads that reported the selection of children according to their previous academic record or based on their entrance exam results – suggests not only a selective but also a merit-selective system. Although it is well noted that ability or merit is highly correlated with social status, especially at an early age, it seems that merit-selective systems do not contribute significantly to the educational inequality of opportunity. Moreover, the ratio of vocational training indicates not only the selective features of the system, but also its vocational/practical characteristics. The data shows that the ratio of the vocationally trained pupils does not associate with the parental background effect, with the inequality of educational opportunity.
The two other straightforward and widely used indicators of stratification, namely the age of selection and the number of school types, show clear and significant relationship with the inequality measure.
- 10 -
A r b e i t s p a p i e r e - M a n n h e i m e r Z e n t r u m f ü r E u r o p ä i s c h e S o z i a l f o r s c h u n g 1 0 4
- 11 -
Conclusion
The paper argues that when one wants to test the effect of country level variables on individual level effects and thus conducts a multi-level cross-country analysis, it is crucial to standardize the variables in focus within countries. Standardization within countries is necessary so that the effort of obtaining an additional unit on the variable is the same across countries. When using the notion standardization I mean the transformation of the variable to have a standard deviation 1, but to keep its original mean.
The recently flourishing research on institutional effects on the inequality of educational opportunity is used as an example to show how results might differ if one misses to standardize the data within countries. The results underline the well-known finding that stratifying institutions associate positively with the inequality of educational opportunity understood as the impact of the pupils’ socio-economic background on their literacy scores. However, it is also shown that different indicators of stratification might provide different results when one overlooks the within country standardization. The two widely used and straightforward proxies of early selection – the age of selection and the number of school types – show more pronounced and significant effect when within country standardization is used, but academic selection and the ratio of vocational training, two less straightforward but still commonly used proxies, are associated significantly with the inequality of opportunity only if one uses the incorrect non-standardized measures.
In general, the paper suggests that one should use within country standardized measures when comparing institutional effects on individual level associations, otherwise the results might not be clearly interpretable.
A r b e i t s p a p i e r e - M a n n h e i m e r Z e n t r u m f ü r E u r o p ä i s c h e S o z i a l f o r s c h u n g 1 0 4
- 12 -
Appendix
Table 1 – Institutional descriptive data
(1) (2) (3) (4) (5)
Country Academic selection (%) Number of school types Age of selection Ratio of vocational training (%) AUS 1,88 1 16 64,20 AUT 42,63 4 10 79,20 BEL 14,71 4 12 70,30
CAN 4,00 1 16 0,00
CHE 29,14 4 15 65,00 CZE 44,44 5 11 79,50 DEU 12,63 4 10 62,20 DNK 1,04 1 16 53,60 ESP 1,37 1 16 37,20 FIN 0,51 1 16 58,80 GBR 12,83 1 16 69,20 GRC 0,60 2 15 36,00 HUN 35,47 3 11 49,80 IRL 0,76 4 15 28,30 ISL 0,00 1 16 35,10 ITA 1,50 3 14 63,80 JPN 65,73 2 15 25,50 KOR 39,01 3 14 30,70 LUX 37,93 4 13 64,70 MEX 16,15 3 12 10,90 NLD 37,41 4 12 69,10 NOR 0,00 1 16 59,20
NZL 1,84 1 16 0,00
POL 7,83 3 15 54,30 PRT 1,32 3 15 28,50 SVK 36,94 5 11 75,40 SWE 6,63 1 16 52,90 TUR 10,32 3 11 38,00
USA 6,61 1 16 0,00
A r b e i t s p a p i e r e - M a n n h e i m e r Z e n t r u m f ü r E u r o p ä i s c h e S o z i a l f o r s c h u n g 1 0 4
- 13 -
References
Ammermüller, A. (2005). Educational Opportunities and the Role of Institutions. ZEW Discussion Papers, 2005(44).
Arnett, S. M. (2007). Influences of National Education Policies on the Academic Achievement of High- and Low-Social Status Students. Paper presented at the European Forum - Assessing the Quality of Education and Its Relationship with Inequality in European and Other Modern Societies, Florence.
Bryk, A. S., & Raudenbush, S. W. (1992). Hierarchical linear models: applications and data analysis methods. Newbury Park: Sage Publications.
Hanushek, E. A., & Wössmann, L. (2005). Does Educational Tracking Affect Performance and Inequality? Differences-In-Differences Evidence Across Countries. SIEPR Discussion Paper, 2004(26).
Kreft, I. G. G. (1995, April 18-22). The Effects of Centering in Multilevel Analysis: Is the Public School the Loser or the Winner? Paper presented at the Annual Meeting of the American Educational Research Association, San Francisco, CA.
Lewis, J. B., & Linzer, D. A. (2005). Estimating Regression Models in Which the Dependent Variable Is Based on Estimates. Political Analysis, 13, 345-364.
OECD. (2004). Learning for Tomorrow's World - First Results from PI SA 2003: OECD.
OECD. (2005a). Education at a Glance, OECD Indicators 2005: OECD.
OECD. (2005b). PISA 2003 Data Analysis Manual: OECD.
OECD. (2005c). PISA 2003 Technical Report: OECD.
Snijders, T. A. B., & Bosker, R. J. (1999). Multilevel Analysis - An introduction to basic and advanced multilevel modeling. London: Sage.
Wössmann, L. (2004). How Equal Are Educational Opportunities? Family Background and Student Achievement in Europe and the United States. IZA Discussion Paper (1284).
Wössmann, L. (2007). Fundamental Determinants of School Efficiency and Equity: German States as a Microcosm for OECD Countries. CESifo Working Paper (1981).