microscopy
Cite as: Appl. Phys. Lett. 114, 143103 (2019); https://doi.org/10.1063/1.5085747
Submitted: 14 December 2018 . Accepted: 25 March 2019 . Published Online: 10 April 2019 Alexander Liebig , and Franz J. Giessibl
ARTICLES YOU MAY BE INTERESTED IN
The qPlus sensor, a powerful core for the atomic force microscope
Review of Scientific Instruments 90, 011101 (2019); https://doi.org/10.1063/1.5052264
Evaluating the potential energy landscape over single molecules at room temperature with lateral force microscopy
Applied Physics Letters 112, 181601 (2018); https://doi.org/10.1063/1.5026671
Switching dynamics of ferroelectric HfO2-ZrO2 with various ZrO2 contents
Applied Physics Letters 114, 142902 (2019); https://doi.org/10.1063/1.5093793In-situ characterization of O-terminated Cu tips for high-resolution atomic force microscopy
Cite as: Appl. Phys. Lett.114, 143103 (2019);doi: 10.1063/1.5085747 Submitted: 14 December 2018
.
Accepted: 25 March 2019.
Published Online: 10 April 2019
AlexanderLiebiga) and Franz J.Giessiblb) AFFILIATIONS
Institute of Experimental and Applied Physics, University of Regensburg, D-93040 Regensburg, Germany
a)alexander.liebig@ur.de
b)franz.giessibl@ur.de
ABSTRACT
Functionalizing a metal tip with a single CO molecule (CO tip) leads to an unprecedented spatial resolution of small organic molecules by frequency-modulation atomic force microscopy (FM-AFM) at low temperatures. O-terminated Cu tips (CuOx tips) show comparable imag- ing capabilities as CO tips but exhibit a much stiffer apex. So far, to verify tip functionalization with oxygen (i.e., CuOx tips), scanning tunneling microscopy and AFM images, together with force spectroscopy curves of copper oxide domains, have been compared with calcu- lated data for different tip models. Here, we apply the carbon-monoxide front atom identification (COFI) method and additional force spec- troscopy to characterize CuOx tipsin-situon a Cu(110) surface. In COFI, a single CO molecule adsorbed on a Cu surface is imaged to atomically resolve the tip apex. Based on our findings, we suggest accompanying tip fingerprinting with COFI and force spectroscopy to iden- tify the atomic and chemical compositions of the apex of CuOx tips for high-resolution AFM experiments.
Published under license by AIP Publishing.https://doi.org/10.1063/1.5085747
The spatial contrast in scanning tunneling microscopy (STM)1 and atomic force microscopy (AFM)2depends crucially on the exact geometrical structure and chemical species of the tip apex.3The spatial resolution can be increased by controlled modification of the tip apex.
In STM, it was found that by trapping a single hydrogen molecule in the tip-sample junction, the internal structure of a molecule adsorbed on a surface can be resolved.4Using vertical manipulation,5individual atoms and molecules can be picked up with an STM tip to functional- ize the tip apex.6,7CO-terminated metal tips (CO tips), which can be prepared by picking up a single carbon monoxide molecule from a Cu surface,6enable submolecular resolution imaging of organic molecules and bond-order discrimination by AFM.8,9Terminating the tip apex with noble gas atoms achieves a similar spatial resolution.10Although functionalizing the tip with a CO molecule yields an increase in the spatial resolution, interpretation of atomic-scale contrast with these tips is highly nontrivial: When the tip interacts with the sample, lateral forces cause lateral deflection of the CO molecule that can create arti- facts in the images and hence inhibit a direct interpretation of data.9,11–14Recently, M€onig and co-workers proposed using oxygen- terminated Cu tips (CuOx tips) that show a comparable spatial resolu- tion and much higher lateral stiffness of the tip apex.15,16With such CuOx tips, it is for example possible to quantitatively measure intra- molecular bond lengths,16which appear elongated when using CO tips,9and to scan with video rate imaging velocities theoretically.17
While the functionalization of a metal tip with a CO molecule is a well-controlled process,6CuOx tips are prepared by repeated colli- sions of the tip with an oxidized Cu surface.15This is in general a ran- dom process that involves many atoms of both the tip and the surface, which means that the exact atomic structure and the chemical species of the atoms composing the tip apex after the collision are not known.
Knowledge of the chemical and structural identities of the tip is of cru- cial importance, especially when experiments are accompanied by the- oretical calculations involving the tip structure and its chemical composition, and hence, these properties should be well-characterized in the experiment. So far, the verification of tip functionalization with oxygen relies on comparing experimental results with calculations:
The experimental STM and AFM images of copper oxide domains are compared with density functional theory (DFT) and nonequilibrium Greens function (NEGF) calculations to determine the chemical iden- tity of the tip apex.18–21A description of the atomic tip apex structure requires a large tip model database obtained after extensive and time- consuming simulations, and precise determination of the structural apex composition is not always possible.21
Conversely, a carbon-monoxide molecule adsorbed on a Cu(111) surface can be used to image the tip apex with atomic resolution, a technique known as the carbon-monoxide front atom identification (COFI) method.22–24In COFI, the tip is scanned at a constant height above the CO molecule which acts as a probe, and the resulting images
reveal the atomic configuration of the tip apex [compareFig. 1(a)].
Additionally, the chemical species of atoms can be distinguished by force spectroscopy. Sugimoto and co-workers25showed that the chem- ical species of different surface atoms can be determined by analyzing the minimum of the short-range interaction between the tip and the individual surface atoms. By knowing the chemical species on the sur- face, this concept can be transferred to determine the chemical species of the tip apex atom: Hofmann and co-workers26 distinguished between the chemical species of the frontmost atom of different single-atom metal tips using force spectroscopy above the same chemi- cal species on the surface, i.e., a single CO molecule adsorbed on Cu(111).
In this Letter, we present experimental characterization of CuOx tips by a combination of COFI and force spectroscopy on a Cu(110) surface. In this way, both the structural and the chemical compositions of the tip apices can be determinedin-situ.
The experiments were carried out on a commercial low- temperature scanning tunneling/atomic force microscope operating at a temperature of 4.4 K (LT STM/AFM, Scienta Omicron GmbH, Taunusstein). We used a qPlus sensor27 equipped with an electro- chemically etched tungsten tip, with a resonance frequency off0¼ 46 597 Hz, a stiffness of k¼1800 Nm1, and a quality factor of Q¼482 321. The sensor was operated at a constant amplitude of A¼50 pm in the frequency-modulation mode (FM-AFM).28Except when explicitly mentioned, all data presented here are raw data.
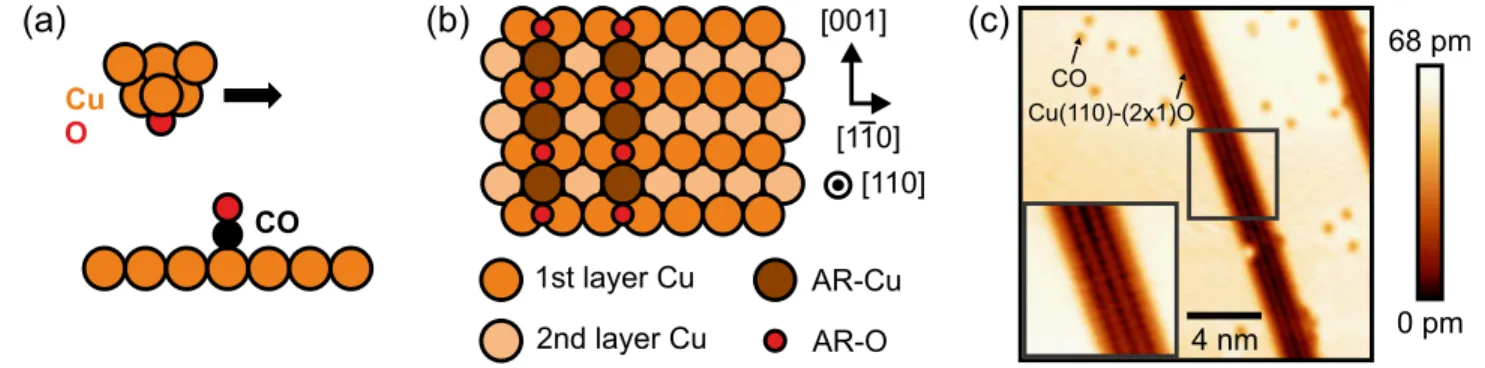
The CuOx tips were characterized and prepared following the procedure described by M€onig and co-workers.15Upon low oxygen coverages, Cu(110) undergoes a (21)-O added-row (AR) recon- struction [shown inFigs. 1(b)and1(c)], forming striped copper oxide domains along the [001] direction.15,29–32To functionalize the tip apex with oxygen, the tip is repeatedly dipped into the oxide domains until a notable enhancement in corrugation within the oxide is observed:
Fig. 1(c)shows an STM image recorded in the constant-current mode with a bare metal tip, resolving the copper oxide domains as darker regions than the clean Cu surface. For comparison, inFig. 2(d), an STM image of the AR reconstruction recorded with a CuOx tip is shown: Here, the copper oxide domain shows a larger corrugation (see line profiles in Fig. S1 in thesupplementary material), which indicates a change in the chemical species of the tip terminating atom.21In order to characterize the tips using the COFI method, we additionally dosed approximately 0.005 ML of carbon-monoxide on the surface
[seeFig. 1(c)]. It should be noted that the COFI method exploits the vertical on-top adsorption configuration of individual CO molecules on Cu(111) with the O atom pointing away from the surface. Here, we use COFI on a Cu(110) surface, where CO also adsorbs in this vertical on-top configuration as determined by photoelectron diffraction.33
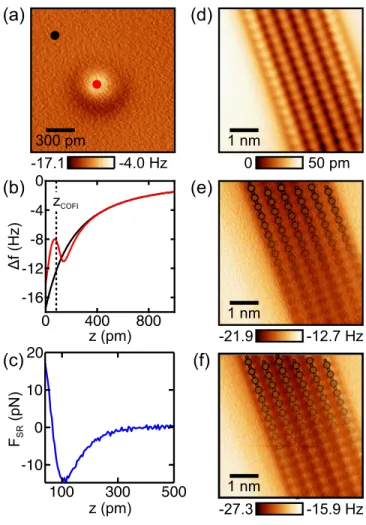
The interaction of a CuOx tip with a CO molecule adsorbed on Cu(110) as a function of tip-sample distance is comparable to the find- ings of Sunet al.for a CO tip on CO/Cu(111).11Figure 2(b)shows fre- quency shift vs distanceDf(z) spectra recorded with a CuOx tip above the CO molecule and above the bare Cu(110) surface (red and black curves, respectively). The zero point of the experimentalzaxis defines the closest tip-sample approach in the measurements with this tip.
Approaching the surface from z¼1 nm, theDf values are initially more negative above the CO molecule as compared to the bare Cu sur- face, which we attribute to van der Waals attraction between the tip and the CO molecule. Upon further approach, the spectrum above the CO reaches a minimum and becomes less negative, which can be assigned to stronger contribution of short-range Pauli repulsion between the tip and the CO molecule. At this point of maximum con- trastzCOFI, we record a constant-height AFM image [a COFI image, Fig. 2(a)] of the CuOx tip, resolving a single bright, circularly symmet- ric feature with a dark ring around it. We show COFI images of our CuOx tip as a function of tip-sample distance in thesupplementary materialto further illustrate this contrast evolution (see Fig. S2).
The short-range component of the interaction between the tip and the CO molecule can be obtained by performing the “on-off” sub- traction method.11,26,36 We subtracted the Df(z) spectrum recorded above the bare Cu(110) surface from the spectrum recorded above the CO molecule and calculated the short-range force FSR(z) via the Sader-Jarvis force deconvolution method [compare Fig. 2(c)].34 The force deconvolution has been explicitly checked for well-posed behavior.37We obtain a short-range force minimum of15 pN for the CuOx tip. In thesupplementary material, we presentFSR(z) spectra for twelve different CuOx tips, which all exhibit short-range force min- ima between15 pN and30 pN (see Fig. S3). For comparison, we furthermore show a COFI image and FSR(z) spectra of a CO- terminated tip recorded on CO/Cu(110) in thesupplementary mate- rial(see Fig. S4), also exhibiting a short-range force minimum of15 pN. The values we obtained for both the CuOx and CO tips are close to the value obtained with a CO tip on Cu(111)11and show that oxi- dizing the tip apex effectively reduces the chemical reactivity:15short-
FIG. 1.(a) Schematic of the COFI method: An AFM tip, in this case, a CuOx tip, is scanned at a relatively close distance at a constant height above a CO molecule adsorbed on the Cu(110) surface. (b) Top view of the Cu(110)-(21)O added-row (AR) reconstruction.15(c) STM overview image of the Cu(110) surface recorded with a metal tip.
Dark, striped regions represent the copper oxide domains on Cu(110). Single, dark points are individual CO molecules adsorbed on the bare Cu(110) surface. Imaging parame- ters: sample biasVb¼ 100 mV tunneling current setpointhIti ¼ 100 pA. Inset: Zoom-in of the area marked by the square.
range force minima of metal tips on CO/Cu(111) are typically lower than130 pN.26
We then imaged the Cu(110)–(21)O reconstruction with the CuOx tip, as has been done in previous studies in which STM and AFM images alongside DFT-based calculations were used to deter- mine the tip apex.15,16InFig. 2(d), an STM topography image of the copper oxide domain is shown, where the maxima within the oxide coincide with AR positions in good agreement with Ref. 16.
(Interestingly, the maxima were found between the added rows in Ref.15, possibly due to the different STM imaging heights,21as dis- cussed in section S1 in thesupplementary material.)
To obtain significant contrast in constant-height AFM images, the tip was then approached to the sample from the STM imaging height. The atomic features that are resolved first are depressions [Fig.
2(e)], which can be attributed to the AR-Cu atoms.15The constant- height image in Fig. 2(e) is in excellent agreement with previously reported AFM images recorded of the Cu(110)–(21)O reconstruc- tion with CuOx tips.15,16Further approaching the surface leads to the emergence of increasingDfabove the AR-O atomic sites [Fig. 2(f)], which is expected from short-range Pauli repulsion between the tip and the AR-O atoms (see calculated force vs distance curves in Ref.
15). The good agreement of our STM and AFM data with previous studies of M€oniget al.15,16is further confirmation that the COFI image
FIG. 3.(a) COFI image of a dimer CuOx tip. (b)Dfðx0;zÞextracted along the dashed line in (a) from a set ofz-dependent COFI images of the dimer CuOx tip.
Vertical, dashed lines mark the positions of the two O atoms (OAand OB) at the tip apex. The COFI image in (a) has been recorded atzCOFI. (c) Short-range force vs distanceFSR(z) spectra recorded above the two O atoms, positions marked in (a) and (b), respectively. (d) STM feedback image of the Cu(110)-(21)O added-row reconstruction recorded with the dimer CuOx tip. Imaging parameters: Vb ¼ 100 mV andhIti ¼ 100 pA. The image has been processed with a 22 Gaussian low-pass filter andz-drift corrected.35(e) and (f) Constant-height Df images of the same area as in (d), recorded 190 pm and 240 pm closer to the sur- face with respect to the STM setpoint on the bare Cu surface, respectively.
FIG. 2.(a) COFI image of a CuOx tip. (b)Df(z) spectra recorded above the CO molecule (red curve) and the bare Cu surface (black curve), positions marked in (a). The zero point of thezaxis defines the closest approach in the measurement, z¼100 pm corresponds to the STM setpointVb¼ 100 mV andhIti ¼ 100 pA above the bare Cu surface. The COFI image has been recorded atzCOFI. (c) Short- range force vs distanceFSR(z) spectrum obtained by subtracting theDf(z) spectrum acquired above the Cu(110) surface [black in (b)] from theDf(z) spectrum acquired in the center of the CO molecule [red in (b)] and subsequent force deconvolution.34 (d) STM image of the copper oxide domain. Imaging parameters:Vb¼ 100 mV andhIti ¼ 100 pA. The image has been processed with a 22 Gaussian low- pass filter.35(e) and (f) Constant-height Dfimages of the same area as in (d) recorded atz¼50 pm andz¼0 pm, respectively. Far away (e), the AR-Cu atoms are imaged dark, and at closer distance (f), AR-O atoms are imaged bright. The overlaid structure marks positions of AR-Cu and AR-O atoms.
inFig. 2(a)indeed corresponds to a CuOx tip with a single O atom at the apex [compareFig. 1(a)].
InFig. 3, we show experimental data for a tip with an apex con- sisting of more than one oxygen atom. The COFI image [Fig. 3(a)]
shows two bright, repulsive features, which we attribute to two individ- ual oxygen atoms at the tip apex. In thesupplementary material, we show COFI images as a function of tip-sample distance for this tip to further illustrate this interpretation (Fig. S5). As the two O atoms are not at the same height above the plane of the surface, the COFI image has an associated tilt asymmetry.Figure 3(b) displays a vertical cut Dfðx0;zÞextracted along the dashed line inFig. 3(a)from a full set of z-dependent COFI images recorded with this tip. From this vertical cut, the lateral distance between the two O atoms at the tip apex was determined to beDx0¼250 pm. However, since the lateral deflection of the CO molecule leads to an increased lateral size of atomic features in AFM images,9the value ofDx0determined here defines an upper boundary for the lateral offset between the two O atoms at the tip apex. Figure 3(c) shows FSR(z) spectra recorded above the two O atoms, respectively. From the two spectra, short-range force minima of45 pN (atom OA) and32 pN (atom OB) are obtained, respec- tively, which are lower compared to the values for CuOx tips that have a single O atom at the apex. This can be attributed to the combined interaction of the two apex atoms with the CO molecule that cannot be separated using the on-off subtraction method. To estimate the ver- tical offset between the two O atoms at the tip apex, we compare thez- positions of the minima inFSR(z) spectra (z-method).38Based on this method, we determined the vertical offset from theFSR(z) spectra in Fig. 3(c)to beDz¼35 pm. From the values obtained forDx0andDz, the distance between the O atoms is found to bed¼252 pm.
With this “dimer” CuOx tip, we recorded STM and AFM images of the Cu(110)–(21)O added-row reconstruction for tip fingerprint- ing as done in Ref.15. The STM feedback image [Fig. 3(d)] is similar to the image recorded with the tip that had a single O atom at the apex. To obtain significant AFM contrast, the tip was again approached towards the surface from the STM imaging height. Note that the tip had to be moved closer to the surface than the single O atom tip. This can be attributed to the additional tunneling current contribution from the second O atom at the tip apex, which leads to a greater tip-sample distance with STM feedback on.20,21Interestingly, at first, we see again the emergence of depressions [Fig. 3(e)], which can be attributed to attractive interaction between the tip and the AR- Cu atoms. This appearance of the copper oxide domain is very similar to images that we recorded with tips that had a single O atom at the apex [compareFig. 2(e)]. Only when the tip further approaches the sample [Fig. 3(f)], the images of the Cu(110)–(21)O added-row reconstruction exhibit an asymmetry due to the multi-atom tip apex that is clearly distinct from images recorded with the CuOx tip that had a single O atom at the apex: As compared toFig. 2(f), the bright features that arise from Pauli repulsion between the tip and the AR-O atoms show a clear asymmetry. However, the determination of the exact tip structure based on the AFM images of the copper oxide domain would require theoretical modeling of such a dimer CuOx tip that has so far not been pursued.
This illustrates the danger of tip characterization with images of the oxide domain which show atomic resolution: Simply because individual atoms of the oxide can be resolved does not mean that the tip apex can be accurately determined, even when compared to
simulated data. One attribute of the COFI method is to acquire data at a tip-sample height at which there is significant repulsive interaction between the tip and the adsorbate. This results in a very detailed and complete picture of the apex atoms responsible for AFM imaging. Of course, the effect of multiple atoms will also be seen on the oxide domain when acquiring data at smaller tip- sample distances. However, it is more straightforward to directly determine the geometric positions of the apex atoms with an image of a point feature (a single CO molecule) vs that of a lattice. This is especially true for instances in which the spacing between apex atoms on the tip is comparable to that of the lattice, as in the exam- ple of our dimer tip.
In conclusion, we presented an efficientin-situcharacterization of CuOx tips via the COFI technique and force spectroscopy. COFI images of CuOx tips terminating in a single O atom exhibit a circularly symmetric repulsive feature, very similar to images of CO-terminated tips on Cu(111)11and Cu(110). Via force spectroscopy curves recorded with these single atom CuOx tips on CO/Cu(110), we measured short- range force minima ranging from15 pN to30 pN, which is similar to data obtained for CO tips and illustrates the decreased reactivity of these tips as compared to bare metal tips.11,26While AFM images of the Cu(110)–(21)O added-row reconstruction recorded with a tip terminating in two O atoms at tip-sample distances at which atomic resolution appears first in constant-height images showed similar fea- tures as tips terminating in only one O atom, the COFI image directly resolved the two-atom tip apex. Based on our findings, we suggest to in-situcharacterize CuOx tips using COFI and force spectroscopy to unambiguously determine the chemical and structural compositions of the tip apex. Knowledge of these properties is of crucial importance, especially if the tips are used for experiments on other sample systems that are accompanied by theory, and the approach presented here pro- vides an efficient way of tip characterization.
Seesupplementary materialfor line profiles extracted from the STM images of the copper oxide domain, COFI images of the CuOx tip as a function of tip-sample distance, FSR(z)-spectra for twelve CuOx tips, a COFI image and aFSR(z)-spectrum recorded with a CO- terminated tip on CO/Cu(110), and COFI images of the dimer CuOx tip as a function of tip-sample distance.
We thank H. M€onig, A. Peronio, A. J. Weymouth, J. Berwanger, F.
Huber, and S. Matencio for fruitful discussions and A. J. Weymouth and J. Berwanger for proofreading this manuscript. We are grateful to F. Pielmeier for the data measured with the CO tip on Cu(110). The authors acknowledge the Deutsche Forschungsgemeinschaft for funding within research Project No. CRC 1277, project A02.
REFERENCES
1G. Binnig, H. Rohrer, C. Gerber, and E. Weibel,Phys. Rev. Lett.49, 57 (1982).
2G. Binnig, C. F. Quate, and C. Gerber,Phys. Rev. Lett.56, 930 (1986).
3N. Moll, L. Gross, F. Mohn, A. Curioni, and G. Meyer,New J. Phys.12, 125020 (2010).
4R. Temirov, S. Soubatch, O. Neucheva, A. Lassise, and F. S. Tautz,New J. Phys.
10, 053012 (2008).
5D. M. Eigler, C. P. Lutz, and W. E. Rudge,Nature352, 600 (1991).
6L. Bartels, G. Meyer, and K.-H. Rieder,Appl. Phys. Lett.71, 213 (1997).
7G. Kichin, C. Weiss, C. Wagner, F. S. Tautz, and R. Temirov,J. Am. Chem.
Soc.133, 16847 (2011).
8L. Gross, F. Mohn, N. Moll, P. Liljeroth, and G. Meyer,Science325, 1110 (2009).
9L. Gross, F. Mohn, N. Moll, B. Schuler, A. Criado, E. Guitian, D. Pe~na, A.
Gourdon, and G. Meyer,Science337, 1326 (2012).
10F. Mohn, B. Schuler, L. Gross, and G. Meyer,Appl. Phys. Lett.102, 073109 (2013).
11Z. Sun, M. P. Boneschanscher, I. Swart, D. Vanmaekelbergh, and P. Liljeroth, Phys. Rev. Lett.106, 046104 (2011).
12A. J. Weymouth, T. Hofmann, and F. J. Giessibl,Science343, 1120 (2014).
13P. Hapala, G. Kichin, C. Wagner, F. S. Tautz, R. Temirov, and P. Jelınek,Phys.
Rev. B90, 085421 (2014).
14N. Moll, B. Schuler, S. Kawai, F. Xu, L. Peng, A. Orita, J. Otera, A. Curioni, M.
Neu, J. Repp, G. Meyer, and L. Gross,Nano Lett.14, 6127 (2014).
15H. M€onig, D. R. Hermoso, O. Dıaz Arado, M. Todorovic´, A. Timmer, S.
Sch€uer, G. Langewisch, R. Perez, and H. Fuchs,ACS Nano10, 1201 (2016).
16H. M€onig, S. Amirjalayer, A. Timmer, Z. Hu, L. Liu, O. Dıaz Arado, M.
Cnudde, C. A. Strassert, W. Ji, M. Rohlfing, and H. Fuchs,Nat. Nanotechnol.
13, 371 (2018).
17O. E. Dagdeviren,Phys. Rev. Applied11, 024068 (2019).
18J. Bamidele, Y. Kinoshita, R. Turansky, S. H. Lee, Y. Naitoh, Y. J. Li, Y.
Sugawara, I.Stich, and L. Kantorovich,Phys. Rev. B86, 155422 (2012).
19J. Bamidele, Y. Kinoshita, R. Turansky, S. H. Lee, Y. Naitoh, Y. J. Li, Y.
Sugawara, I.Stich, and L. Kantorovich,Phys. Rev. B90, 035410 (2014).
20M. Z. Baykara, M. Todorovic´, H. M€onig, T. C. Schwendemann,O.€ Unverdi, L.€ Rodrigo, E. I. Altman, R. Perez, and U. D. Schwarz,Phys. Rev. B87, 155414 (2013).
21H. M€onig, M. Todorovic´, M. Z. Baykara, T. C. Schwendemann, L. Rodrigo, E. I.
Altman, R. Perez, and U. D. Schwarz,ACS Nano7, 10233 (2013).
22J. Welker and F. J. Giessibl,Science336, 444 (2012).
23J. Welker, A. J. Weymouth, and F. J. Giessibl,ACS Nano7, 7377 (2013).
24M. Emmrich, F. Huber, F. Pielmeier, J. Welker, T. Hofmann, M.
Schneiderbauer, D. Meuer, S. Polesya, S. Mankovsky, D. K€odderitzsch, H.
Ebert, and F. J. Giessibl,Science348, 308 (2015).
25Y. Sugimoto, P. Pou, M. Abe, P. Jelinek, R. Perez, S. Morita, andO. Custance, Nature446, 64 (2007).
26T. Hofmann, F. Pielmeier, and F. J. Giessibl, Phys. Rev. Lett.112, 066101 (2014).
27F. J. Giessibl,Appl. Phys. Lett.76, 1470 (2000).
28T. R. Albrecht, P. Gr€utter, D. Horne, and D. Rugar,J. Appl. Phys.69, 668 (1991).
29D. J. Coulman, J. Wintterlin, R. J. Behm, and G. Ertl,Phys. Rev. Lett.64, 1761 (1990).
30K. Kern, H. Niehus, A. Schatz, P. Zeppenfeld, J. Goerge, and G. Comsa,Phys.
Rev. Lett.67, 855 (1991).
31J. Harl and G. Kresse,Surf. Sci.600, 4633 (2006).
32S. Kishimoto, M. Kageshima, Y. Naitoh, Y. J. Li, and Y. Sugawara,Surf. Sci.
602, 2175 (2008).
33P. Hofmann, K. Schindler, S. Bao, V. Fritzsche, A. M. Bradshaw, and D.
Woodruff,Surf. Sci.337, 169 (1995).
34J. E. Sader and S. P. Jarvis,Appl. Phys. Lett.84, 1801 (2004).
35I. Horcas, R. Fernandez, J. M. Gomez-Rodrıguez, J. Colchero, J. Gomez- Herrero, and A. M. Baro,Rev. Sci. Instrum.78, 013705 (2007).
36M. Ternes, C. Gonzalez, C. P. Lutz, P. Hapala, F. J. Giessibl, P. Jelınek, and A. J.
Heinrich,Phys. Rev. Lett.106, 016802 (2011).
37J. E. Sader, B. D. Hughes, F. Huber, and F. J. Giessibl,Nat. Nanotechnol.13, 1088 (2018).
38B. Schuler, W. Liu, A. Tkatchenko, N. Moll, G. Meyer, A. Mistry, D. Fox, and L. Gross,Phys. Rev. Lett.111, 106103 (2013).