THE STATUS AND FUTURE OF CHEMICAL MICROSCOPY
MARIA KuHNERT-BRANDSTÄTTER
Institute of Pharmacology, University of Innsbruck, Austria
INTRODUCTION
Although chemical microscopy is truly the mother of microchemistry, today it has almost become a mere step-child, having been largely super- seded by the classical microchemistry of Pregl and Emich. There are many reasons for this, but not least is the fact that the microscope has been grossly disregarded in the general training of chemists. In contrast, mineralogists, geologists, biologists, medical students and pharmacists are required to become familiar with microscopic techniques from the very beginning of their sturlies; the microscope is essential in their laboratories. Chemists very often only use this apparatus in short mineralogical or crystallographical courses. Only in rare cases do they find it a substantial part of their chemical training. However, the successful use ofthe microscope is impossible without thorough training. As
J
ulius Sachs declared ninety years ago : '' Even the best microscope soon becomes a boring toy in the hands of the inexperi- enced".The introduction of the microscope into chemistry was thus initiated by crystallographers on the one hand and by botanists and pharmacists on the other. Furthermore, modern representatives of chemical microscopy have often had close relationships to one or the other of these disciplines.
The unsatisfactory position of microscopy in chemistry is illustrated by a statement in the Handbook of Microscopy in Technologyl, that there are many, perhaps unlimited, possibilities for microscopy in research, industry, and forensie chemistry, but that they are only used to the extent of about 10-20 per cent.
DEPOSITION METHODS
Of the three methods developed in chemical microscopy, the observation of crystalline deposits is the nearest to the usual chemical procedures.
The slide is used in place of the test-tube and the photomicrograph in place of the undefined precipitate. This method has been found tobe very useful in the identi:fication of inorganic compounds. Different ions yielding pre- cipitates with the same reagent are often easily distinguished by the shape of their crystals.
This field has been thoroughly studied for many years. For example, Geilmann, in the third edition of his Pictures for the Qualitative Microanalysis
of
Inorganic Compounds2, in 1960, merely had to replace some photomicro- graphs by better ones. However, this is not to say that new, in particular133
MARIA KUHNERT·BRANDSTÄ TTER
organic, reagents have not been developed for the detection of various elements.
As a compromise to chemists with whom slides are not popular, Wald- manna has developed a microscope which allows observation in a test- tube or any other laboratory vessel. The power of observation is amazingly good up to a magnification of x60. In this case, microscopy has split from microchemistry.
The very opposite was shown by Wiesenberger4 in the ultra-microchemical field. New developments in deposition methods for inorganic compounds have been made in conjunction with the electron microscope. At the Symposium on Microchemical Techniques in 1961, the author hirnself reported on his electrolytic deposition technique.
It is well-known that concentration, and perhaps associated substances andfor impurities in the solution, may inßuence the shape and colour of the deposited crystals. The pH value may also affect the crystal form of the deposits. This can be shown for example on several molybdates. When treated with ammonium molybdate, aluminium, calcium, iron, nickel and other ions separate from a weak acid solution in rhombic plates2. However, if the reaction is carried out in a stronger acid medium, pH
<
1·25, needles are formed instead of plates. Presumably the plates represent a hex.amolyb- date whereas the needles consist ofthe dodecamolybdate5.The excellent results of the deposition method in inorganic chemistry are unfortunately not duplicated in organic chemistry. Due to the un- expected developments of synthetic chemistry, chemical identification methods for organic substances have in general become unsatisfactory, and attempts to use them exclusively would be hopeless. Moreover, crystal- line precipitation is often resorted to if the usual chemical methods fail to distinguish between related compounds. Accordingly, the greater part of the literature on the subject deals with the distinction of barbituric acid derivatives, which is an important problern in forensie chemistry and pharmacy. To give only one example: one author6 recommends the reaction
Table I.
Melting Glass Temperature,
point Garnpound powder Na light
(oC) (nn) (oC)
127 Butobarbitone 1·4683 126-127
129 Pentobarbitone 1·4683 139-141
139 Itobarbitone 1·4683 151-152
157 Amobarbitone 1·4584 143-144
159 Alphenal 1·5403 164-165
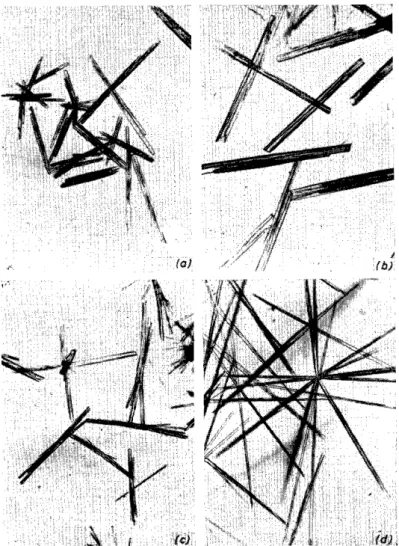
with copper acetate-ammonia, which produces differently coloured precipi- tates, to distinguish between 15 barbiturates. The three compounds ito- barbitone, amobarbitone and pentobarbitone give blue precipitates, which are claimed to differ in the shape of their crystals. Our own tests7 showed, however, that these results cannot be reproduced. On the contrary, it was found that the precipitates of amobarbitone had crystals similar in shape to
134
THE STATUS AND FUTURE OF CHEMICAL MICROSCOPY
those of pentobarbitone and two other compounds, itobarbitone and al- phenal, which were not considered in the original paper (Figure 1). The same was found for the analogous iron and cobalt compounds. Since barbiturates are frequently isomorphic with one anothers, their complex compounds can also be expected to occur in isomorphic forms.
The refractive indices of the melts of the barbiturates, however, together with the melting points, allow unequivocal differentiation ( Table 1). This does not by any means say that crystalline precipitation is an unsuitable method for identifying organic compounds; combined with the determina- tion of physical constants such as melting point, refractive index or optical crystallographic tests, it is very valuable.
OPTICAL ·cRYSTALLOGRAPHIC METHODS
The truly classical method in chemical microscopy is optical crystal- lography. The determination of the optical properdes of crystals, especially their refractive indices, has proved to be of the grea test value for iden tifying inorganic and organic compounds. This method has the advantage of not requiring reagents, except for a range of reference liquids, for the deter- mination of refractive index.
In spite of the efforts of mineralogists and crystallographers, e.g. Hart- shorn and Stuart9 in England and MasonlO and Winchellll, 12 in America, optical crystallographic techniques do not find the wide use they would deserve. The reason for this is that, contrary to the above-mentioned precipitation methods and the thermo-microscopic method, which is dis- cussed below, optical crystallographic methods require a more rigorous training. Without a certain minimum of crystallographic knowledge, the use of optical crystallographic techniques in chemistry is not to be recom- mended.
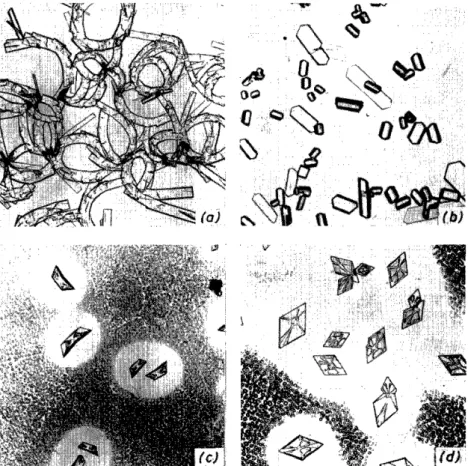
When workers attempt to avoid the sometimes laborious optical crystallo- graphic determinations and base their determination on one type of test only, i.e. crystal inorphology, serious errors can result. Although ever since the time of Behrens, leaders in this field have often emphasized that the out- ward appearance of crystals must not be over-rated, there are numerous examples in the Iiterature in which crystal pictures of organic compounds are said to have so-called characteristic identification features, and more often than not no exact experimental conditions are given. Frequently, this refers to sublimates or eise to crystal aggregates which result from evapor- ation of solvents and recrystallization of melts. A compound of the large group of barbiturates will again serve as an example. In Figure 2, there are four different pictures of sublimates of prominal, all representing the same crystallographic modification of the compound but prepared under varying experimental conditions7• As a result of different combinations of planes, the crystalline habit can vary so much that the resulting pictures are anything but identical. The possibility of obtaining different crystals by polymorphism should also not be under-rated. In some groups of com- pounds, which are commonly used for such experiments, the nurober of polymorphic rnodifications arnounts to almost 70 per cent. Some unstable modifications are even offered as commercial preparations ( Table 2). In Figure 3, an example from the group of steroid hormones is shown. Figure 4
135
MARIA KUHNERT-BRANDSTÄTTER
illustrates, on the other hand, that different compounds may appear in similar crystal forms due to isomorphism13. All three factors, polymorphism, isomorphism and the general influences on crystallization processes, i.e.
temperature, concentration, etc., are unfavourable for the reproduction of
"characteristic crystal pictures".
Table 2.
Number of Numher of unslabte
Garnpounds Total polymorphs samples
number (per cent) (per cent) Steroid hormones
(m.p. <210°C) 48 67
•
17
Sulfonamides 40 40 23
Barbiturates 38 63 11
Even though papers of such low standard are not taken seriously by professional chemical microscopists, they do represent a danger in that they are likely to discredit microscopical methods altogether. It is regrettable that a trend to such simplified methods is to be found in the East European and German pharmacologicalliterature14-19.
THERMO-MICROSCOPICAL METHODS
The most successful effort to make microscopy more popular with organic chemists was made by the late Ludwig Kofler more than 25 years ago. He developed a new method involving a hot-stage microscope20-22. At least as far as the determination ofmelting points is concerned, the micro-method, in contrast to the macro-method, has largely found acceptance. It may be considered as a fortuitous circumstance that Kofler's wife, who was a co- worker, not only had excellent crystallographic training but was also pro- ficient in optical crystallography. He was concerned by the fact that his co-workers, chemists and pharmacists, found great difficulty in working in the field of optical crystallography, and he was seeking a solution to this problem. He was convinced that the refractive index of a compound was an excellent criterion for identification which he did not wish to abandon. His idea of changing from the anisotropism of crystals to the isotropism of melts must be regarded as particularly fortunate. He hirnself always spoke of an escape into isotropy. He did not endeavour to compete with the optical crystallographic methods, but rather attempted to avoid the difficulties which he had experienced in this field. 99 per cent of organic compounds are anisotropic, and the exact determina tion of their refractive indices is rather more difficult than for isotropic ones. Working with the melt has the additional advantage that discrepancies caused by polymorphic modi- fications disappear. Not infrequently, commercial preparations are available in different modifications, or as mixtures of two modifications, or which yield still further modifications when crystallized from solvents for the pro- ductiOI'l of measurable crystals. There are also mixtures in which com- pounds occur in the anhydrous as weil as the hydrated form, and this also
136
THE STATUS AND FUTURE OF CHEMICAL MICROSCOPY
causes discrepancies in the determination of refractive index. The melts, however, are optically isotropic. In principle, Kofler's glass powder method is a reversal of the immersion techniques so well-known in optical crystallography. The unknown melt replaces the liquid of known re- fractive properties; however, the refractive index of the imbedded glass particles is known. With adequate temperature control and measurement, the refractive index can be precisely determined indirectly to the fourth decimal place. This is possible since the refractive index of a liquid decreases linearly with increase in temperature. The temperature at which the refractive indices of the melt and the added glass powder are identical is determined on the thermo-microscope. Naturally the same rules arevalid for this method as for the immersion method. Since the Becke-line method is also used as a technique for determining which medium has the higher refractive index, it is necessary to work in monochromatic light. It would be desirable to standardize the light source. The sodium lamp or a corresponding interference filter are recommended.
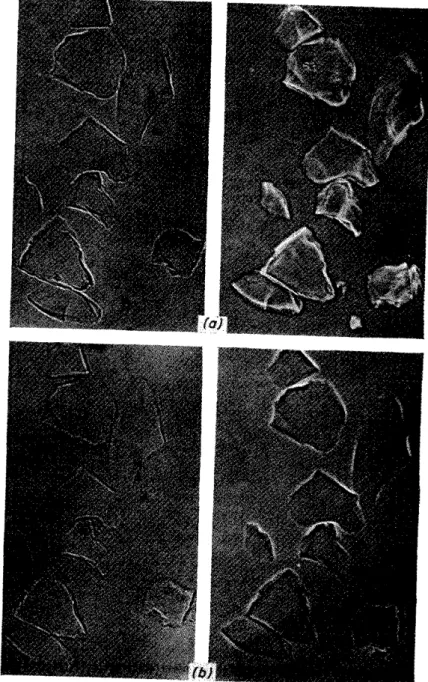
To evaluate the refractive index of the melt, the temperature at which the glass particles become invisible, and that at which they reappear with an accompanying change in the direction of movement of the Becke-line, must be determined. Since this causes some initial difficulty to untrained persons, the use of phase contrast microscopy has been tried23. Some facili- tation is possible, since the glass particles are still readily visible when the difference in refractive index is very small; even at the temperature at which the refractivities become equal, the particles are usually just visible, so that a more accurate determination of temperature is possible than with the Becke-line method. Glass particles with and without the application of phase contrast are shown in Figure 5.
The refractive index of the melt, together with the micro-melting point, affords a means of identifying organic compounds which is preferable to the optical crystallographic method because of its simplicity and speed; more- over, it is relatively easy to learn the required skills. Some American chemical microscopists are quoted below; they are trained optical crystallographers and recently verified the author's statement. In their first work, Optical Pro- perlies ofCertain Steroid Hormonesand Related Compounds, Crisler, Witt and Recht- Crisler24 wrote in the summary: "These data afford a positive identification ofthese compounds with only minute amounts ofmaterial". In a subsequent work, Fusion Properfies of Certain Steroid Hormones and Related Compounds25,
they came to the conclusion: "These data afford a rapid and positive identi- fication of these compounds, and only minute amounts of material are re- quired".
For the purpose of thermo-microscopical identification, the determination of the eutectic temperature, using standard compounds, was combined with that ofthe two constants already mentioned. At first, it seemed unthinkable to some physical chemists that it should be possible to determine the exact eutectic temperature of a pair of compounds by means of the thermo-micro- scope without a knowledge of the phase diagram, and without weighing, merely after having been powderded. Fortunately, Kofler did not consult the theoreticians in advance, but tried the experiment first. In a systematic identification procedure in which the compounds are arranged in
137
MARIA KUHNERT -BRANDST Ä TTER
order ofincreasing melting point, this constant serves to differentiate between compounds with the same melting point. As the third and decisive identi- fication test, the refractive index is considered. Table 3 shows a Iist of 10 compounds with the same melting point, taken from identification tables26.
It is shown that, on the basis of two eutectic temperatures with different test compounds, the number of possible substances can be limited to one or
Table 3.
Eutectic
.Melting temperature Glass
point Compound (0C) with powder, Temperature (0C)
(OC) nn
benzil acetani- red light Na light
Iide
108-110 m-Brombenzyl-pyri- dyl-diethyl-ethyl-
endiaminemaleate 80 68 1·5502 116-117 121-122
100-110 Fructose 94 98 1·5101 108-109 108-109
110 Fluoranthene 64 85 1·6877 114-115 125-126
110 Rhothane 66 88 1·5700 114-115 119-120
110 Acridine 67 80 1·6877 97-98 110-111
110 Aceto-o-toluidide 78 75 1·5101 123-124 128-129
110 o,o-Diphenole 65 48 1·5897 124-125 128-129
110 Anisoine 78 89 1·5700 107-108 115-116
110 Orcinol 67 28 1·5403 109-111 116-117
110 Methyl butylketone- 2,4-dinitrophenyl-
hydrazone 74 88 1·6011 127-128 159-160
two. The refractive index of the melt can then often be readily determined by judicious choice of the appropriate glass powder from the 24 samples used as standard. The refractive indices of these 10 compounds are far enough apart to guarantee a reliable identification. In the original tables, notes ofspecial properties are given for each compound, such as temperature of sublimation, polymorphism and release of water of crystallization, all of which represent additional identification features.
Of the approximately 1500 compounds which have up to now been ex- amined by thermo-microscopical methods or, as they are called in America, fusion methods22, more than 70 per cent can be characterized by determina- tion of the four constants mentioned. With the remaining substances, deter- mination of the refractive index is impossible, either because it is not within the scale of the glass powders, or because of decomposition of the substance.
Only 3-4 per cent of the failures are attributable to the scale of the glass powders. In these cases, it is easy to find a substitute constant. Molecular compounds are prepared with a reagent, not by the usual method ofreaction, precipitation, washing, drying and subsequent determination of the melting point, but by the contact or mixed fusion method. This technique has been developed by A. Kofler27 especially for the study of binary systems. It can also be used for identification, as shown by Laskowski, Graber and McCrone28, 29, of a number of aromatic compounds which have been treat- ed with 2,4,7-trinitrofluorenone. The melts of the sample and ofthe reagent
138
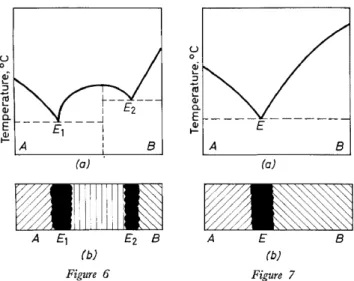
THE STATUS AND FUTURE OF CHEMICAL MICROSCOPY are permitted to flow together under a cover glass and are allowed to crystal- lize by cooling. In the contact zone, the molecular compound appears as a crystallized band. Corresponding to the melting diagram, three character- istic temperatures can be determined on reheating: the melting points of the two eutectics which appear with crossed polars as black bands, and the melting point ofthe molecular compound (Figure 6). Only a simple eutectic results if the reaction is negative ( Figure 7).
In most cases, the reason that the refractive index cannot be determined is that decomposition occurs; this sets the limit of applicability of thermo- microscopy. Compounds which melt without decomposition can be deter- mined completely using a thermo-microscope, a set of glass powders and seven test substances. For compounds that decompose, a criterion other than refractive index must be used. For those who have mastered optical crystallographic techniques, the refractive indices of the crystals are the given substitute. On the other hand, microchemical reactions can be used which preferably should yield fusible products. For instance, the bases of numerous alkaloid salts can be obtained on the slide, purified and recovered by sublimation on a cover-glass, and the melting point determined30, Spot tests are also suitable as an additional guide31.
ULTRA VIOLET SPECTROPHOTOMETER METHODS The combination of thermo-microscopy with ultraviolet ~pectrophoto
metry has proved to be very favourable32 • Of the 300 or so substances mentioned in the identification tables, for which the determination of re- fractive index is impossible, approximately 70 per cent display characteristic absorption spectra. Only about 8 per cent of the materials cannot be identi- fied by the thermo-microscopic method, if spectrophotometry is used in conjunction with the refractive index technique.
Table 4.
I
Melting Eutectic temperature
point Compound (°C) with u.v. Absorption dataf
(oC)
salo- dicyan- phen diamide
205-220 p-Aminosalicylic acid 168 141 Amax. = 266·5, 300 illfL hydrochloride Amin. = 245, 285 ffi[L
215-220 2,6-Dihydroxynaph- 156 S.W. = 0·5-1 mg (W) 168 Amax. = 228, 260, 270 ffi[L
thalene Amin.= 253·3, 265 ffi!Jo
215-220 Isothipendyl 153 S.W. = 0·5-1 mg (A) 132 Amax. = 246·5, (,.._,315) ffi[L
Amin.= 221·5, 273 ffi!Jo
218-220 Phloroglucinol 159 S.W. = 0·5-1 mg (A) 154 Amax. = 268 illfL
Amin. = 247 illfL 215-220 o-Cumaric acid 167
S.W. = 0·5-1 mg (A)
158 Amax. = (216), 273, 323 ± 2 ffi[L Amin. = 245, 301 ffi[L
S.W. = 0·5-1 mg (A) f S.W. = weight ofsample/50 ml solvent; W = water; A = alcohol
-
139
MARIA KUHNERT-BRANDSTÄTTER
I t is usually unnecessary to determine the extinction coefficient when using spectrophotometry in combination with melting point and eutectic point determination; it is sufficient to determine the wavelength of the absorption maxima and minima. The advantageisthat no exact weighing is necessary, and further dilution can be clone by eye. Table 4 lists some decomposable compounds which melt within the same range. The absorp- tion maxima are so far apart that the determination of the extinction co- efficien t is unnecessary.
If, however, compounds within the same chemical group aretobe distin- guished, the situation is entirely different. Here the extinction coefficient is a decisive factor in effecting a differentiation.
This naturally raises the question as to whether or not the refractive index determination should be totally replaced by spectrophotometry. In our opinion, this would not be justified. The refractive index of the melt can be determined more quickly than a spectrum and, in certain cases, it is superior to the ultraviolet spectrum in the study of closely related com- pounds. In a comparison of refractometry and spectrophotometry recently carried out with 77 steroid hormones33, refractometry was preferred. Of the compounds mentioned, for 18 per cent the refractive index method could not be used because of decomposition, whereas 29 per cent had no usable spectra. If the substances with extinction coefficients which cannot be sufficiently differentiated were added, the percentage would be much higher.
However, in cases where the determination of refractive index is not possi- ble, good spectra can fortunately be obtained; thus, by a combination of the two methods, significant results are produced. Table 5 illustrates that re- fractometry is emminently suitable for closing the gap in spectrophotometry.
Table 5.
Melting I Glass Temperature
point Compound powder, Na light u.v. Absorption data
(OC) nn (OC)
122 Testosterone pro- I
pionate 1·5000 117-118 Amax. = 241 mp., e = 16·900 123 Progesterone
(ß-form) 1·5204 117-118 Amax. = 241 ffi[L, € = 16·830 155 Testosterone 1·5204 153-154 Amax. = 241 ffi[L, € = 16·380 159 Deoxycorticosterone 1·5000 163-164 Amax. = 241 ffi[L, e = 16 ·400
acetate
161-164 Deoxycorticosterone
propionate 1·4936 164-166 .\max. = 241 mp., E = 16·880 165 Methyltestosterone 1·5204 143-144 Amax. = 241 mp., e = 16·520 212-222 Prednisone 1·5299 228--230 Amax. = 238 ffi[L, e = 15·500 220-224 Adrenosterone 1·4936 225-227 Amax. = 238 mp., E = 15·360
While extinction coeffi.cients of the various pairs of compounds with similar melting points are within the limit of error, the refractive index provides a good means of differentiation. With infrared spectrophotometry also it can be proved that the melting point method is as favourable as the photo- metric technique.
140
Figure 1. Copper acetate-ammonia precipitations of (a) butobarbitone; (b) itobarbitone;
(c) alphenal; (d) amobarbitone
Facing page 140
Figure 2 . . \ublimates of prominal
Figure 3. Oestradiol benzoate. (a) Form I; (b) forms l i and III
Figure 4. (a) Methandriol; (b) methylandrostandiol
Figure 5. Glass particles in a melt, (lift) Becke-line, (right) phase index of the melt is (a) higher, (b) lower than the glass contrast. The refractive
r--Ez --
_ _ _ _J
E, i
I 8
(a)
MI
!I
II
II
! ID
(b) Figure 6
u 0
ai L ::::l
"§
()) Q.
~ ____ E _____ _
A 8
(a)
A E 8
(b) Figure 7
Figure 6. (a) Melting diagram for a molecular compound system; (b) schematic representation of the contact preparation at the eutectic temperature, Ez
Figure 7. (a) Melting diagram forasimple eutectic system; (b) schematic representation ofthe contact preparation at the eutectic temperature
c
~ u
c~
0 1/l 1/l
E
1/l c
C1l
~
4 000 3 000 2 000 1500 Wavelength, cm-1
1000 650
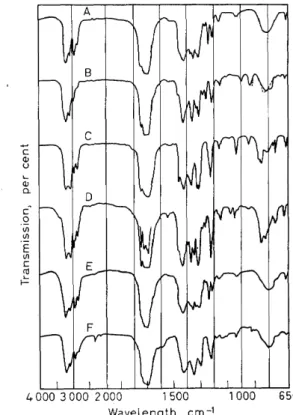
Figure 8. Infrared spectra ofbarbiturates: Curve A: amobarbitone; curve B: aprobarbitone;
curve C: barbitone; curve D: butabarbitone; curve E: butethal; curve F: cyclobarbitone.
(After Cleverley)
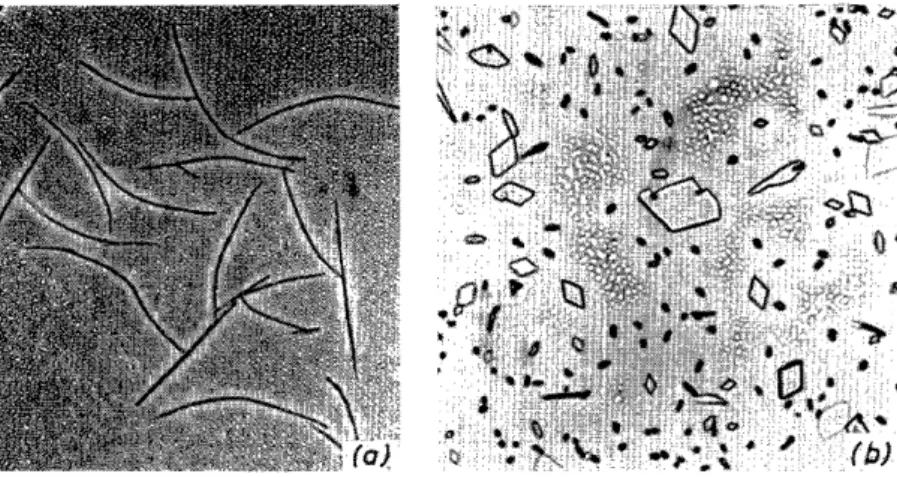
Figure 9. Microscopic forerunner of the electron microscopical "decoration method"
Figure 10. Halo-formation in sulfomethylmethane and azobenzene
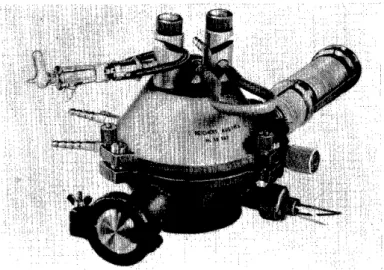
Figure 11. High-temperature hot-stage "Vacutherm"
THE STATUS AND FUTURE OF CHEMICAL MICROSCOPY
I t is well-known that barbiturates are difficult to distinguish. Their positive identification is important because they still represent the largest dass of suicide drugs. There is a difference between somebody who has committed suicide with amobarbitone or been murdered with butobarbitone.
Hence great efforts have been made for years to identify these drugs.
Figure 8 shows the infrared spectra of six barbiturates from one of Cleverley's studies34. This gives the absorption spectra of super cooled melts prepared by a special technique, as the solution spectra are not suitable because of their great similarity. In spite of this technique, the differentiation is slight, andin the case of amobarbitone and butethal, practically identical spectra result. Cleverley recommends the micro-determination of the melting point to distinguish between these two compounds. We are of the opinion that in this case it would be advisable to dispense with the spectrum altogether and determine the refractive index which, as shown in Table 6, is more
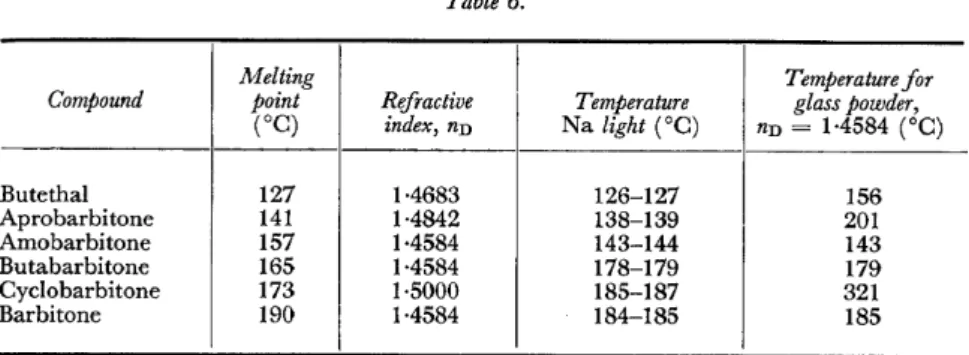
Table 6.
Melting Temperature for
Compound point Refractive Temperature glass powder,
(oC) index, nn Na light (°C) nn = 1·4584 (°C)
Butethal 127 1·4683 126-127 156
Aprobarbitone 141 1·4842 138-139 201
Amobarbitone 157 1·4584 143-144 143
Butabarbitone 165 1·4584 178-179 179
Cyclobarbitone 173 1·5000 185-187 321
Barbitone 190 1·4584 184-185 185
suitable for differentiation. To illustrate the differences in refractive index, the last column of the table gives the temperature values with the glass, nn
=
1·4584; some of these values have been calculated since the melts cannot be overheated or supercooled as desired.IDENTIFICATION OF LIQUIDS
So far, the discussion has been concerned with solid materials only, but the possibility of characterizing liquids must not be neglected. Methods for liquids have been developed for the thermo-microscope by Fischer35, 36.
The critical solution temperature at which two compounds of limited miscibility are completely miscible is as constant as the eutectic temperature and can likewise be determined in a simple manner without weighing. The principle is the same as that of the mixed fusion method, but the liquids which have to be brought into contact must be melted in a capillary. A meniscus forms at the boundary between the two liquid phases and disappears at the critical solution temperature. This determination is more easily re- produced if the critical solution temperature is first exceeded, then the heat to the apparatus is switched off, and the temperature at which a meniscus is formed on cooling, determined. With the correct choice of test liquids, not
M 141
MARIA KUHNERT-BRANDSTÄ TTER
only can pure liquids be identified, but in suitable cases the composition of mixtures and solutions can also be quantitatively determined37, 38.
MICROSCOPICAL APPLICATIONS IN PHARMACOLOGY In pharmacology, conditions are favourable for the application of micro- scopical methods, since a limited number of specified compounds has to be identified as quickly as possible, with the minimum of apparatus and test material. The problern confronting the pharmacopoeia is the ever-increasing number of drugs and the consequent number of analytical investigations required. F or commercial reasons, a drug having a certain effect is brought on the market in a large nurober of preparations. Many of these brands have only a few significant chemical differences. I t is evident that in such cases the conventional chemical iden tification tests are no Ionger sufficien t.
This development has led, on the one hand, to the use in the pharmacopoeia of complicated physical, analytical procedures and on the other hand, to the introduction of simpler methods by which the pharmacist is able to fulfil his obligation to test the drugs in his dispensary. The thermo-micro- scope offers the possibility of examining a large nurober of organic compounds by a simple technique. Since the authors of the International Pharmacopoeia39 have decided to incorporate the Kofler methods in the new edition of this work, it is to be hoped that national pharmacopoeias will follow suit.
A further possibility for the increased use of the microscope is tobe found in combination with modern separation procedures such as thin-layer chromatography and gas chromatography. With these procedures, the separationproblern is essentially solved, but the methods for the identification of the separated fractions are frequently unsatisfactory.
ADDITIONAL USES FOR THERMO-MICROSCOPY
Thermo-microscopy is no less important than for the identification and differentiation of compounds, for following processes such as crystallization, transformation, oriented overgrowth, etc. Even if these phenomena are of less interest in organic chemistry itself, the observations so made with organic compounds can be transferred by analogy to the metals and mineral systems which are more difficult to examine. For instance, studies of deposits on growth spirals from the vapour phase40 (Figure 9) have become a sub- sidiary technique in electron microscopy as a · "decoration method"41. In this way dislocations in the crystal lattice, or the resulting spiral steps, can be made visible. A. Kofler42 was able to explain the mechanism of some well-known anomalies in the inorganic field, such as the displacement ofthe eutectic point and the so-called "halo-formation" (Figure 10), through detailed studies of abnormal crystallization of supercooled mixed melts.
After 15 years, her work has recently been taken up with great interest by metallurgists.
Stimulated by the success which the microscopic method has had in thermo-analysis with two-component systems, metallurgists are no Ionger satisfied with examples from organic chemistry but investigate their materials on the thermo-microscope directly43, 44. Figure 11 shows such a device, called
"Vacutherm"45, which allows measurement of temperatures up to 2000°C 142
THE STATUS AND FUTURE OF CHEMICAL MICROSCOPY
and has the advantage of permitting work in vacuum or in any gas atmosphere. Recently, Dodd46 described the construction of a simple high- temperature hot stage for temperatures up to 2000°0; the heating element consists merely of a wire loop.
Thus there is the possibility of extending the fusion methods to inorganic salts. As regards an extension of the normal hot-stage technique for lower temperatures, it is to be expected that, with the help of freezing stages such as are used for the microtome, lower temperatures than have been possi- ble with carbon dioxide cooling can be reached. The determination of the optical and melting properties ofmaterials which areliquid at room tempera- ture will certainly bring interesting results.
CONCLUSION
Our aim for the future is to merge all the disciplines in chemical micro- scopy. A chemical microscopist should not only be skilled in conducting chemical reactions with the aid of the microscope, or content to be only a crystallographer or thermo-microscopist, but he should be able to select the most suitable ofthe possible techniques. We believe that fusion methods are weil suited as a basic method because the melting point represents a sound starting position for further differentiation measures, whether they are chemical, crystallographic or physical. In our opinion, other physical methods should be included in so far as they produce better results. We are, however, convinced that the microscope, particularly in combination with the hot stage, has not lost its importance in spite of ultraviolet, infrared and X-ray analysis and polarography, but neither has it gained, as yet, the position that it rightly deserves.
References
1 H. Reumuth. Handbuch der Mikroskopie in der Technik (Ed. H. Freund), Vol. 1. Part 2, Umschau-Verlag, Frankfurt/Main (1957).
2 W. Geilmann. Bilder zur qualitativen Mikroanalyse anorganischer Sto.ffe, Verlag Chemie, Weinheim (1960).
a H. Waldmann. "Microchemistry of crystalline deposits in tissue section." In Microchemical Techniques (Ed. N. D. Cheronis), Interscience, New York (1962).
4 E. Wiesenherger. "Electron microscopy techniques for the identification of elements and electrolytic deposits on carrier films." In Microchemical Techniques (Ed. N. D. Cheronis), Interscience, New York (1962).
50. Kostenzer. "Mikroskopisch-mikrochemische Identifizierungvon Arzneimitteln." Disser- tation, Innsbruck (1960).
6 H. M. Romijn. Pharm. Weekblad92, 397 (1957).
7 M. Kuhnert-Brandstätter and E. Junger. Mikrochim. Acta 1963, 506.
8 M. Kuhnert-Brandstätter and M. Aepkers. Mikrochim. Acta 1962, 1040, 1055; 1963, 360.
9 N. H. Bartshorne and A. Stuart. Crystals and the Polarising Microscope, Arnold, London, (1960).
10 E. M. Chamot and C. W. Mason. Handbook ofChemicalMicroscopy, Interscience, NewYork (1958).
11 A. N. Winchell. The Optical Properlies oJ Organic Compounds, Academic Press, New York (1954).
12 A. N. Winchell and H. Winchell. Microscopic Characters oJ Artificial lnorganic Solid Substances or Artificial Minerals, Academic Press, New York (1961).
13M. Kuhnert-Brandstätter and E. Junger. Mikrochim. Acta 1964, 238.
14 N. A. Figurowskij and V. G. Rubinskaja. Aptechnoe Delo 1960, No. 5, 43.
15 E. Kassau. Deut. Apotheker Ztg. 100, 1102 (1960).
16 E. Kassau. Deut. Apotheker Ztg. 104, 613 (1964).
17 K. Nikolics. Acta Pharm. Hung. 32, 211 (1962); 33, 125 (1963).
18 K. Nikolics. Pharm. Zentralhalle 102, 432 (1963).
143
MARIA KUHNERT-BRANDSTÄTTER 19 H. Rzadkowska. Acta. Polon. Pharm. 1, 57 (1956).
20 L. Kofler. Angew. Chem. 51, 703 (1938).
21 L. Kofler and A. Kofler. Thermomikromethoden, Universitätsverlag Wagner, Innsbruck (1954).
22 W. C. McCrone. Fusion Methods in Chemical Microscopy, Interscience, New York, (1957).
23M. Kuhnert-Brandstätter. Mikroskopie 17, 17 (1962).
24 J. P. Crisler, N. F. Witt, and M. Hecht-Crisler. Mikrochim. Acta 1963, 104.
25 J. P. Crisler, N. F. Witt, and M. Hecht-Crisler. Mikrochim. Acta 1963, 316.
26 In preparation.
27 A. Kofler. Z. physik. Chem. (Leipzig) 187A, 363 (1941).
28 D. E. Laskowski, D. G. Graber, and W. C. McCrone. Anal. Chem. 25, 1400 (1953).
29 D. E. Laskowski and W. C. McCrone. Anal. Chem. 26, 1497 (1954).
30 A. Kofler. Microscope 14, 239 (1964).
31 F. Feigl. Spot Tests in Organic Ana(ysis, Elsevier, Amsterdam (1960).
32M. Kuhnert-Brandstätter and M. Senn. Sei. Pharm. 32, 211 (1964).
33M. Kuhnert-Brandstätter, E. Junger, and A. Kofler. Microchem. J, 9, 105 (1965).
34 B. Cleverley. Ana(yst 1960, 582.
35 R. Fischerand G. Kasarek. Mikrochem. ver. Mikrochim. Acta 33, 316 (1948).
36 H. H. 0. Schmid, H. K. Mangold, and W. 0. Lundberg. Microchem. J. 7, 297 (1963).
37 R. Fischer, E. Pinter, and H. Auer. Pharm. Zentralhalle 99, 299 (1960).
38 F. Gölles. Mikrochim. Acta 1963, 376.
39 International Pharmacopoeia, World Health Organization, Geneva, in the press.
40 M. Kuhnert-Brandstätter. Naturwiss. 42, 643 (1955).
41 G. A. Bassett. Phi/. Mag. 3 (Ser. VIII) 1042 (1958).
42 A. Kofler. Metallkunde Geissereiwesen 41, 221 (1950).
43 G. Reinacher. Handbuch der Mikroskopie in der Technik (Ed. H. Freund), Vol. 1., Part 2, Umschau-Verlag, Frankfurt/Main (1960).
44 R. Mitsche, F. Gabler, W. Wurz, and M. Kuhnert-Brandstätter. Gießerei-Nachrichten, 1962, 27.
45 F. Gablerand W. Wurz. Acta Phys. Austriaca 15, 32 (1962).
46 J. G. Dodd. Microscope 14, 302 (1965).