Organic matter composition and dynamic in polygonal tundra soils
I n a u g u r a l - D i s s e r t a t i o n
zur
Erlangung des Doktorgrades
der Mathematisch-Naturwissenschaftlichen Fakultät der Universität zu Köln
vorgelegt von
Silke Tamara Höfle
aus Bruchsal
Berichterstatter: Prof. Dr. Janet Rethemeyer
(Gutachter) Prof. Dr. Lars Kutzbach
Arctic permafrost regions are postulated to be most strongly affected by the on-going global warming resulting in longer summer seasons and higher temperatures. This may cause the degradation of permafrost and increase the thickness of the annual superficial thawing layer (active layer) of permafrost soils. Thereby permafrost soils may turn from carbon sinks into carbon sources for the atmosphere as large, previously frozen carbon pools become available for microbial degradation, a key factor in the soil organic matter (OM) degradation.
The aim of this thesis was to investigate soil organic matter of permafrost soil to identify stabilization mechanisms, soil bacterial communities and carbon pools preferably metabolised by soil bacteria using bulk, molecular lipid-biomarker, physical fractionation and radiocarbon analysis. In temperate soils stabilization mechanism of OM, mainly organo-mineral associations and soil aggregations, are well studied by separating the OM into functional pools with different turnover rates, which are determined by their chemical properties and bioavailability. However, little is known about the quality of the soil OM, its stability and its accessibility for the microbial community in permafrost soils. The most important location for microbial metabolic activity in permafrost soils is the active layer.
Therefore, this thesis concentrated on investigating different soil horizons of the active layer and the still frozen permafrost top layer of the polygonal tundra in the Siberian Lena Delta, Russia. Soil samples were predominantly taken from Samoylov Island and for the characterisation of soil bacterial communities additional samples from Kurungnakh Island were also analysed.
The results show that the OM of both different cryogenic structures (polygon rim and
centre) on Samoylov Island is dominated by little-decomposed, higher plant-derived
material as indicated by the dominance of long-chain lipid biomarkers (n-alkanes and n-
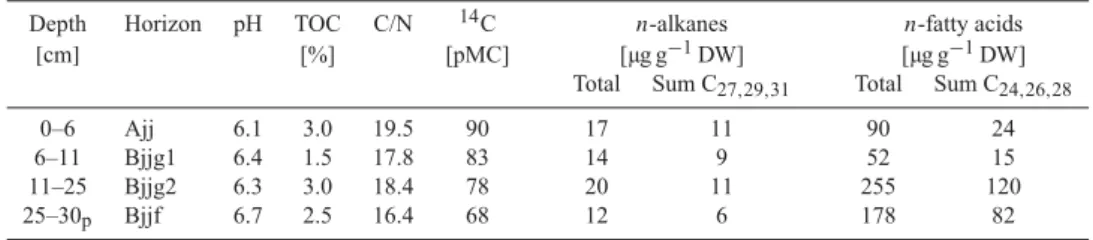
fatty acids) and high C/N ratios (16-51). The bulk soil OM of the active layer of the water
saturated polygon centre is very young (0 to 43 cm depth: modern to 300 yrs BP)
indicating that plant roots introduce modern carbon into deeper soil horizons. In contrast,
the 14 C age of the bulk OM of the polygon rim increases strongly with depth in the active
layer (0 to 32 cm depth: modern to 1950 yrs BP) and even further in the permafrost top
layer (32-37 cm depth: 3050 yrs BP) suggesting a slow microbial OM degradation in this
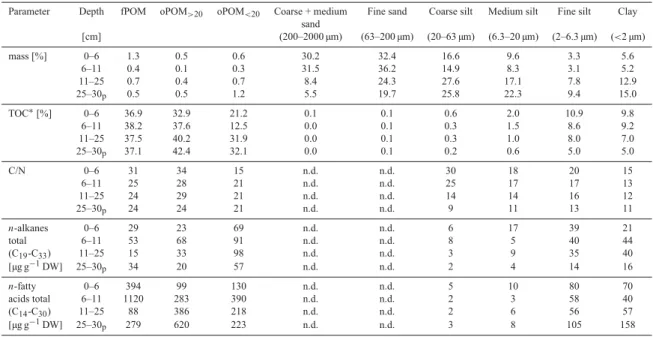
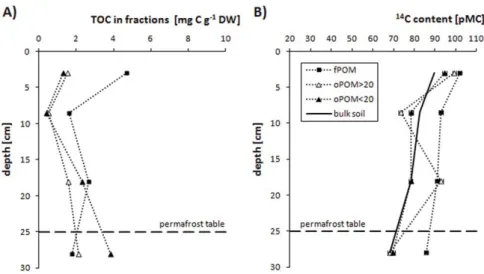
cold environment. Soil organic carbon in the polygon rim is mainly stored in the clay and
fine silt sized fractions (< 6.3 µm). These fractions are surprisingly ‘young’ with 14 C
contents similar to the bulk soil values suggesting that organo-mineral associations are of
little importance in the OM stabilization. Particular OM occluded in soil aggregates has
increased carbon contents with depth and higher 14 C ages (55-3080 yrs BP) than free light
particular OM (modern-1240 yrs BP). This indicates that soil aggregation seems to be of a
different soil horizons on Samoylov and Kurungnakh Island the soil horizons differed in the abundances of methanotrophs, cyanobacteria, soil-marker BHP-producing bacteria and unknown BHP-producing bacteria. The greatest structural diversity and highest BHP concentrations probably indicating a great bacterial diversity and biomass were observed in the uppermost organic soil horizons (Oi) of the polygon rim and centre. It seems that several soil properties as high organic carbon content and relatively low soil pH have a positive influence on the diversity of the BHP-producing bacterial community.
Microorganisms seem to predominantly metabolise the youngest, presumably labile OM
pools available, as the 14 C ages of individual PLFA biomarkers were always lower than
the 14 C ages of the bulk OM from which the biomarkers were isolated. It can be further
suggested that the microbial utilized labile OM pools are plant-derived as the microbial
PLFA biomarkers have similar 14 C ages the as long-chain (plant-derived) lipid biomarkers
and the free particular organic matter (fPOM). The increasing 14 C age of microbial PLFAs
with soil depths suggested that microorganisms metabolise older carbon sources in
greater soil depth. However, these sources are most likely still the most labile and plant-
derived OM pools available as fPOM has similar 14 C ages as the PLFAs. Therefore, it is
possible either that ‘old’, presumably more stable carbon pools are not in favour to
microbial decomposition or are not bioavailable or are degraded by microorganism other
than (aerobic) soil bacteria.
Die Permafrostregionen der Arktis werden durch die gegenwärtige globale Erwärmung vermutlich am stärksten beeinflusst, wodurch es zu längeren Sommerperioden und höheren Temperaturen kommen wird. Dies könnte zu einer Degradierung des Permafrostes führen und die jährliche oberflächliche Auftauschicht (active layer) der Permafrostböden an Mächtigkeit gewinnen lassen. Dadurch würden sich die Permafrostböden von Kohlenstoffsenken zu Kohlenstoffquellen für die Atmosphäre wandeln, weil große, früher eingefrorene Kohlenstoffreservoirs für den mikrobiellen Abbau, ein Schlüsselfaktor der Zersetzung von organischer Bodensubstanz, zur Verfügung stünden.
Das Ziel dieser Arbeit war die Untersuchung organischer Bodensubstanz in Permafrostböden zur Identifikation von Stabilisierungsmechanismen, Bodenbakterien- gesellschaften und Kohlenstoffpools, die vorranging von Bodenbakterien verstoffwechselt werden. Dies wurde mit Hilfe von bodenkundlichen Summenparametern, molekularen Lipid-Biomarkern, physikalischer Bodenfraktionierung und Radiokohlenstoffanalysen untersucht. In Böden der gemäßigten Zone sind die Stabilisierungsmechanismen der organischen Bodensubstanz (hauptsächlich organo-mineralische Verbindungen und Bodenaggregate) gut untersucht. Dafür wurde die organische Bodensubstanz dieser Böden in verschiedene funktionelle Pools mit unterschiedlichen Umsetzungsraten, die durch die chemischen Eigenschaften und der Bioverfügbarkeit der Pools bestimmt werden, aufgetrennt. Allerdings ist wenig über die Qualität, die Stabilität und die Bioverfügbarkeit für mikrobielle Gemeinschaften von organischer Bodensubstanz in Permafrostböden bekannt. Der Hauptort für mikrobielle Stoffwechselprozesse in Permafrostböden ist die jährliche Auftauschicht (active layer). Deshalb konzentrierte sich diese Arbeit auf die verschiedenen Bodenhorizonte der Auftauschicht und auf den obersten, noch gefrorenen Permafrostbereich in der polygonalen Tundra des sibirischen Lenadeltas, Russland. Die Bodenproben stammten hauptsächlich von der dortigen Insel Samoylov. Für die Charakterisierung der bakteriellen Bodengemeinschaften wurden zusätzlich Proben von der Insel Kurungnakh untersucht.
Die Ergebnisse zeigen, dass die organische Bodensubstanz der beiden kryogenen
Strukturen (Polygonwall und Polygonzentrum) auf der Insel Samoylov von wenig
zersetztem Material pflanzlichen Ursprungs dominiert wird, da langkettige Lipid-Biomarker
(n-Alkane und n-Fettsäuren) überwiegen und die C/N-Verhältnisse (16-51) hoch sind. Das
organische Bodenmaterial der Auftauschicht des wassergesättigten Polygonzentrums ist
sehr jung (0 bis 43 cm Tiefe: modern bis 300 Jahre BP). Dies lässt vermuten, dass
Pflanzenwurzeln modernen Kohlenstoff in tiefere Bodenhorizonte transportieren und dort
abgeben. Im Gegensatz hierzu steigt das 14 C-Alter des organischen Materials im
überraschend jung, was darauf schließen lässt, dass organo-mineralische Verbindungen bei der Stabilisierung des organischen Materials nur eine untergeordnete Bedeutung spielen. Partikuläres und in Bodenaggregaten gebundenes organisches Material (oPOM) hat mit der Tiefe höhere Kohlenstoffgehalte. Zudem ist das 14 C-Alter der oPOM-Fraktion (55-3080 yrs BP) größer als die des freien partikulären organischen Materials (fPOM:
modern-1240 yrs BP), was darauf hindeutet, dass Bodenaggregate nur in größerer Bodentiefe ein Stabilisierungsmechanismus sind.
Die lebende mikrobielle Biomasse wird von Gram-positiven und Gram-negativen Bakterien dominiert, was durch die Dominanz ihrer Phospholipid-Fettsäuren (PLFAs, Membranlipide der lebenden mikrobiellen Zellen) angezeigt wird. Bei der Analyse von Bakteriohopanpolyolen (BHPs), die fast ausschließlich von Bakterien produziert werden, zeigte sich für die verschiedenen Bodenhorizonten der Inseln Samoylov und Kurungnakh eine unterschiedliche Zusammensetzung von Methanotrophen, Cyanobakterien, bodenspezifischen BHP-produzierenden Bakterien und unbekannten BHP- produzierenden Bakterien. Eine große bakterielle Vielfalt und Biomasse scheint in den obersten, organikreichen Oi-Horizonten der Polygonwälle und -zentren vorzuliegen, da dort die höchste strukturelle Diversität und die höchsten Konzentrationen an BHPs gemessen wurden. Es scheint, dass die Bodeneigenschaften wie ein hoher Gehalt an organischem Kohlenstoff und relativ geringe pH-Werte einen positiven Einfluss auf die Diversität der BHP-produzierenden bakteriellen Gemeinschaft haben.
Mikroorganismen scheinen die jüngsten, vermutlich labilsten zur Verfügung stehenden
Kohlenstoffpools zu verstoffwechseln, da das 14 C-Alter einzelner PLFA-Biomarker immer
geringer war als das 14 C-Alter der Bodenhorizonte aus denen sie isoliert wurden. Es kann
zudem vermutet werden, dass diese mikrobiell genutzte organische Bodensubstanz
pflanzlichen Ursprungs ist, da die mikrobiellen PLFA-Biomarker ein ähnliches 14 C-Alter
wie die langkettigen Lipid-Biomarker (n-Alkane und n-Fettsäuren) und das freie partikuläre
organische Material (fPOM) haben. Das ansteigende 14 C-Alter der mikrobiellen PLFAs mit
der Bodentiefe deutet darauf hin, dass Mikroorganismen mit der Tiefe ältere
Kohlenstoffquellen nutzen. Diese Quellen scheinen aber immer noch das labilste
verfügbare organische Material pflanzlichen Ursprungs zu sein, da die fPOM-Fraktion ein
ähnliches 14 C-Alter wie die PLFAs aufweist. Daher ist es möglich, dass entweder ‚alte‘,
vermutlich stabilere Kohlenstoffpools nicht von den Mikroorganismen favorisiert werden
oder diese nicht bioverfügbar sind oder diese von anderen als den hier untersuchten
(aeroben) Bodenbakterien umgesetzt werden.
Abstract ... I Zusammenfassung (Summary in German) ... III
1. Introduction and objectives ... 1
1.1 Importance of permafrost ... 1
1.2 Objectives ... 4
1.3 Organisation of the thesis – Overview of the manuscripts ... 4
2. Material and methods ... 6
2.1 Study area – the Siberian Lena Delta ... 6
2.2 Methods ... 8
2.2.1 Bulk parameter methods ... 8
2.2.2 Organic geochemical methods ... 9
2.2.3 Compound-specific radiocarbon analysis ...10
3. Manuscript I: Quantifying the exogenous carbon contamination for compound- specific radiocarbon analysis – Status report on sample preparation facilities for 14 C analysis at the new CologneAMS center ... 12
4. Manuscript II: Stabilization mechanisms of organic matter – Organic matter composition and stabilization in a polygonal tundra soil of the Lena Delta ... 18
5. Manuscript III: Identification of microbial communities in active layer soils – Characterization of bacterial populations in Arctic permafrost soils using bacteriohopanepolyols ... 33
6. Manuscript IV: Microbial degradation of organic matter – 14 C contents of microbial phospholipids fatty acids reveal preferential metabolism of labile organic matter in Arctic permafrost soils ... 63
7. Synthesis and overall discussion ... 87
7.1 Organic matter composition and its distribution in polygonal tundra soils...87
7.2 Stabilization mechanisms of the organic matter in polygonal tundra soils ...88
7.3 Microbial communities in polygonal tundra soils ...89
7.4 Microbial utilization of organic matter ...90
8. Summary, conclusions and future perspectives ... 92
8.1 Summary and conclusions ...92
8.2 Future perspectives ...93
9. References of the chapters 1, 2, 6, and 7 ... 94
10. Acknowledgements ...100
11. Author contributions ... 102
12. Erklärung (Explanation in German) ... 103
1.1 Importance of permafrost
Permafrost is defined as perennially frozen ground which remains for at least two consecutive years at or below 0°C (Jones et al., 2010). The northern permafrost region covers about 16% of the global soil area (Fig, 1A; Tarnocai et al., 2009) and contains large amounts of organic carbon (1300-1370 Pg with an uncertainty range of 630- 1690 Pg), twice the amount of carbon currently in the atmosphere (Ciais et al., 2013).
Most of the carbon is found in permafrost soils (0-3 m: 1035+150 Pg) while much less is found in the deeper sediments (>3 m: 272+106 Pg; Hugelius et al., 2014). The top meter of the soil holds about 472+27 Pg of organic carbon (Fig. 1B; Hugelius et al., 2013;
Hugelius et al., 2014) which is about 50% of the global soil organic carbon storage (Jones et al., 2010). These large soil carbon stocks in high latitudes were formed in unglaciated regions prior to the last glacial maximum (Dutta et al., 2006; Zimov et al., 2006) and also in areas that have been deglaciated since then (Harden et al., 1992).
Fig.1: A) Circumpolar permafrost distribution (Jones et al., 2010) and B) soil organic carbon content within the first 1 m of the Arctic permafrost (Hugelius et al., 2013). The red square in Fig. 1 A localises the Siberian Lena-Delta, Russia.
Global warming is predicted to affect the high northern latitudes most strongly. Different models agree that the warming in the Arctic will be greater than the average global warming (Collins et al., 2013). Under the highest warming scenario (RCP 8.5) a
90°W
60°N 70°N 80°N
90°E
A B
(Saito et al., 2007; Schaefer et al., 2011). Furthermore, the Arctic warming will increase the thickness of the active layer, the permafrost top soil layer thawing annually during summer, which has been already observed in the North-West of Russian and in northern East Siberia during the last 15 years (Romanovsky et al., 2013). Thus, old carbon pools, previously frozen looked for the last hundreds or thousands of years, may get incorporated again into the active carbon cycle and turn this large carbon reservoir into a source of carbon emissions for the atmosphere (Khvorostyanov et al., 2008; Schuur et al., 2009; Schädel et al., 2014).
Recent studies have shown that with deeper thawing of the Arctic permafrost an increased plant and old soil carbon respiration occur, which are initially compensated by an increased net primary productivity, due to longer vegetation growing seasons (Euskirchen et al., 2006; Hartley et al., 2012; Hicks Pries et al., 2013). During a long-term in-situ warming experiment over 20 years in Alaska an increase of carbon in the deep mineral soil has been observed probably due to increasing root exudates and leachates (Sistla et al., 2013). However, due to the large carbon stocks in the soil these processes do not seem able to compensate the carbon release from thawing permafrost on a long term basis. Even a shift from a tundra ecosystem into a boreal forest could only compensate for about 10% of the carbon loss from the thawed permafrost soils (Schuur et al., 2008; Hicks Pries et al., 2013). Therefore, permafrost thawing is likely to have a positive feedback on climate warming, even though the topic is still under debate (Davidson and Janssens, 2006; Ciais et al., 2013) and includes uncertainties about the size and bioavailability of the carbon that is released from the thawing permafrost (e.g., Shaver et al., 2006; Schuur et al., 2008; Nowinski et al., 2010; Harden et al., 2012; Schuur et al., 2013). A recent published synthesis study by Schädel et al. (2014) of long-term (>1 year) incubations of soil effected by permafrost across the Arctic showed that using a three-pool decomposition model less than 5% of all carbon was labile at 5°C and decomposed rapidly within one year. The slow carbon pool contained between 10-90% of total carbon with a turnover time of 5-15 years. The soil organic carbon loss was projected to be between 20% and 90% within 50 incubation years (Schädel et al., 2014). Data of another incubation study of Siberian organic and mineral soils suggest that with higher temperatures recalcitrant compounds are preferentially respired by soil microbes (Biasi et al., 2005). However, incubation studies exclude the in-situ environmental conditions. In- situ studies at various permafrost sites have shown greater amounts of old carbon emissions with increased thawing of the permafrost. An in-situ snow addition experiment with snow fences in Alaska found older carbon emissions with increased thickness of the active layer 13 years after the fence installation (Nowinski et al. 2010). Schuur et al.
(2009) compared sites whereby some have experienced permafrost thawing over
permafrost soils is highly bioavailable for degradation but the actual (today’s) occurring degradation and/or stabilization processes in the active layer covering permafrost soils are not understood well.
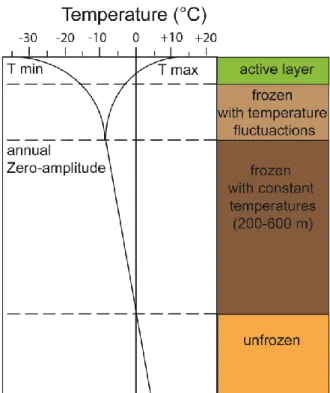
Microbial metabolic activity is a key factor in the mineralization of soil organic matter (OM) and the active layer is the main place for soil OM decomposition within the permafrost. All three domains of microorganism (bacteria, archaea, and fungi) are present in the harsh permafrost environment (e.g., Jansson and Tas, 2014) dominated by its low temperatures and great annual temperature fluctuations (Fig. 2). Generally, bacteria seem to dominate in diversity and abundances the microbial communities in active layers (Steven et al., 2008; Yergeau et al., 2010) and have adapted to these extreme conditions through metabolic regulation (Jansson and Tas, 2014 and references there in). However, so far it is not well known which carbon pools are preferable metabolised by microorganisms.
Fig. 2: Permafrost temperature profile with maximum (T max) and minimum temperature (T min) over the year and over depth modified after Washburn (1973) and Boike et al. (2013)
Stabilization of OM in temperate surface soils is well studied (Sollins et al., 1996; von
Lützow et al., 2007; Kögel-Knabner et al., 2008). Physical protection mechanisms as the
formation of soil aggregation or organo-mineral associations were found to be more
important than the chemical recalcitrance of the organic compounds (Marschner et al.,
This study concentrates on obtaining basic knowledge about the soil OM composition and dynamic of the polygonal tundra of the Siberian Lena Delta in Russia (Fig. 1 and 3). The polygonal tundra covers only 3% of the Arctic landmass (Minke et al., 2007). However, sustainable amounts of the greenhouse gas CH 4 are already being emitted here due to the large areas of wetlands (McGuire et al., 2009) and the deeper old carbon stocks are predicted to turn into additional carbon sources for the atmosphere with permafrost degradation and a thickening active layer due to global warming (e.g., Schuur et al., 2009;
Nowinski et al., 2010). Therefore, a basic understanding of today’s soil OM composition and dynamic within the active layer is required to project reactions between this system and global warming. Microbial degradation is a key factor in the soil OM dynamic and the main place for microbial activity in permafrost soils is the active layer. Thus, this thesis concentrates on the active layer soil horizons and the still frozen permafrost top layer. So far very little is known about the quality of the soil OM, possible mechanisms for the stabilization of the soil OM and its availability for the living microorganisms in the active layer of permafrost soils in the polygonal tundra.
The main objectives of this thesis were to:
Determine different exogenous carbon contaminations (process blank) during compound-specific radiocarbon analysis (Manuscript I)
Characterise the soil organic matter (OM) composition and its distribution in the polygonal tundra soils of the Lena Delta (manuscript II + manuscript IV)
Identify stabilization mechanisms of the soil OM in polygonal tundra soils of the Lena Delta (manuscript II)
Investigate the microbial communities in the polygonal tundra soils of the Lena Delta (manuscript III + IV)
Determine which carbon pools (‘young’/labile or ‘old’/stable) are metabolised mainly by the microbial community in polygonal tundra soils of the Lena Delta (manuscript IV)
1.3 Organisation of the thesis – Overview of the manuscripts
A general introduction into the Siberian study area (Lena Delta) and the methods used in
this thesis are given in chapter 2. Chapters 3 to 5 are independent manuscripts (I – III)
which have been published or were under review in peer-reviewed international journals
during the time this thesis was submitted (February 2015). Chapter 6 includes further
results written in the form of a paper manuscript (IV) in preparation for submission. In
the new CologneAMS dating centre are described in detail. One main subject was the evaluation of process contaminations during the pre-treatment (preparative gas- chromatography) of single organic compounds for 14 C analysis. The process contaminations are relatively small which allows the 14 C analysis of individual bacterial and high plant wax lipids, known as compound-specific radiocarbon analysis, to evaluate the degradation of organic material in the active layer of permafrost soils (see manuscript IV/chapter 6).
In chapter 4 (manuscript II) the soil OM of an active layer in the Lena Delta polygonal tundra is characterized and stabilization mechanisms of the OM are investigated. The OM is mainly composed of undecomposed, plant derived material. By analysing physical soil fractions with lipid biomarker and 14 C analysis, it was suggested that the main stabilization mechanisms of OM in temperate soils (formation of soil aggregates and organo-mineral associations) seem to have little effect on this active layer soil (manuscript II). This suggests that soil OM is available for microbial degradation. In chapter 5 and 6 this statment is further investigated. The microbial community is identified (chapter 5 and 6) using two microbial membrane lipid biomarkers, bacteriohopanepolyols (BHPs;
manuscript III) and phospholipid fatty acids (PLFAs; manuscript IV). In chapter 6
(manuscript IV) compound-specific radiocarbon analyses of single or pooled microbial
PLFA lipids were performed to identify ‘young’, presumably labile and/or ‘old’, presumably
stable carbon pools which are metabolised by microorganisms. In combination with 14 C
analysis of isolated single plant wax lipids (n-alkanes and n-fatty acids) and further
physical soil fractions, information on the origin of the microbial metabolised carbon pools
was gained.
This chapter gives a short overview of the study area and the methods used in this thesis.
Further details are described in the individual manuscripts.
2.1 Study area – the Siberian Lena Delta
The study sites (Fig. 3) are located in the Lena Delta in Siberia (Russia). Covering 32,000 km 2 , the Lena Delta is the largest delta in the Arctic (Are and Reimnitz, 2000) and is located in the zone of continuous permafrost with a thickness between 400-600 m in this region (Romanovskii and Hubberten, 2001). The climate is arctic continental with a low annual mean precipitation (125 mm) and low annual mean air temperatures (-12.5°C), but with great seasonal temperature differences between summer (July 10.1°C) and winter (February -33.1°C; Boike et al., 2013).
Kurungnakh Island Samoylov Island
The first terrace covers the recently active and mainly eastern part of the delta and is made up of Holocene fluvial sediment. It is characterised by an ice-wedge polygonal tundra, large thermokarst lakes and active flood plains. Ice wedges form through seasonal frost-cracking repeatedly pushing material upwards to form elevated rims (Fig. 4; e.g., Fiedler et al., 2004). The second terrace comprises mainly the north-western part of the delta and consists of a several tens of meters thick sediment layer predominated by fluvial sand which was deposited between the Late Pleistocene and early Holocene. Its landscape is dominated by sandy sediments with low ice content and many large thermokarst lakes (Schirrmeister et al., 2011). Erosional remains of a Late Pleistocene accumulation plain in the foreland of the Chekanovsky ridge, south of the delta, form the third terrace. It consists of three units: a lower 15-20 m thick sand unit of fluvial deposits of the Paleo-Lena River, covered by an approx. 15 m thick ice complex (Russian: Yedoma) unit which is made of large ice-wedges and paleosols of clastic material from the Chekanovsky Ridge. On top of the Yedoma is a 2-3 m thick Holocene unit of mostly aeolian silty sand with small ice wedges (3-5 m wide). The landscape of the third terrace is characterised by polygonal tundra and thermokarst features (Schwamborn et al., 2002;
Schirrmeister et al., 2003; Morgenstern et al., 2011; Schirrmeister et al., 2011; Zubrzycki, 2013).
centre
rim 9-15 m
centres also contain some sedges and dry polygon rims lichens, some herbs and willow shrubs (Mueller, 1997; Boike et al., 2013). The tree line is pushed north by the Lena River to the very south of the Delta where small larch (Larix spp.) are growing. According to the US Soil Taxonomy, the soils in the Delta belong to the soil type Gelisols represented by various great groups (Soil Survey Staff, 2010). The first and third terraces are dominated by Glacic Aquiturbels on polygon rims and Typic or Ruptic Historthel in depressed polygon centres. Typic Psammoturbel dominate on the second terrace (Zubrzycki et al., 2012). In northern latitudes the soil type Gelisols covers an area of about 27% (Jones et al., 2010).
Within the Lena-Delta the study sites were located on Samoylov Island (72.37° N, 126.48° E) and on Kurungnakh Island (72.32° N, 126.24° E; Fig. 3). Samoylov belongs to the first, recent active delta-terrace and Kurungnakh is part of the third terrace (Yedoma).
On both sites only the top Holocene unit was sampled.
2.2 Methods
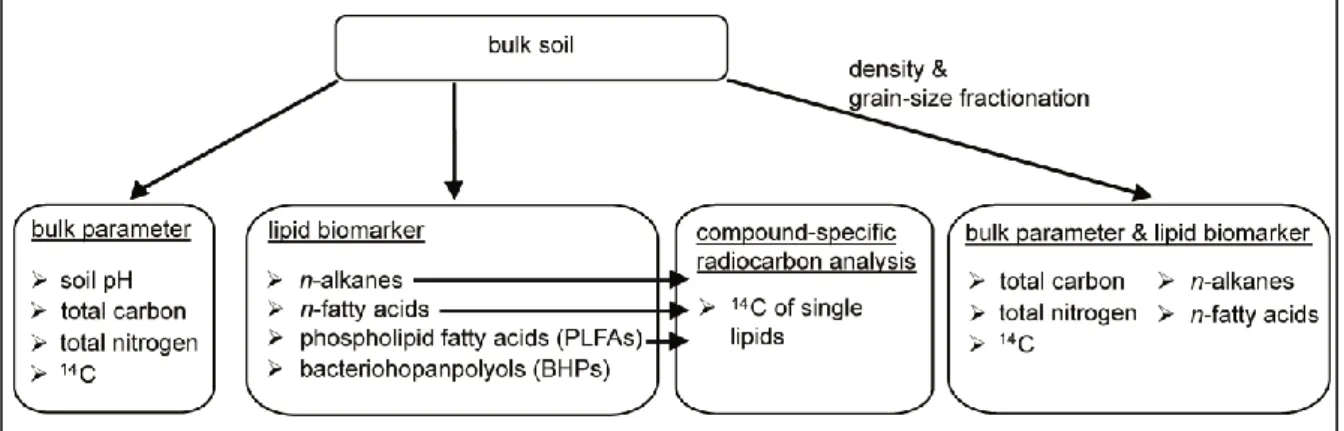
Samples were taken from a soil pit (1x1 m) in August 2009 and 2010 when the active layer thickness is greatest. The soil samples were immediately frozen after sampling and stayed frozen during transport to Germany. Prior to all analyses the soil material was freeze-dried (Fig. 5).
Fig. 5: Overview of methods used in this thesis
2.2.1 Bulk parameter methods
A short description of the methods used to measure the bulk parameters in this thesis is given here. Details are provided in the respective manuscripts.
Total carbon and total nitrogen: with an Analyzer vario MICRO cube (Elementar,
measured as graphite in an accelerated mass spectrometer (AMS; at the ETH Zurich and the CologneAMS; manuscript II and IV)
2.2.2 Organic geochemical methods
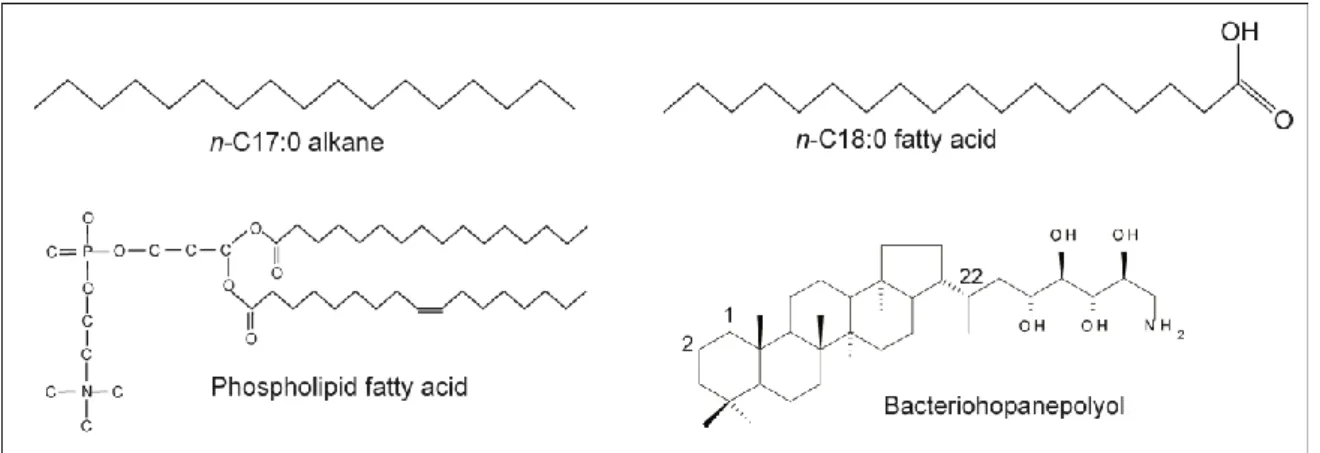
Several different lipids were analysed in this thesis (Fig. 6). In order to gain the lipids from the samples various analytical steps were necessary (Fig. 7). The total lipid fraction was extracted from the soil with organic solvent (e.g., dichlormethane or methanol) using three different ways:
with the automatic solvent extraction system (ASE; Dionex, USA; manuscript II, IV)
placing the mixture of soil and organic solvent in an ultrasonic bath (manuscript II, III)
shaking the mixture of soil and organic solvent for several hours (manuscript III, IV).
Further wet chemical methods have been used in this thesis to purify the lipid biomarkers:
Saponification: to free bounded fatty acids by cleavage of ester bounds
Silica gel chromatography: to separate the neutral lipid fraction into fractions of different polarity: aliphatic hydrocarbons (n-alkanes), aromatics (ketones), and hetero-compounds (including alcohols, sterols)
Methylation: esterification of the COOH-group of the n-fatty acids so that the compounds can be measured on the gas chromatograph (GC)
Fig. 6: Examples of biomarkers used in this thesis
Measurements of the different lipid biomarkers were taken using various instruments:
Scientific, USA): PLFAs (manuscript IV)
2.2.3 Compound-specific radiocarbon analysis
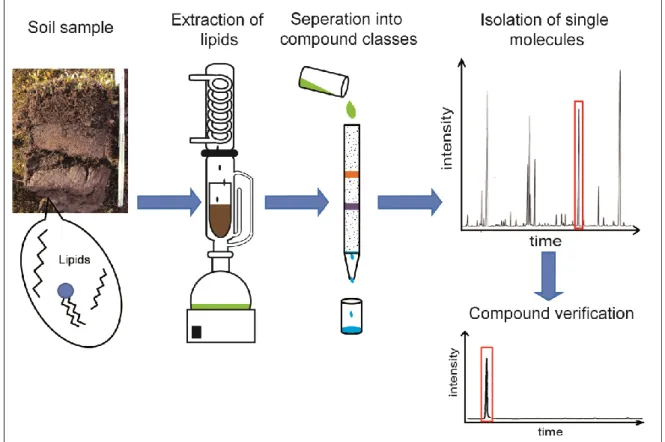
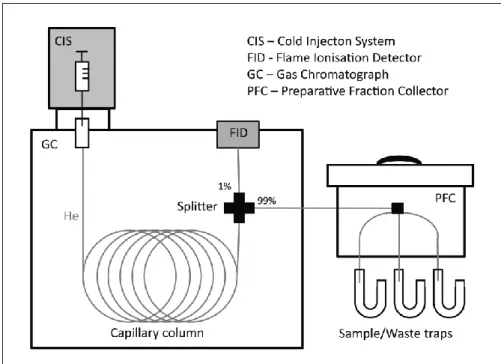
For the compound-specific radiocarbon analysis (CSRA) larger amounts of soil samples (mostly > 180g) need to be extracted to gain enough material for a single compound (>30- 100 µgC) for the 14 C AMS measurement. Therefore, the lipid extraction with organic solvents was done using the Soxhlet apparatus instead of using an ASE or an ultrasonic method (manuscript IV). After further purification steps described in 2.2.2, single lipids were isolated from the lipid compound class (Fig. 7) by using a preparative gas- chromatograph (prepGC; Fig. 8; Eglinton et al., 1996).
Fig. 7: Schematic diagram of lipid extraction and isolation of single compounds
After the isolation, single lipids were tested for contaminations on a GC-FID. Pure
compounds were then transferred using an organic solvent into pre-combusted quartz
tubes. The tubes were evacuated, flame sealed and combusted converting the organic
carbon into carbon dioxide. The gas was purified and quantified under vacuum and then
Fig. 8: Schematic diagram of a preparative gas-chromatographic system (prepGC) with a preparative fraction collector (PFC) for the isolation of single molecules
A contamination validation (manuscript I) of the purification prepGC system was
completed by analysing n-alkane and n-fatty acid standards (of each modern and 14 C free)
untreated and treated the same way as the target lipids. After the 14 C measurements of
the target compounds, their 14 C contents were corrected for the exogenous carbon
introduced during the chromatographic isolation and subsequent sample handling
(process blank) using an isotopic mass balance calculation (manuscript IV).
3. Manuscript I: Quantifying the exogenous carbon contamination for compound-specific radiocarbon analysis – Status report on
sample preparation facilities for 14 C analysis at the new CologneAMS center
by
Rethemeyer J., Fülöp R.-H., Höfle S. , Wacker L., Heinze S., Hajdas I., Patt U., König S., Stapper B., Dewald A. (2013)
Nuclear Instruments and Methods in Physics Research B 294 , 168–172.
Status report on sample preparation facilities for 14 C analysis at the new CologneAMS center
J. Rethemeyer
a,⇑ , R.-H. Fülöp
a, S. Höfle
a, L. Wacker
b, S. Heinze
c, I. Hajdas
b, U. Patt
a, S. König
a, B. Stapper
a, A. Dewald
caInstitute of Geology and Mineralogy, University of Cologne, 50674 Cologne, Germany
bIon Beam Physics, ETH Zürich, 8093 Zürich, Switzerland
cInstitute of Nuclear Physics, University of Cologne, 50674 Cologne, Germany
a r t i c l e i n f o
Article history:
Received 31 May 2011
Received in revised form 7 February 2012 Available online 18 February 2012
Keywords:
New AMS facility
Radiocarbon sample preparation Process blank
Small samples
Compound specific radiocarbon
a b s t r a c t
The new AMS facility at the University of Cologne (CologneAMS), Germany, was established in 2010 with the delivery of the HVE 6 MV Tandetron AMS, which will be used for
14C,
26Al,
36Cl,
41Ca,
129I,
239U and
244
Pu analyses. Parallel to the AMS installation the radiocarbon group has started to set up and test sam- ple preparation methods and instruments for different materials. We present first results of reference and standard materials that have been processed and graphitized in our lab and measured at the ETH and CologneAMS facilities. The graphitization blank and its influence on small samples sizes processed with an automated graphitization system have been determined. Work on isolation of individual organic compounds with a preparative gas chromatography system has been started. The focus of our future work will be on reducing process blank levels and sample sizes as well as on the application of com- pound-specific radiocarbon analyses in (paleo-) environmental research.
Ó 2012 Elsevier B.V. All rights reserved.
1. Introduction
The new AMS facility at the University of Cologne, Germany (CologneAMS) is based on a 6 MV Tandetron system from High Voltage Engineering Europe (HVE; the Netherlands) that will be used for the analysis of
10Be,
14C,
26Al,
36Cl,
41Ca,
129I,
239U and
244
Pu. The AMS was funded by the German Research Foundation (DFG) in 2007 and the installation of the system in the Institute of Nuclear Physics at the University of Cologne was started in May 2010 after completion of extensive reconstructions of an existing building. The CologneAMS facility is run collaboratively by the Institute of Geology and Mineralogy and the Institute of Nuclear Physics with two working groups being responsible for sample preparation.
Parallel to the AMS installation the radiocarbon group, which replaces the former conventional radiocarbon dating laboratory at the Institute of Prehistoric Archaeology, has started to establish and test sample preparation methods for different materials and to set up instruments for sample conversion into AMS graphite targets. The preparation of radiocarbon samples is integrated in the existing organic geochemistry laboratories at the Institute of Geology and Mineralogy. This provides additional possibilities including the gas chromatographic isolation of individual organic molecules for compound-specific radiocarbon analysis.
Here, we present a brief overview of the methods and instru- ments we currently use for the pretreatment of organic materials, carbonate samples, and bones for AMS radiocarbon dating. First re- sults of tests with reference and standard materials are shown as well as the process blank of the automated graphitization equip- ment (AGE) [1] and sample size limits that can be processed reli- ably. We also present first tests performed to determine extraneous carbon added during the isolation of individual organic compounds with preparative gas chromatography. AMS
14C mea- surements were performed with the MICADAS AMS at ETH Zurich (Switzerland) [2,3], and after installation, with our new 6 MV HVE Tandetron AMS [4].
2. Sample preparation methods
The amount and type of samples that should be radiocarbon da- ted define the type and intensity of the necessary pretreatment.
The different pretreatment approaches described below are cur- rently used in our laboratory for organic samples, carbonates, and bones.
2.1. Pretreatment of organic material
Organic samples are first inspected under a microscope for vis- ible contaminants that can be removed mechanically. Most organic materials including marine and lake sediments, charcoal, wood, and plant remains are chemically extracted by standard acid–alka- 0168-583X/$ - see front matter
Ó2012 Elsevier B.V. All rights reserved.
doi:10.1016/j.nimb.2012.02.012
⇑ Corresponding author.
E-mail address:janet.rethemeyer@uni-koeln.de
(J. Rethemeyer).
Contents lists available at SciVerse ScienceDirect
Nuclear Instruments and Methods in Physics Research B
j o u r n a l h o m e p a g e : w w w . e l s e v i e r . c o m / l o c a t e / n i m b
li–acid extraction (AAA) to remove inorganic carbon and humic substances, which may have been transported from other depth intervals in the soil or sediment layers that should be dated [5].
The AAA procedure starts with an acid extraction of the sample (1% HCl, ca. 10 h, room temp.; carbonate-rich samples are heated ca. 1 h, 60 °C) followed by washing of the residue repeatedly with Milli-Q water (Millipore, USA). For very small samples the extrac- tion time is reduced (1 h, room temp.) and no alkali extraction is applied. The alkali extraction with 1% NaOH (4 h, 60 °C) yields an alkali-soluble fraction and a non-soluble residue (humin). Humic acids are precipitated from the soluble fraction by acidification with 37% HCl to pH < 1 followed by rinsing the precipitate with Milli-Q water to a pH of about 2. The acid and alkali insoluble res- idue, the humin fraction, is also washed repeatedly with Milli-Q water and treated again with 1% HCl (ca. 10 h, room temp.) to re- move atmospheric CO
2which might have been introduced during the alkali extraction, and finally rinsed with Milli-Q water to pH > 4.
2.2. Bone pretreatment
A discussion of the various problems associated with bone pre- treatment can be found in [6,7]. We have tested the following ap- proach for cleaning of bones and extraction of the collagen fraction: a 3–5 g bone subsample is cut from the original sample.
The surface of the subsample is abraded with a diamond drill and cleaned twice with Milli-Q water in an ultrasonic bath (15 min). After drying, the sample is inspected under a microscope for any contamination that might have been introduced during handling and then crushed into small pieces. If necessary, organic contaminants including conservation products are removed with a sequence of organic solvents of increasing polarity starting with hexane, followed by dichloromethane, and methanol (12 h each;
modified after [8]). Large samples are extracted in glass fiber thim- ble in a Soxhlet extractor and small samples in an Accelerated Sol- vent Extraction system at 120 °C and 75 bar (ASE 200; Dionex, USA) using the same sequence of organic solvents as above and an extraction time of 30 min for each solvent.
The dried samples are decalcified with 1 M HCl (at least 3 h, room temp.). The samples are further cleaned from insoluble con- taminants and humic substances by adding Milli-Q water and thereby increasing the pH to about 3 while the sample is placed in the agitating water bath (24 h, 60 ° C). After cleaning the samples are converted into gelatin, [9,10] which is subjected to hot filtra- tion (60 °C) through glass fiber filters. If necessary the volume of the filtrate is reduced under a N
2stream while heated at 40 ° C, and finally the gelatin is freeze-dried and converted to graphite as described below (Section 2.5).
2.3. Carbonate pretreatment and hydrolysis
We use a newly developed hydrolysis system described in detail by Wacker et al. [11] in which carbonates are converted into CO
2with H
3PO
4in septum sealed vials under a He atmosphere. This system eliminates the usage of liquid nitrogen and self-made high vacuum systems for gas purification after carbonate hydrolysis in evacuated glass tubes as it is often done. A further advantage is that the hydrolysis procedure can be automated by using an auto-sampler, which can be coupled with the AGE system.
Briefly, visible contaminations on the carbonate surface are mechanical removed, followed by washing with Milli-Q water in an ultrasonic bath to remove soil remains and recrystallized shell material [12]. The surface of the shell is then leached with 1 M H
2SO
4, which is neutralized with Milli-Q water. After drying, the sample is pulverized and transferred to cleaned (dichloromethane rinsed, combustion at 450 °C) 12 ml Labco
Òvials (Labco Limited,
UK), which are closed with septum caps. After air is removed from the vial with a He flow through a double-walled needle (Thermo, Germany) at a rate of 100 ml/min for 12 min, 99% H
3PO
4is added and left to react for 6 h at 75 °C. The evolved CO
2is transferred with a He flow to the AGE system while water is retained on a water trap (phosphorus pentoxide).
2.4. Isolation of individual organic compounds
Compound-specific radiocarbon analysis involves the extraction of the desired fraction (often lipids) from the sample material, fol- lowed by different purification procedures like chromatographic separation of compound classes of different polarities and often the isolation of individual molecules with preparative gas or liquid chromatography [13,14]. Each step of the complex procedure may introduce contaminants.
We performed first tests with dated GC standards to quantify the amount and origin of extraneous carbon introduced during the gas chromatographic isolation of individual organic com- pounds. The preparative gas chromatograph (PC-GC) consists of a GC (7680 Agilent, USA) equipped with a CIS 4 injection system (Gerstel, Germany) and a ‘megabore’ ultra-low bleed capillary col- umn (30 m, 0.53 mm I.D.; Restek, USA), which is coupled with a fraction collector (PFC; Gerstel, Germany). Two n-alkanes and two n-carboxylic acids GC standards with modern and (close to) fossil
14C concentration were chosen in order to monitor possible modern or fossil carbon contributions (Table 1). The standards were dissolved in dichloromethane or hexane and repeatedly in- jected (50–100) in the PC-GC system. The column temperature for n-alkanes and for n-fatty acids was increased from 70 to 150 ° C at 20 ° C min
1and then to 320 ° C at 10 ° C min
1and main- tained for 9 min. The PFC transfer line was heated constantly at 320 °C. Long-chain compounds (>C
24) were first trapped at 60 °C but compound recoveries could be increased by leaving the traps of the fraction collector at room temperature for short and long chain compounds. The isolated compounds were recovered from the glass traps of the PFC with 1000 l l dichloromethane and mea- sured on a GC with flame ionization detector (FID) to check purity and recovery of the isolated compound. After solvent evaporation under N
2stream, some compounds were converted to graphite with the AGE system as described below (Section 2.5). Because of the stronger influence of the EA-AGE blank (Section 3.1) on small samples sizes typically isolated with PC-GC, most isolated compounds (30–140 l g C) were combusted in quartz tubes
Table 1
First results of recovery and contamination tests of the PC-GC system with dated GC standards (n-carboxylic acids,
n-alkanes). Carboxylic acids were isolated as methylesters and
14C results were corrected for the methyl carbon from methanol (0 pmC).
Samples were converted to graphite with the AGE system or by sealed tube combustion to CO
2and measured directly with the MICADAS gas ion source
[15,16].14
C values are corrected for combustion and graphitization blank.
GC standard Treatment
nRecovery
f(%)
14C (pmC)
Octadecanoic acid
aUntreated 1 106.38 ± 0.15
PC-GC
e3 99 101.95 ± 1.62
Triacontanoic acid
bUntreated 1 0.25 ± 0.07
PC-GC
e4 86 3.63 ± 1.41
Octadecane
cUntreated 1 <0.08
PC-GC 4 91 3.95 ± 0.74
Hexamethyl tetracosane
dUntreated 1 101.87 ± 0.33
PC-GC 3 72 100.42 ± 2.47
a
Fluka, Prod. No. 85679-500MG (Lot. BCBB2165).
b
Sigma, Prod. No. T3527-100MG (Lot. 018K3760).
c
Fluka, Prod. No. 74691-5G (Lot. 0001448903).
d
Fluka, Prod. No. 85629-50ML (Lot. 0001418796).
e
Includes one compound measured as graphite.
f
Compound recovery was quantified with GC-FID.
(900 °C, 4 h) with copper oxide (ca. 60 mg), both pre-combusted, and the purified CO
2was measured directly with the MICADAS gas ion source [15,16].
2.5. Sample combustion, hydrolysis and graphitization
We use an advanced version of the AGE system [1] coupled with an elemental analyzer (EA; VarioMicroCube, Elementar, Germany) for the combustion and graphitization of organic samples. The EA is equipped with a combustion tube filled with PbCrO
4and copper oxide and a reduction tube with copper and silver wool. Depending on sample size, pretreated organic samples are weighed into tin boats (H W D: 4 4 11 mm, IVA, Germany) and combusted in the EA. Water evolved during sample combustion is retained on a water trap (phosphorus pentoxide) in the EA and the pure CO
2is transferred to the zeolite trap of the AGE. The CO
2is ther- mally desorbed from the zeolite trap and released into a reactor of the AGE where it is converted to graphite with hydrogen over iron as catalyst (Alfa-Aesar, iron powder, spherical, <10 micron).
We tested the removal of contamination from the tin containers by cleaning them twice with dichloromethane, which reduced blank levels for smaller samples sizes. We thus included this step in our sample processing protocol.
For carbonate hydrolysis, the CO
2transfer line of the EA is dis- connected from the AGE and replaced by a transfer line to the hydrolysis device described above (Section 2.3) and in detail by Wacker et al. [this issue]. To prevent contamination all graphitized samples are stored in argon filled glass tubes before pressing into AMS target holders with a pneumatic sample press (ETH Zurich).
3. Results and discussion 3.1. Process blank
The assessment and minimization of the process blank is essen- tial as it limits the measurement of small samples sizes and old material. Carbon contamination is introduced during chemical pro- cessing and transformation into graphite. A major source of con- tamination is the combustion of organic materials either in quartz ampoules or in EA tin containers [15,17,18]. We evaluated the blank of the AGE and tested to reduce the contamination orig- inating from the tin containers by cleaning them with dichloro- methane (GC grade quality). No significant blank reduction (tested with anthracite, RAG Anthrazit Ibbenbueren GmbH, Ger- many) was discernible for normal sized (1 mg) samples. To im- prove the blank values obtained, a new coal (Pocahontas #3, Argonne National Laboratory, USA) has been used to test the size dependency of graphitization blanks. The coal was prepared in sol- vent cleaned tin boats. For small sample sizes ranging from 150 to 350 l g C (Fig. 1a) still reasonable blank value of 0.52 pmC (pmC re- lated to 1950) equivalent to 43,400 ± 600 years BP were obtained.
Samples smaller than 120 l g C are strongly influenced by contam- inants probably of other origin. The blank calculated according to the model of constant contamination [15,19] assuming a contami- nation with 75 pmC was fitted to the experimental data (Fig. 1a) yielding about 1.7 l g C (anthracite) and 0.7 l g C (Pocahontas coal).
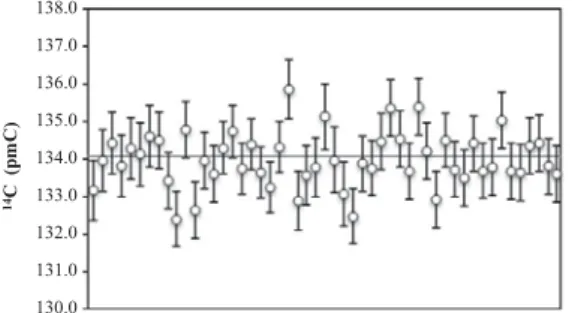
Normal sized (1 mg) samples measured at CologneAMS yield an average blank value of 0.12 pmC for cleaned tin boats (Fig. 1b).
The contribution of old contaminants including solvent remains was checked by the analyses of modern standards including OX- II (Fig. 2) and some VIRI samples (Table 2), which were not
14C de- pleted. The scatter in the blank results (Fig. 1a and b) reflects that the contamination introduced is variable in size and
14C concentra- tion. More detailed tests need to be performed to evaluate possible sources of contamination besides the tin containers.
First results of blank tests of the new carbonate hydrolysis ap- proach in septum sealed vials under a He atmosphere are pre- sented in Wacker et al. [this issue]. The method yields very low blank values even for small sample sizes (e.g. 300 l g C,
>48,500 ± 800 years BP). A constant contamination similar to the one of the combustion in the EA is not observed suggesting that the carbon contamination observed for organic samples is intro- duced during sample combustion in the EA.
3.2. PC-GC blank
Compound-specific
14C analysis is challenged by the small sam- ple size and the many steps necessary for the extraction and puri- fication of individual organic compounds, which may introduce
0.0 0.5 1.0 1.5 2.0
0.0 0.2 0.4 0.6 0.8
14
C (p m C )
C weight (mg)
Uncleaned boats (COL1001) Cleaned boats (COL1001) Cleaned boats (COL1000) Constant contamination (1.7 μg C) Constant contamination (0.7 μg C)
0.00 0.05 0.10 0.15 0.20
14
C (p m C )
(a)
(b)
Fig. 1.
(a)
14C concentration of blank material (coal, anthracite) vs. sample size measured at ETH Zurich. The curves are calculated with the model of constant contamination: 1.7 l g C (uncleaned) and 0.7 l g C (cleaned tin containers) of 75 pmC with an offset of 0.2 pmC. (b) Results for normal sized coal (1 mg C) measured at Cologne with 2- r uncertainties (dashed lines).
130.0 131.0 132.0 133.0 134.0 135.0 136.0 137.0 138.0
14
C (p m C )
Fig. 2.14
C result of OX-II (1 mg C) measured in Cologne (line represents reference
values).
contamination that is difficult to quantify [14,20,21]. Initial tests with GC standards of modern and fossil origin show compound recoveries for the n-alkanes and n-carboxylic acids of intermediate (C
18) and long chain length (C
30) between 72% and 99% (traps at room temp.; Table 1). Lower recoveries were obtained for long chain compounds initially trapped at 60 ° C to avoid compound crystallization in the intersection of the PFC capillaries into the glass traps which apparently caused material losses. Contaminants introduced during the gas chromatographic isolation were deter- mined by GC-FID analysis and were less than 0.6%. The
14C deple- tion of the isolated modern and the
14C enrichment of the old/fossil GC standards relative to the untreated material reflect the contri- bution of exogenous carbon from both, modern and fossil sources as also observed in previous studies [18,21]. The difference in
14C concentration between the untreated standard material and the isolated compounds was 3.4 and 4.0 pmC for old/fossil material and for modern material 4.4 and 1.5 pmC (n-carboxylic acids and n-alkanes, respectively; Table 1). The
14C concentration of the exogenous carbon (
14C
blank) and its amount (C
blank) cannot be determined directly. Thus, dated standard materials processed in a similar way like the target compounds and isotopic mass balance calculation are often used to determine both parameters. Using our results for the isolated standards (
14C
measuredand C
measured) and for untreated material (
14C
sampleand C
sample) we estimated C
blankby mass balance calculation (Eq. (1)) assuming that
14C
blankis either modern (106 pmC) or fossil (0 pmC).
14
C
measuredC
measured¼
14C
sampleC
sampleþ
14C
blankC
blankð 1 Þ
with C
measured= C
sample+ C
blank.
The mass of exogenous carbon (
14C
blank: 0 pmC) introduced dur- ing GC isolation and subsequent sample preparation for the AMS measurement was about 3.9 ± 1.6 l g C (octadecanoic acid) and 1.1 ± 2.4 l g C (squalane) for modern standard material. For the old standards C
blank(
14C
blank: 106 pmC) was in a similar range with 2.1 ± 1.4 l g C (triacontanoic acid) and 3.8 ± 0.7 l g C (octadecane).
Possible source of contamination are column and septa bleed, incomplete solvent removal and all steps of sample handling including compound removal from the glass traps and transfer into quartz ampoules, solvent evaporation and sealed tube combustion.
We could not remove contamination derived from column bleed by eluting the isolated compound over a silica gel column as sug- gested by Ohkouchi et al. [22]. Since GC analysis of the isolated compounds shows very little contamination, we suppose that fur- ther processing of the isolated compounds and sealed tube com- bustion are major sources of contamination. Further analyses are necessary to differentiate contaminants introduced during the dif- ferent processing steps including GC isolation, further sample han-
dling and combustion as well as to explain the relatively large scatter of the
14C results for the replicate isolations (n = 3–4) of the different standards.
3.3. Standards and VIRI samples
To assure the quality of the sample handling and graphitization procedure we measured a selection of organic and bone standard materials from the Fifth Radiocarbon Intercomparison exercise (VIRI; [23,24]), IAEA and the Oxford Radiocarbon Laboratory [25]
shown in Table 2. The results are in good agreement with the con- sensus values. This also applies to the VIRI bone material and the Oxford mammoth bone. The radiocarbon free mammoth bone (>147k years) yields a very good blank value (52k years) without ultrafiltration of the gelatinized collagen.
4. Summary
We presented first results for reference and standard materials that have been processed and graphitized in the Radiocarbon lab- oratory of the new CologneAMS facility, including organic materi- als and bones, which agree well with consensus values. The process blank for organic samples combusted in an elemental analyzer and graphitized with the AGE for normal sized samples (ca. 1 mg C, measured in Cologne) was 0.12 pmC. A constant contamination of about 0.7 l g C with 75 pmC was determined, which derives mainly from the combustion of organic samples in the elemental analyzer including the tin containers. For small sample sizes of about 150–350 l g C reasonable blank values (40,500 ± 500 years BP for 150–160 l g C) were still obtained, while smaller sample sizes (<150 l g C) were strongly influenced by the contamination introduced preventing the preparation of individual organic com- pounds isolated with preparative GC with the AGE.
14C results of dated GC standards (n-alkanes and n-carboxylic acids) isolated with preparative GC revealed the contribution of both, fossil and modern contaminants during the GC isolation plus sample han- dling and combustion procedure. Future work will thus focus on the identification, quantification and reduction of contaminants introduced during all steps of this procedure as well as on the reduction of the AGE process blank for organic materials.
Acknowledgments
We thank Benedict Behr-Heyder for his assistance in sample preparation. Thanks are also due to Marian Scott (University of Glasgow) for providing VIRI samples and to two anonymous reviewers for their constructive comments.
Table 2
Results for reference materials (ca. 1 mg C) graphitized with the AGE.
Sample Material Measured value Reference value
nAMS measurement
IAEA C5
aWood 23.30 ± 0.12 pmC 23.05 ± 0.02 pmC 2 ETH
IAEA C6 Sucrose 150.41 ± 0.28 pmC 150.60 ± 0.10 pmC 5 ETH
IAEA C8 Oxalic acid 15.06 ± 0.09 pmC 15.03 ± 0.17 pmC 2 ETH
VIRI M
bWood 73.61 ± 0.41 pmC 73.90 ± 0.03 pmC 4 COL
VIRI O Cellulose 98.41 ± 0.55 pmC 98.46 ± 0.04 pmC 4 COL
VIRI S Barley mash 108.85 ± 0.61 pmC 109.96 ± 0.04 pmC 3 COL
VIRI T Humic acid 65.75 ± 0.37 pmC 65.82 ± 0.03 pmC 3 COL
VIRI U Humic acid 22.98 ± 0.15 pmC 23.08 ± 0.02 pmC 3 COL
VIRI H Whale bone 9618 ± 48 years BP 9528 ± 7 years BP 4 COL
VIRI I Whale bone 8373 ± 47 years BP 8331 ± 6 years BP 4 COL
Ox M
cMammoth bone 52,290 ± 1583 years BP >147k years BP 4 COL
a
IAEA Reference Products, Vienna, Austria.
b
VIRI: fifth radiocarbon intercomparison
[22,23].c
![Table 3. Relative contents [%] of chemical structures identified by 13 C-CPMAS NMR spectroscopy in the clay fraction (< 2 µm) and in free (fPOM) and occluded particulate organic matter < 20 µm (oPOM <20 ).](https://thumb-eu.123doks.com/thumbv2/1library_info/3691335.1505599/32.892.161.735.195.373/relative-contents-chemical-structures-identified-spectroscopy-fraction-particulate.webp)
