Radiocarbon ages of dissolved and par- ticulate organic matter in small water
bodies of the Lena Delta
Number of Pages 41
Number of Fig. 20, Number of Tab. 11, Number of Appendix 5
provided as
Bachelorthesis
at
Institut für Geowissenschaften
der Rheinischen Friedrich-Wilhelms-Universität Bonn
by
Jens Steffen Hammes
Supervisors: Prof. Dr. Barbara Reichert Prof. Dr. Gesine Mollenhauer
Bonn, [09/2019]
Hiermit erkläre ich, dass ich die vorliegende Arbeit selbstständig verfasst und keine anderen als die angegebenen Quellen und Hilfsmittel verwendet habe.
Bonn, den 26.9.2019 ______________________
Jens Steffen Hammes
Abstract
The term “Permafrost” describes soil or rock, whose temperature stays at or underneath 0 for at least two years. 50% of the globally estimated, soil-stored organic carbon is to be found in permafrost of the northern hemisphere
Due to global warming more and more of this permanently frozen soil thaws. This leads to thermokarst processes, which create lakes and small ponds. Those lakes and ponds lead to more thawing of the soil around them. The long stored old organic material can be leached out by this thawing processes and either dissolve or float as particles in the water column.
Carbon, which is released in big arctic rivers, has been analyzed. Often, the particulate organic carbon (POC) carried by rivers is older than the dissolved organic Carbon (DOC). The radiogenic carbon signa- ture of DOC shows a very young signature. Due to mineralization and metabolism by microorganisms large amount of DOC leave the flows as CO2 and CH4.
Concentrations of DOC in artic lakes have been analyzed while the origin of this DOC was completely unclear. Also, DOC from ponds has not been analyzed concerning their radiogenic carbon signature yet.
This bachelor thesis focuses on this gap of research and will attempt to answer the following questions:
Do relations between the sizes of water bodies, the concentrations and radiogenic signature of DOC exist? What happens with dissolved and particulate carbon in lakes and ponds? Why carbon in artic riv- ers is so young?
The samples for this thesis were taken during field expeditions in August 2016 and July 2017. These ex- peditions took place in the central part of the Delta Lena. Samples were taken on the geological first terrace unit and on the third terrace unit. To cover the first terrace unit, lakes and ponds on Samoylov were sampled. To cover the third terrace unit, lakes and outflows on Kurungnakh were sampled.
To extract DOC the water samples were evaporated using a Rotary-Evaporator and afterwards analyzed in an AMS called MICADAS.
The resulting concentrations and radiogenic carbon signatures lead to the perception, that bigger lakes have a lower concentration of DOC with more enriched amounts of 14C while smaller ponds have a high- er concentration with a more depleted ratio.
DOC, which was leached into the waterbodies either gassed out due to mineralization or metabolisms by microorganisms. Bigger amounts of POC are especially leached into waterbodies due to heavy rain events, the thawing process in early summer and floods.
The enriched ∆14C-signature of the Lena can be explained with the release of larger amounts of carbon with enriched ∆14C-values from the first terrace. Additionally, older organic Carbon is instable and de- grades fast.
Zusammenfassung
50% des geschätzten global im Boden gespeicherten organischen Kohlenstoffs befindet sich in Perma- frostböden der nördlichen Hemisphäre. Böden die für mindestens zwei Jahre eine Temperatur um 0°C oder weniger aufweisen, werden Permafrostböden genannt. Diese Definition trifft auf 20 % der globalen Landmassen zu. Durch die globale Erwärmung beginnen mehr und mehr Permafrostgebiete zu tauen.
Dies führt zu Thermokarstprozessen, durch welche Seen und Teiche entstehen. Durch die Bildung von Seen und kleineren Wasserkörpern taut umliegender Boden schneller auf.
Organisches Material, das in diesem Boden gespeichert ist, kann durch Tauprozesse gelöst oder auch partikulär in die Wassersäule der Seen und Flüsse gelangen. Über gelösten und partikulären Kohlenstoff in den größeren arktischen Flüssen ist bereits schon einiges bekannt. Zusätzlich wurde durch einige wis- senschaftliche Veröffentlichungen eine moderne Signatur des, in den Flüssen gelösten, organischen Kohlenstoffs gefunden. Durch die Umsetzung dieses gelösten, organischen Kohlenstoffs können große Mengen an Kohlenstoffdioxid und Methan an die Atmosphäre abgegeben werden.
Konzentrationen von DOC in arktischen Seen wurde bereits analysiert, jedoch ist deren Ursprung noch relativ unklar. Ebenso ist die radiogene Kohlenstoff-Signatur von DOC in Teichen und Tümpeln unbe- kannt.
Diese Bachelorarbeit befasst sich mit dieser Forschungslücke und versucht auf die folgenden Fragen Antworten zu finden:
Bestehen Zusammenhänge zwischen der Größe eines Wasserkörpers, der Konzentration und der radio- genen DOC Signatur? Was passiert mit DOC und POC in Seen und Tümpeln? Und schließlich auch: Wa- rum ist Kohlenstoff in arktischen Flüssen so jung?
Die Proben für diese Arbeit wurden im Zuge von zwei Expeditionen im August 2016 und Juli 2017 im Zentrum des Lena Deltas genommen. Beprobt wurden zwei verschiedene geologische Einheiten. Auf der einen Seite die erste Terrasseneinheit auf Samoylov. Auf der anderen Seite die dritte Terrassen Einheit auf Kurungnakh.
Im Labor wurde DOC aus den entnommenen Wasserproben mit Hilfe eines Rotationsverdampfers extra- hiert und mithilfe eines Beschleuniger-Massenspektrometers bestimmt.
Die resultierenden DOC-Konzentrationen und 14C-Signaturen führen zur Annahme, dass größere Was- serkörper wie Seen eine niedrigere DOC-Konzentration und eine leicht verarmte Menge an 14C enthal- ten, wohingegen kleinere Wasserkörper wie Teiche und Tümpel eine hohe DOC-Konzentration und an- gereicherte Vorkommen an 14C vorweisen.
DOC, das aus den Böden ausgewaschen wurde, gast entweder durch Mineralisierung aus oder wird von Mikroorganismen umgesetzt und als CO2 oder CH4 in die Atmosphäre freigesetzt. Größere Mengen an POC werden vor allem durch starke Regenfälle, durch das im Frühjahr stattfinden Auftauen und den damit verbundenen Überflutungen aus den Böden ausgewaschen und in Wasserkörper, Abflüsse und den Fluss Lena eingetragen.
Die moderne 14C-Signatur der arktischen Flüsse kann durch die anteilig größere Menge von mit dem Radioisotop 14C angereichertem Kohlenstoff von Inseln der ersten Terrasse erklärt werden. Die angerei- cherten Kohlenstoffverbingungen, die durch Abflüssen von Inseln der dritten Terrasse stammen, sind sehr instabil und zerfallen sehr schnell zu CO2 und Methan.
Table of Contents
Abstract ... I Zusammenfassung ... II List of Figures ... VII List of Tables ... IX List of Appendix ... X Index of shortcuts ... XI Index for shortcuts, units and symbols ... XII Verzeichnis der verwendeten Programme ... XIII Acknowledgments ... XIV
1 Introduction ... 1
2 Study Area... 2
2.6.1 Samoylov ... 6
2.6.2 Kurungnakh ... 7
3 Scientific background ... 8
4 Methods... 9
4.2.1 Radiocarbon analysis ... 14
5 Results ... 16
6 Discussion ... 21
2.1 Geographic Overview ... 2
2.2 Climate ... 3
2.3 Vegetation ... 3
2.4 Geology ... 4
2.5 Hydrogeography ... 6
2.6 Study sites/study area ... 6
4.1 Sampling ... 9
4.2 Sample Preparation ... 12
5.1 Samoylov ... 17
5.2 Kurungnakh ... 19
7 Conclusiones ... 35 8 Outlook ... 37 9 References ... 38 Appendix ... I 6.1 Does a relationship exist between the size of a water body, the DOC concentration and the
∆14C signature on Samoylov? ... 21 6.2 Calculation for the ratio of old Carbon ... 24 6.3 What happens to dissolved organic carbon in polygons and on the way to Lena River on Samoylov? ... 26 6.4 What happens to particulate organic carbon on the way to Lena River on Samoylov? ... 27 6.5 What happens to dissolved organic carbon on the way to the Lena River on Kurungnakh? 28 6.6 What happens to particulate organic carbon on the way to river Lena on Kurungnakh? .... 32 6.7 Why is DOC in Arctic rivers so young if the rivers are flowing through soils, which store old carbon from thousands of years? ... 33 6.8 Which differences can be recognized between the different years of sampling? ... 34
List of Figures
Figure 1: Map of Siberia changed after Schneider et al. (2009) ... 2
Figure 2: Overview of study sites and sampling locations for this study. The island Samoylov is located in the upper right corner of this satellite picture and consists of Holocene first terrace deposits. The island Kurungnakh consisting mainly of third terrace units can be seen in the lower left. The yellow line broadly marks the border between the small first terrace southwestern part and third terrace (rest of the island) sediments of Kurungnakh (Changed after Sentinel-2 Picture from 06.08.2018) ... 3
Figure 3: A picture that shows the typical vegetation of the tundra on Samoylov (picture taken by Anne Morgenstern) ... 4
Figure 4 shows the different development stages of a thermokarst lake in the Yedoma landscape. 1: shows the polygonal tundra. 2: melting leads to a development with lateral and vertical expansion and sedimentation. The talik starts to develop. 3: The mature stage of a thermokarst lake with only lateral expansion and lacustrine sedimentation. The talik is completely developed. 4: The lake starts to drain until a smaller lake remains or a new generation develops in the basin. 5: The thermokarst lake is drained and only some relict lakes and a pingo remain. (Morgenstern et al. 2011) ... 5
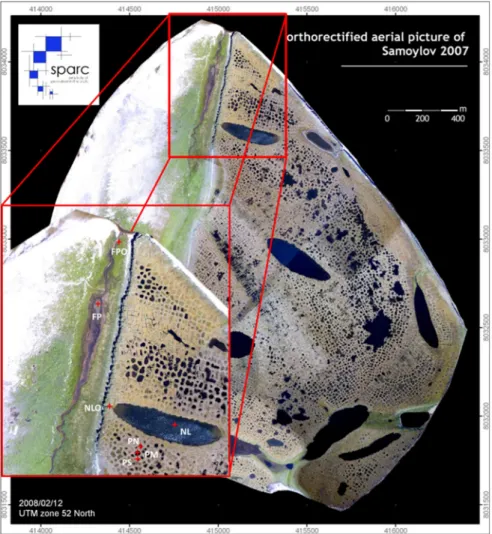
Figure 5: Orthomosaic picture of Samoylov (modified after Boike 2012). The enhanced cutaway shows a precise overview of the sampled locations ... 6
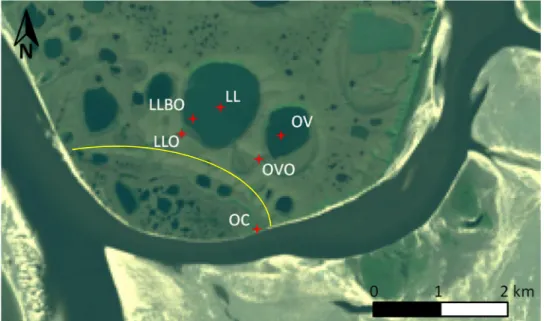
Figure 6: Satellite picture of Kurungnakh with locations of sampling. The yellow line broadly marks the border between the first terrace (small southwestern part) and third terrace (rest of the is land) sediments of Kurungnakh (Changed after Sentinel-2 Picture from 06.08.2018) ... 8
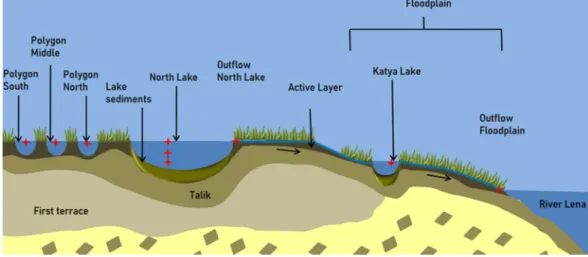
Figure 7: Conceptual model of Samoylov. Polygons sampled for this study are displayed from south to north. Lakes, outflows and streams are portrayed in the order of the flow di- rection to Lena River ... 10
Figure 8: Conceptual Model of Kurungnakh. Lakes, Outflows and streams are shown in in the or- der that arises out of the flow direction to Lena River ... 10
Figure 9: Rotary-Evaporator in Action ... 14
Figure 10: Pressing device for packed filters ... 16
Figure 11: Picture of the Elementar Analyzer (EA) ... 16
Figure 12: CRD sketch of MICADAS (awi.de) ... 17
Figure 13: A diagram showing the concentration and signature of ∆ 14C of DOC and POC from Samoylov ... 21
Figure 14: A diagram showing the concentration and signature of ∆ 14C of DOC and POC from Kurungnakh ... 23
Figure 15: Satellite picture of the three sampled Polygons of Samoylov (changed after Boike 2014). The red Arrow marks a crescent-shaped waterbody, which may have an influ- ence on Polygon North ... 26 Figure 16: Conceptual model to show the impact of Shallow flows through active Layers on ponds
and deeper flows through Taliks in lakes (compare with Barnes et al. 2018) ... 29 Figure 17: Percentage of old organic DOC on Samoylov ... 30 Figure 18: Percentage of old Carbon on Samoylov ... 31 Figure 19: DOC concentrations from 2013 (turquoise) and 2014 (red) on Kurungnakh from Oval
Lake to the outflow at the coast (Data from Lydia Polakowski (DOC samples were taken with 0.75 µm Filters)) ... 33 Figure 20: Sampling locations of Lydia Polakowskies Master thesis (changed after Lydia
Polakowski) ... 33
List of Tables
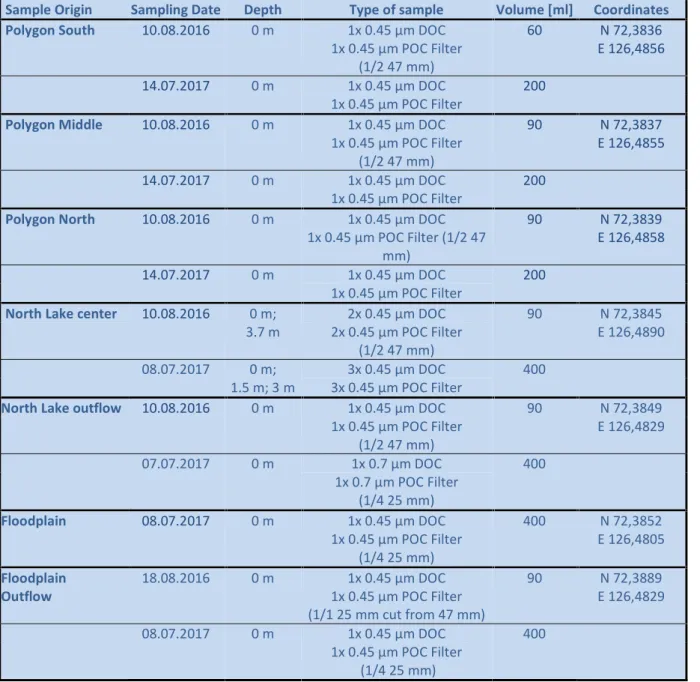
Table 1: List of samples from Samoylov analyzed in this study ... 10
Table 2: List of samples from Kurungnakh analyzed in this study ... 11
Table 3: Number of acid drops added to the filter samples ... 12
Table 4: DOC concentrations of Abnizova (2012) ……….26
Table 5: Delta 14C values of the atmosphere of the northern Hemisphere ..……….…………27
Table 6: Calculation of the origin of modern carbon ... 27
Table 7: DOC measurements on Kurungnakh from 2013 (Lydia Polakowski 2015) ... 34
Table 8: Flow rates and estimated discharge values after the consideration of equal strong inflows (measurements after Lydia Polakowski (2015)) ... 34
Table 9: Mass of outgassed carbon for the minima and maxima discharge measurement ... 35
Table 10: Calculated discharge of the maximum and minimum amount of transported DOC ... 36
Table 11: Calculated discharge of the maximum and minimum amount of transported POC. 1/4 and 1/8 represents the cut size of the filters ... 36
List of Appendix
Appendix 1: Table of used and measured samples; F14C (measured values); F14C cor (Blank corrected values); ∆14C (Blank corrected).
Appendix 2: Satellite image of Abnizovas sampling locations (Abnizova et al. 2012)
Appendix 3: Limnological and Chemical Characteristics from Abnizova et al. 2012 (Abnizova et al. 2012) Appendix 4: Table of the DOC concentration and ∆14C values from the Lena (personal communication
Olga Ogneva, Alfred-Wegener Institute, Bremerhaven 2019)
Appendix 5: Sample locations of this thesis and Olga Ognevas Lena sample (red arrow)
Index of shortcuts
Shortcuts
AMS Accelerator Mass Spectrometry BP Years Before Present (before 1950) DOC Dissolved organic Carbon
EA Elemental Analyzer GIS Gas Interface System MICADAS Mini Carbon Dating System POC Particulate organic carbon
Index for shortcuts, units and symbols
Units
mbar millibar
ml milliliters
µl microliter
m meter
mm millimeter
µm micrometer
km kilometer
km2 square kilometer
kg kilogram
g gram
µg microgram
Pg petagram
Gt gigaton
u atomic weight
°C Celsius
Symbols
‰ per mil
% per centage
λ14C Half-life of Carbon isotope 14
Verzeichnis der verwendeten Programme
Grapher 10Microsoft Excel Microsoft PowerPoint Microsoft Word
Quantum GIS Madeira 3.4
Acknowledgments
I would like to thank all who supported me during my work on this bachelor thesis.
To start off, I would like to thank Prof. Dr. Barbara Reichert for giving me the opportunity to write an external bachelor thesis as well as for her advices and help during this thesis. Furthermore, I would like to thank Prof. Dr. Gesine Mollenhauer and Dr. Torben Gentz for giving me the opportunity to write this thesis in their working group with such an interesting topic. I am truly grateful for all the time, effort and support that I was blessed with during the ten weeks in Bremerhaven and the time afterwards.
Additionally, I am grateful for the support and the nice time I was able to enjoy with Hendrik Grotheer, Elizabeth Bonk, Jens Hefter, Olga Ogneva, Bingbing Wei, Manuel Ruben and Malte Höhn during my work at the AWI.
Furthermore, I want to thank PD Dr. Julia Boike and Dr. Anne Morgenstern for the introduction in the Lena Delta and its unique landscape.
Also, I want to thank Claudia Burau for analyzing the concentration of my DOC samples and Olga Ogneva and Lydia Polakowski for providing their data.
For reading and giving me further advices I want to thank Prof. Dr. Gesine Mollenhauer , Elizabeth Bonk, Lara Christin Hammes and Prof. Dr. Barbara Reichert.
My special and biggest thanks go to my parents Claudia Volk-Hammes and Stephan Hammes, who sup- ported me my whole life to make me who I am today. In addition to that I want to thank my sister Lara, my old and new friends and Luise Schenk-Schlautmann for sharing nice times beside work.
Last but not least I want to dedicate this thesis to my grandfather Jürgen Volk, who supported me earn- ing my first experiences in Geology during an internship in Mainz in 2012. Thank you for doing this trip with me that not only set the starting point of my academic career but also helped me to get engaged with a subject that I would like to keep learning about for the rest of my life.
1 Introduction
Ground (soil or rock) whose temperature stays at or below 0 °C for at least two years can be considered as permafrost (Harris 1988). This definition applies to 20 % of the world's landmasses (French 2007). The estimated amount of organic carbon deposited in northern permafrost is 1700 Pg, which equals 50 % of the estimated global organic carbon being stored in the ground (Tarnocai et al. 2009). Around 400 Gt of this organic carbon is stored solely in the Yedoma Ice Complex (Tarnocai et al. 2009). The greatest rates of warming and thawing have been detected in the coldest permafrost sites (e.g. Romanovsky et al.
2010). In the period from 1901 to 2010 the surface air temperature of the northern Hemisphere in- creased by 1.12 °C (Jones et al. 2012). Climate warming is a serious problem in most northern high- latitude permafrost regions (ACIA 2004). Due to degradation and melting of permafrost, a destabiliza- tion of ground and the local infrastructure arises. The coastal and lacustrine ridges erode and the stored carbon is released into water bodies in arctic areas. The input of organic carbon in to lakes ushers in a mineralization and emission of 30-80 % of the total organic carbon as CO2 and Methane (Algesten et al.
2003; Frey 2005).
The ice-rich permafrost deposits are becoming increasingly vulnerable to degradation in a warming cli- mate (Morgenstern 2013; Straus 2017). This degradation has existed for a few decades (Romanowsky 2010). Due to degradation and melting, the Polar Regions become wetter and the surface area of lakes and ponds increases (compare with Pokrovsky et al. 2011). Those waterbodies process large amounts of carbon from terrestrial sources, which results in emissions of CO2 caused by a supersaturation of carbon and mycobacterial metabolism (McCallister 2012). Furthermore, this input also leads to an increase of carbon transport to rivers and the ocean (Spitzy and Leenheer 1991). Due to these events the northern permafrost regions might change from a carbon sink to a carbon source (Schuur et al. 2008). If old or- ganic carbon, which has been stored for hundreds to thousands of years, is released, it could have a massive positive feedback on the global climate (Schuur et al. 2013; Vonk et al. 2013; Mann et al. 2015).
Most studies performed to thoroughly understand the release of carbon focused on large scale lakes (Duchemin et al. 1999; Jonsson et al. 2003; Åberg et al. 2004; McGuire et al. 2009). Only a few look at smaller lakes and ponds, which have also a big influence on the global carbon cycle (Boike et al. 2008;
Abnizova et al. 2012). Most global atmospheric models do not include small ponds, because ponds are often too small for satellite measurements to detect (Abnizova et al. 2012). Additionally, it is still un- known if the dissolved organic carbon (DOC) in waterbodies like lakes and ponds is modern or from an ancient source.
Therefore, knowledge of the age and the exact origin of DOC is an important issue for understanding the permafrost degradation.
This study will focus on the age of DOC of lakes and polygons from the Lena Delta by answering the fol- lowing questions:
Does a relationship exist between the size of a waterbody, the concentration of old organic carbon and the ∆ 14C-signature?
What happens to old organic carbon which is leached from frozen soils?
Does old organic carbon reach the Lena River?
Is the old organic carbon re-mineralized before it reaches the Lena River?
Why is DOC in arctic rivers so young if the rivers are flowing through soils, which store thousand year old carbon?
2 Study Area
2.1 Geographic Overview
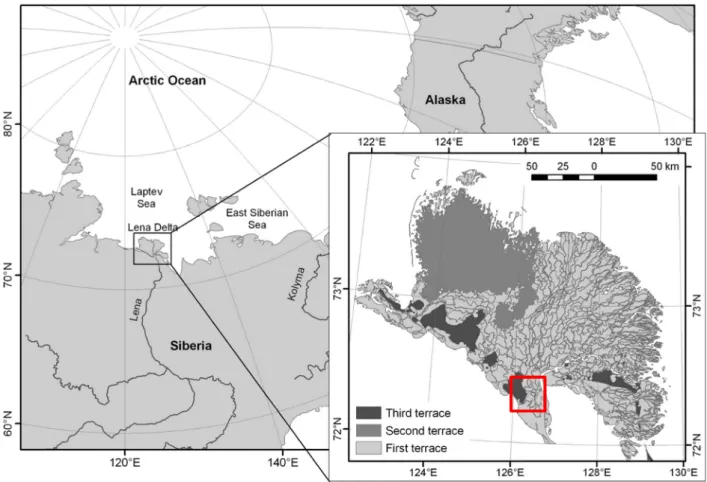
The study area is located in northeast Siberia (Figure 1). The Lena Delta is the largest delta in the Arctic, with a size of 32,000 km2 (Are and Reimnitz 2000). The river itself is the second largest river in the Arctic, with a length of 4,400 km (Holmes et al. 2011; Frey and McClelland 2009). The delta is underlain by and belongs to the continuous permafrost zone, with a thickness between 400-600 m (Romanovskii and Hubberten 2001). The average annual temperature of this permafrost is about -10 °C at a depth of 10 m.
Observations of deeper permafrost show that the mean temperature increased by 0.3 to 1.3 °C from 2006 to 2011 (Boike et al. 2013, 2015).
Figure 1: Map of Siberia changed after Schneider et al. (2009)
The samples investigated in this study were taken from the islands of Samoylov and Kurungnakh, which are located in the southern central part of the delta. Samoylov is part of to the first terrace (Figure 2 upper right) and Kurungnakh consists mainly of deposits from the third terrace (Figure 2 lower left).
Only a small part in the southwest of the island was deposited during the Holocene and therefore be- longs to the first terrace.
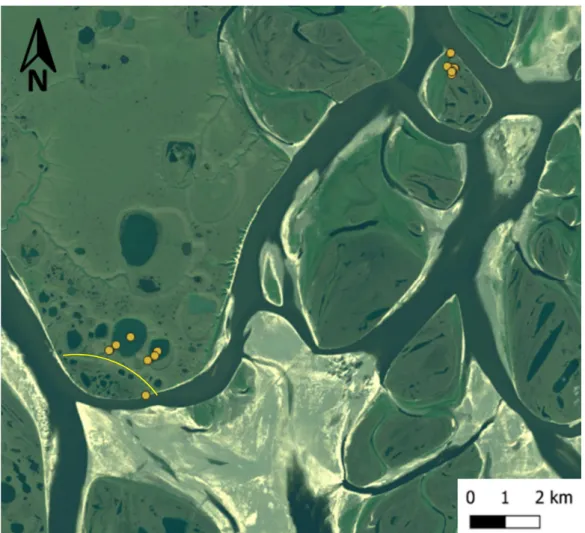
Figure 2: Overview of the study sites and sampling locations. The island Samoylov is located in the upper right corner of this satellite picture and consists of Holocene first terrace deposits. The island Kurungnakh consisting mainly of third terrace units can be seen in the lower left. The yellow line broadly marks the border between the small first terrace southwestern part and third terrace (rest of the island) sed- iments of Kurungnakh (Changed after Sentinel-2 Picture from 06.08.2018)
2.2 Climate
The climate of this region is classified as continental and Arctic since long winters (mean temperature in February 2011: -33.1 °C) alternate with short summers (mean temperature in July 2011: 10.1 °C) (Boike et al. 2013). The annual mean average temperature, measured at Samoylov Island, in the time period from 1998 to 2011 was -12.5 °C (Boike et al. 2013). The biggest temperature range was measured in the period of 2002 to 2011 with a low of -50 °C and a high of 20 °C (Langer 2013). The total amount of pre- cipitation ranges from 72 mm per year measured in 1999 to 208 mm in 2003 (Boike et al. 2008). 45 % of this rain falls during the summertime (Wille et al. 2008).
2.3 Vegetation
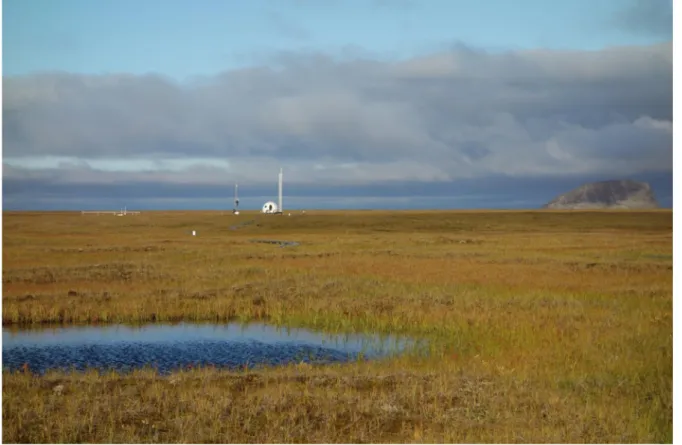
The Lena Delta is in the tundra. The tundra is a transitional biome between the Taiga in lower Latitudes and the Arctic zone in higher Latitudes towards to the pole. Low temperatures and short growing sea- sons during unfrozen periods from June or July to September make it nearly impossible for trees and other bigger plants to grow (Harris et al. 1988). In these high Latitudes the vegetation (Figure 3) is lim- ited to Lichens, Shrubs, Mosses, Grass, Rushes and Sedges (Elmendorf et al. 2012).
Figure 3: A picture that shows the typical vegetation of the tundra on Samoylov (picture taken by Anne Mor- genstern).
2.4 Geology
The geology of the delta can be sub-classified into three different terraces (Schwamborn et al. 2002), each of which is portrayed by a different shade of grey in Figure 1. While the black color marks the third terrace, dark grey represents the locations of the second terrace and light grey those of the first terrace.
The first terrace (1 to 12 m above the sea level) ranges over the main river and builds the eastern parts of the delta. It consists of fluvial sediments from mid-Holocene up to modern sedimentation and over- lays a slide of debris. Its shape is characterized by ice-wedge polygonal tundra, active flood plains and thermokarst lakes (Fiedler et al. 2004; Schwamborn et al. 2002). Both ice-wedge polygonal tundra and thermokarst lakes are special structures, which occur in this area due to certain processes. The Ice- wedge polygonal tundra results from detritus transport and alluvial runoff from mountain valleys, valley slopes and cryoplanation terraces on hills (Schirrmeister et al. 2011). A mixture of fine-grained detritus, snow and plants is transported by meltwater and forms, after freeze and thaw cylces, an organic rich ice-complex (Schirrmeister et al. 2011). The cycles of thawing and freezing cause more transport by slope wash, solifluction and permafrost creeps. Alluvial and fluvial transport delivers increasing amounts of fine grain sediments and plant detritus (Schirrmeister et al. 2011). This leads to different ice deposits and the development of polygonal ice-wedges (Schirrmeister et al. 2011).
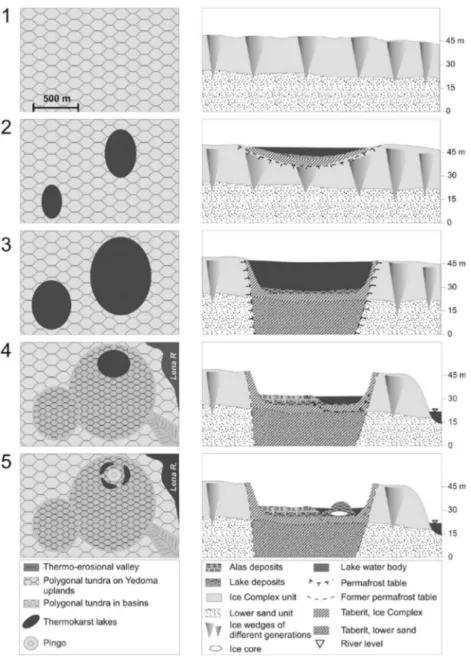
Thermokarst is defined as the process of thawing ground ice or ice-rich ground. Lakes and basins result out of this process and form a characteristic landscape (van Everdingen 2005). The soil collapses due to this thawing and leads to subsidence in the ground’s surface. Water, which results from this thawing and meteoric rainfall, is collected in those basins and leads to more thawing. With more water the basin becomes a lake or pond. The soil as part of the ice complex underneath the new developed waterbodies with a few meter depth starts to thaw and builds up a so-called talik with a several tens of meters depth (West and Plug 2008) (Figure 4).
The second terrace consists of Late Pleistocene fluvial sediments and covers the northwestern part of the delta (Figure 1) at a height of 20-30 meters above sea level. The third and oldest terrace (30-55 me- ters above the sea level) is exposed in the south-southwestern part of the delta (Figure 1). This terrace is built by erosional remnants of an accumulation plain from the Middle to Late Pleistocene.
The third terrace on Kurungnakh can be divided into different units. The oldest includes fluvial sand, which was deposited in the early Weichselian (100.000 -50.000 BP). The next unit appears above as the Yedoma ice complex. It was formed during the middle and late Weichselian (44.500-17.000 BP) and con- sists of frozen peaty silt layers with large peat lenses. The youngest unit derives from the Holocene and consists of silty-sandy peat and deposits of thermokarst (Wetterich 2008).
Figure 4: Different development stages of a thermokarst lake in the Yedoma landscape (Morgenstern et al.
2011): 1: polygonal tundra. 2: melting leads to a development with lateral and vertical expansion and sedimentation. The talik starts to develop. 3: The mature stage of a thermokarst lake with only lateral expansion and lacustrine sedimentation. The talik is completely developed. 4: The lake starts to drain until a smaller lake remains or a new generation develops in the basin. 5: The thermokarst lake is drained and only some relict lakes and a pingo remain.
2.5 Hydrogeography
The lakes formed by thermokarst in the Lena Delta are usually not deeper than 5 m (Boike et al. 2015).
The diameter size of those lakes ranges from a few 100 meters to several kilometers (Grosse et al.
2013). Polygons are more dominant on islands of the first terrace then on islands of the third (Dr. Anne Morgenstern, Alfred Wegener Institute, pers. Comm. 2019). The ponds I focused on are not connected by surface channels. However, the lakes on Samoylov and on Kurungnakh are connected to each other and lead to an outflow at the coastline to the Lena River.
2.6 Study sites/study area 2.6.1 Samoylov
Samoylov belongs to the first terrace and can be divided in two different parts (Figure 5). The western greenish part of the island is the floodplain. This part is dominated by flood events which mainly occur during the thawing period at the beginning of summer but also due to heavy rain events, which only can happen in summertime (Wille et al. 2008). The eastern part belongs to older first terrace sediments and is embossed by the polygonal tundra landscape with thermokarst lakes and ponds.
Figure 5: Orthomosaic picture of Samoylov from 2007 (modified after Boike 2012). The enhanced cutaway shows a precise overview of the sampled locations (“PS” Polygon South; “PM” Polygone Middle; “PN”
Polygone North; “NL” North Lake; “NLO” North Lake Outflow; “FP” Floodplain; “FPO” Floodplain Out- flow)
Polygon south, in the following shortened to “PS”, Polygon Middle shortened to “PM” and Polygon North shortened to PN (Figure 5) represent typical ponds of the polygonal tundra in the southern part of
the zoomed in portion of the figure. The diameter accounts only a few meters. A bigger thermokarst lake on Samoylov is called North Lake and is abbreviated as “NL”. Its outflow, shortened to “NLO”, is a good example for the connection between the eastern higher plain and the western floodplain. As the water crosses the floodplain, it passes through a small lake called Katya Lake. After crossing the flood- plain, waters flow into the Lena River branch near Samoylov at the outflow which is referred to as “FPO”
(floodplain outflow).
2.6.2 Kurungnakh
Figure 6 depicts the southern part of Kurungnakh. The two larger lakes denoted in figure 6 are thermo- karstlakes. The first lake in flow direction is called Oval Lake (surface area: 450,134.6 m2 (Polakowski 2015)), shortened in figure 6 to “OV”. This lake is partly drained (like in Figure 4 stage 4 shown) and its outflow is an inflow to the bigger lake to the west called Lucky Lake (LL) (surface area: 1,228,688.9 m2 (Polakowski 2015)). The soil around the Lucky Lake degrades and erodes, introducing third terrace sedi- ments into the lake. Two further inflows to the Lucky Lake can be seen to the northeast. From Lucky Lake the water flows down on the first terrace (border to the first terrace: yellow mark in figure 6). This stream has inflows from the third and fist terrace. Two smaller lakes on the first terrace are also con- nected to the down flowing stream. Shortly before the stream reaches the outlet at the south coast of Kurungnakh, another lake from the third terrace adds water to the stream.
Figure 6: Satellite picture of Kurungnakh with locations of sampling. The yellow line broadly marks the border between the first terrace (small southwestern part) and third terrace (rest of the island) sediments of Kurungnakh (Changed after Sentinel-2 Picture from 06.08.2018)
3 Scientific background
Studies about the arctic regions and the permafrost in norther hemisphere are getting more and more important. One of the first expeditions of German scientists in cooperation with scientists from Russia to Sibiria took place in 1993. Since this first expedition more and more researcher teams explored dif- ferent aspects of this region. Since at least the global warming became more and more significant, re- searchers started to focus more on studies of the Siberian permafrost. The extreme amounts of stored carbon in the soils and ice of the permafrost region gave scientists the question what would happen if those thaw. What could happen and how will it change the region and the rest of the world.
The geology and the way the Lena Delta and the local Ice Complexes formed were studied by Schwarm- born (2002), Schirrmeister (2011a; 2011b) and others. Mentioning Ice Complexes and the Lena Delta a few more specific informations about the hydrogeology, the polygonal tundra and thermokarst lakes were published by Julia Boike (2012; 2013; 2015; 2019) and Anne Morgenstern(2011; 2013).
Based on a 36-year observation period Kirpton et al. (2011) demonstrated that the total lake areas in West-Siberia increased and that the land became wetter. The wetter the area becomes, the more the surface area of lakes and ponds increases (Pokrovsky et al. 2011). The more the surface area of lakes and ponds increases the more carbon can be mobilized and emitted. Even if they are not connected by surface outlets, they release carbon. The amount of carbon leaving the system by outgassing of water- bodies is higher than the amount which could leave it through lateral run offs (Abnizova et al. 2012).
In Studies which focus on the utilization of leached out carbon, arctic rivers are compared to conduits which bring carbon to the coastal areas and artic oceans (Mann et al. 2015). This ancient carbon (>20,000 B.P.) is rapidly utilized by microbes (Spencer et al. 2015). Spencer et al (2015) showed that 50
% of the ancient carbon was utilized within 7 days with a decay rate of 0.12 to 0.19 % per day in arctic rivers. Other studies, such as Åberg et al. (2004) or McGuire et al. (2009) focus also mainly on arctic riv- ers or bigger lakes. Research on terrestrial smaller waterbodies with an increasing appearance is not equally covered. Especially the age of carbon, which is released and dissolved in waterbodies with a small surface area, is not investigated.
First DOC concentrations were measured and sampled by Polakowski (2015) on Kurungnakh.
4 Methods 4.1 Sampling
The samples for my project were taken during the 2016 Lena expedition, by Thorsten Riedel and Vera Meyer (Riedel 2016) and during the 2017 Lena expedition by Maria Winterfeld and Hendrik Grotheer (Winterfeld et al. 2017). The expedition in 2016 started on 1st of August and ended on 31st of August.
The 2017 expedition started on the 2nd of July and ended on the 31st of July. The teams collected various sample types. Samples were taken from the Lena River, on Samoylov from North Lake and some nearby polygons, and on Kurungnakh of Oval Lake, Lucky Lake and inlets and outflows of these Waterbodies (Figures 7 and 8). Samples of various depths were taken in the lakes and the Lena River.
Figure 7: Conceptual model of Samoylov. Polygons sampled for this study are displayed from south to north.
Lakes, outflows and streams are portrayed in the order of the flow direction to Lena River.
Figure 8: Conceptual Model of Kurungnakh. Lakes, Outflows and streams are shown in in the order that arises out of the flow direction to Lena River.
A standard Niskin water sampler (General Oceanics model 1010) with 5-liter capacity was used for sam- pling. The close mechanism of the sampler was triggered by a 400 g drop messenger. The sampler was weighted down by a 15 kg iron weight and lowered with a 30 m long rope. To avoid the mixing of strati- fied waterbodies the engine of the boat was switched off during sampling and the extraction of water started first at the surface and then to consecutively deeper positions. The collected water was trans-
ported in 10 to 20 l jerrycans in 2016 and in 15 to 20 l plastic canisters in 2017. These vessels were cleaned by rinsing with tap water in the lab and water at the sampling locations, respectively.
Several kinds of filters were used. Some samples were filtered through a 0.7 µm glass fiber filter (GFF) and others through a 0.45 µm GFF. Those filters had been combusted before the trip at 450 °C for 4.5 hours. The filters with 0.7 µm pore size have only been analyzed for one location, because no other fil- ters exist for this site. 0.45 µm filters of 2 different diameters were used in the field. The smaller filter has a diameter of 25mm. The larger filter with a pore size of 0.45 µm has a diameter of 47mm. The 47 mm diameter filters were used on a filter apparatus designed for 25 mm filters after the larger filter apparatus accidentally broke. Tables 1 and 2 provide an overview of samples taken.
Before the filtration in the field laboratory started, the rack and flask were rinsed with 30 ml of MilliQ water. For each sample, 3 times 60 ml was filtered through 47 mm and 25 mm filters in 2016. In 2017, for some samples 400 ml was filtered and for others 200 ml. The filtrated water samples were frozen after filling them into HDPE bottles. Further information about the expeditions can be found in the ex- pedition reports by Riedel (2016) and Winterfeld et al. (2017).
Table 1: List of samples from Samoylov analyzed in this study
Sample Origin Sampling Date Depth Type of sample Volume [ml] Coordinates
Polygon South 10.08.2016 0 m 1x 0.45 µm DOC 60 N 72,3836
E 126,4856
1x 0.45 µm POC Filter
(1/2 47 mm)
14.07.2017 0 m 1x 0.45 µm DOC 200
1x 0.45 µm POC Filter
Polygon Middle 10.08.2016 0 m 1x 0.45 µm DOC 90 N 72,3837
E 126,4855
1x 0.45 µm POC Filter
(1/2 47 mm)
14.07.2017 0 m 1x 0.45 µm DOC 200
1x 0.45 µm POC Filter
Polygon North 10.08.2016 0 m 1x 0.45 µm DOC 90 N 72,3839
E 126,4858
1x 0.45 µm POC Filter (1/2 47
mm)
14.07.2017 0 m 1x 0.45 µm DOC 200
1x 0.45 µm POC Filter North Lake center 10.08.2016 0 m;
3.7 m 2x 0.45 µm DOC 90 N 72,3845
E 126,4890
2x 0.45 µm POC Filter
(1/2 47 mm)
08.07.2017 0 m;
1.5 m; 3 m
3x 0.45 µm DOC 400
3x 0.45 µm POC Filter
North Lake outflow 10.08.2016 0 m 1x 0.45 µm DOC 90 N 72,3849 E 126,4829
1x 0.45 µm POC Filter
(1/2 47 mm)
07.07.2017 0 m 1x 0.7 µm DOC 400
1x 0.7 µm POC Filter (1/4 25 mm)
Floodplain 08.07.2017 0 m 1x 0.45 µm DOC
1x 0.45 µm POC Filter (1/4 25 mm)
400 N 72,3852 E 126,4805 Floodplain
Outflow 18.08.2016 0 m 1x 0.45 µm DOC
1x 0.45 µm POC Filter (1/1 25 mm cut from 47 mm)
90 N 72,3889 E 126,4829
08.07.2017 0 m 1x 0.45 µm DOC 400
1x 0.45 µm POC Filter (1/4 25 mm)
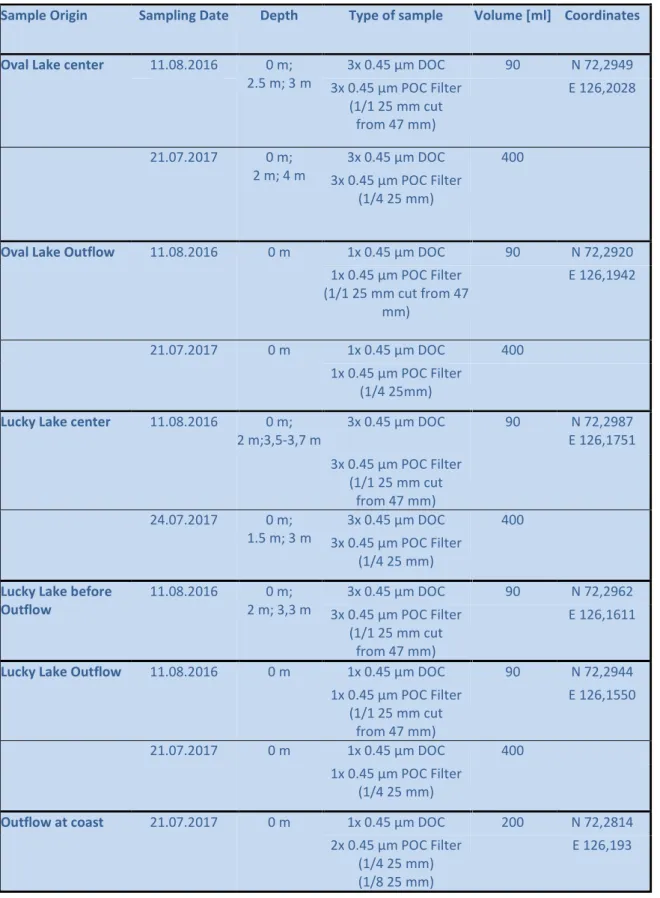
Table 2: List of samples from Kurungnakh analyzed in this study
Sample Origin Sampling Date Depth Type of sample Volume [ml] Coordinates
Oval Lake center 11.08.2016 0 m;
2.5 m; 3 m 3x 0.45 µm DOC 90 N 72,2949 3x 0.45 µm POC Filter
(1/1 25 mm cut from 47 mm)
E 126,2028
21.07.2017 0 m;
2 m; 4 m
3x 0.45 µm DOC 400 3x 0.45 µm POC Filter
(1/4 25 mm)
Oval Lake Outflow 11.08.2016 0 m 1x 0.45 µm DOC 90 N 72,2920 1x 0.45 µm POC Filter
(1/1 25 mm cut from 47 mm)
E 126,1942
21.07.2017 0 m 1x 0.45 µm DOC 400
1x 0.45 µm POC Filter (1/4 25mm) Lucky Lake center 11.08.2016 0 m;
2 m;3,5-3,7 m
3x 0.45 µm DOC 90 N 72,2987 E 126,1751 3x 0.45 µm POC Filter
(1/1 25 mm cut from 47 mm) 24.07.2017 0 m;
1.5 m; 3 m
3x 0.45 µm DOC 400 3x 0.45 µm POC Filter
(1/4 25 mm) Lucky Lake before
Outflow 11.08.2016 0 m;
2 m; 3,3 m 3x 0.45 µm DOC 90 N 72,2962 3x 0.45 µm POC Filter
(1/1 25 mm cut from 47 mm)
E 126,1611
Lucky Lake Outflow 11.08.2016 0 m 1x 0.45 µm DOC 90 N 72,2944 1x 0.45 µm POC Filter
(1/1 25 mm cut from 47 mm)
E 126,1550
21.07.2017 0 m 1x 0.45 µm DOC 400
1x 0.45 µm POC Filter (1/4 25 mm)
Outflow at coast 21.07.2017 0 m 1x 0.45 µm DOC 200 N 72,2814 2x 0.45 µm POC Filter
(1/4 25 mm) (1/8 25 mm)
E 126,193
4.2 Sample Preparation
The dissolved organic carbon concentration was analyzed by Claudia Burau (Section Ecological Chemis- try, Alfred Wegener Institute, Bremerhaven) using a Shimadzu TOC-VCPN analyzer.
For radiocarbon (14C) analyses, DOM needed to be extracted from the samples. This was done by drying the samples using rotary evaporation (Roto-evaporation). The sample volume required for 14C analyses of DOC was calculated based on the concentrations according to formula (1)
(1) 𝑉 = µ
∗ ∗ 1000 (1)
𝑉 Volume needed for extracting 100 µg of carbon in [ml]
𝑐 Concentration of sample in [µM]
𝐴 Atom mass of carbon [12.0107 u]
Roto-evaporation (RV)
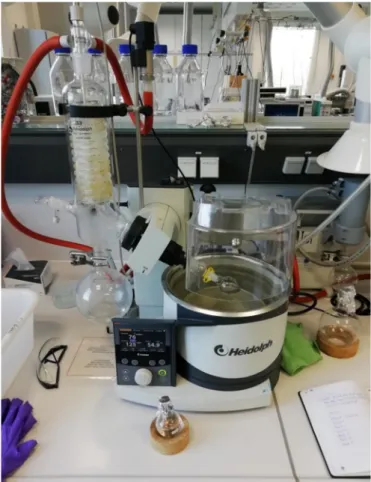
A sample volume corresponding to 100 µg C as DOC was transferred into a 25 mL pear-shaped flak using a glass pipette. For those samples, for which a volume >25 mL was required, a first aliquot of 20 mL was filled into the pear-shaped flask and dried. The remaining sample volume was then added to the dried extract. Samples were dried using a Heidolph LABORATA (roto-evaporation apparatus) (Figure 9). Prior to sample evaporation, the apparatus was cleaned by attaching a round-bottom flask filled with 200 ml of Milli-q water (EMSURE Water for analysis). After the 200 mL had evaporated, the connections and the surfaces, where the flask is attached to the vapor tube were cleaned with Isopropanol.
Figure 9: Rotary-Evaporator in Action
After the cleaning process, the pear-shaped flask was attached to the vapor tube, which was connected to condenser unit. The water bath was set to a temperature of 60 °C. The pressure setting for the vacu- um was 70 mbar with a delta pressure of 20 mbar (compare to Grotheer 2012)). The pear-shaped flask
rotated 120 times per minute. Pear-shaped flasks that were filled with up to 20 ml needed 10 minutes to warm up. In order to slowly increase the temperature to avoid boiling retardation, the flask was low- ered so that it just touched the surface of the warm water bath. After 10 minutes, the flask was lowered inside the water bath with no danger of boiling. The evaporation is finished when only a small amount of water remains in the flask (ca. 1 ml). Then, rotary-evaporation was stopped and the rest of the sample was transferred with Milli-q water from the flask into a 4 ml-vial. The LABORATA ran a cleaning run with 50 ml Milli-q water between each sample. After this washing run, the surfaces of the connecting parts were cleaned again with isopropanol.
The 4 ml-vials were dried on a heating plate underneath a flow of nitrogen until no visible remains of liquid could be observed. After this drying process, the residue was re-dissolved in Milli-q water (50 µl) and transferred into tin capsules. This transfer was repeated three times. The tin capsules were dried in a desiccator for minimum of 3 hours at 60 °C. After the last drying process the tin capsules were folded into cubes for combustion in the EA.
Preparation of glass fiber filters
The filters, which have been used in the field to filter the water sample, can be used to determine the concentration of particulate organic carbon (POC). The filters were cut to the following sizes after thaw- ing and drying in a 40 °C oven for at least 12 hours. All 47 mm filters were cut in half, because that is the maximum size which fits into an 8x8x15 mm tin boat. Those 47 mm filters, which were used on a filtra- tion device designed for 25 mm filters, which were only covered with particles in the center, were punched using a 25 mm circular hole punch. These punches as well as the 25 mm diameter filters were cut in quarters, because of a higher concentration on a smaller filter.
After cutting, the filters were acidified with drops of a one molar hydrochloric acid, with a glass pipet (Table 3). Filter acidification removes possible carbonate particles, which could contaminate the meas- urements of POC.
Number of acid drops added to the filter samples Filter size 1/2 47 mm
0.45 GFF
1/1 25 mm cut from 47 mm
0.45 GFF
1/4 25 mm 0.45 GFF
Outflow Kurung- nakh 1/8 25 mm
0.45 GFF
Outflow Kurung- nakh 1/4 25 mm
0.45 GFF Number of
acid drops 10-11 5-6 3-4 3 7
The acidified filters were dried overnight in a 40 °C oven. The following day they were packed in tin boats and pressed into small disks (Figure 10). Those disks were then combusted and analyzed for or- ganic carbon concentration in the (EA) (Figure 9).
Figure 10: Pressing device for packed filters
4.2.1 Radiocarbon analysis
After packing the samples into tin boats and tin cups, they were loaded into the EAs sampler (Figure 11:
red circle on top of the EA). In the EA samples are combusted under a constant flow of helium at 950°C.
In addition to helium, oxygen is introduced to assure complete combustion to CO2, H2O, N2, Nitrogen oxides (NOx), SO2 and SO3. CO can also result from incomplete combustion. To increase the CO2 yield, the mixture of gases is oxidized by a copper oxide. While silver wool in the combustion tube removes SO2
and SO3, and copper wire pieces reduce the nitrogen oxides to N2 and water (which is then removed in a Sicapent water trap). The resulting gas mixture consists of CO2 and N2. This gas mixture is transmitted to the Gas Interface System (GIS) (Ruff et al. 2010). The GIS allows for the measurement of samples with a small amount of carbon in the Mini Carbon Dating System (MICADAS). The ideal amount of Carbon to for the best measurement is 100µg. The gas mixture is introduced into a gas stream of helium. CO2 is ad- sorbed selectively by a zeolite trap. After it is captured, the trap is heated up to 450°C to release the CO2. This CO2 is fed into the stream of helium with a proportion of 2-5% of CO2 and 95-98% of helium.
The new mixed gas is transferred continuously into the gas ion source of MICADAS (Figure 12: No 1).
The inflowing gas is ionized with positively charged cesium ions. This leads to a stream of negatively charged ions from the sample. This process eliminates the chance of contamination through 14N, be- cause 14N cannot produce anions. The resulting negatively charged carbon ion beam is focused by an array of focusing lenses and streams to the impactor magnet, which bends the beam by 90 degrees. In this bending, the different molecules are separated by mass. The separated negatively charged mole- cules are accelerated to a high positive potential inside the tandem accelerator. After acceleration they pass through the electron stripper, which positively charges the remaining molecules and divides them into fragments and carbon ions. This beam of fragments and carbon ions is subsequently deflected by a second magnet, the high-energy magnet. The deflection of the beam leads to another separation of carbon ions with the masses of 12C, 13C and 14C. The fragments are sorted out before, while the Carbon ions stream to the last part of the AMS. These remaining ions are detected by measuring the 12C and 13C beams amperage using Faraday cups. The amount of 14C cannot be measured with a Faraday cup, be-
cause the amperage of a C is too low for the device. To solve this problem a gas ionization chamber is used to measure the 14C ions. More detailed information can be found inSynal et al. (2007).
Figure 11: Picture of the Elementar Analyzer (EA)
Figure 12: CRD sketch of MICADAS (awi.de)
5 Results
In the following chapter I will present my results separately for each of the two islands. The order of the sampling locations reflects the flow direction through the waterbodies towards the outflow at the coast of the island to the river Lena. On Samoylov the flow begins at the North Lake. In order to mention the data from the ponds as well, which are not connected to other waterbodies, I set them at the beginning in the order they are located on Samoylov from south to north. The different years are illustrated with different colors. Turquoise represents the year 2016 and red the year 2017. The different shapes are meant to emphasize the difference between DOC (rhomb) and POC (square) values. The X-axis of each diagram shows the location of sampling. The Y-axis changes between values for the concentration in mg/L of POC and DOC and signature of ∆ 14C for DOC and POC. The measured results of the MICADAS are listed in the Appendix 1. ∆ 14C values have been calculated with blank corrected F14C (Appendix 1).
5.1 Samoylov
DOC concentrations show a high variation between the samples ranging from 7.63 mg/L (Polygon South) in 2017 to 2.62 mg/L (North Lake 1.5m) in 2017 (Figure 13a). The DOC concentrations from the lake to the river in the year 2016 are slightly higher than those of 2017. The general trend of DOC concentration of Samoylov is higher in Polygons than in North Lake. From North Lake on, the DOC concentration in- creases towards the outflow at the coast.
The variation in the POC-concentration of the different samples is generally not smaller compared to DOC concentration despite one exception (Figure 13b). The exception comes from the Outflow of North Lake, with a POC concentration of 6.93 mg/L POC. The biggest difference between the POC concentra- tions without the sample of Outflow North Lakes is 1.82 mg/L between a sample from Polygon South 2016 (2.2 mg/L) and the Outflow at the Coast in 2017 (0.38 mg/L). The range of the other samples ex- tends from 0.43 mg/L to 2.24 mg/L.
Samples from 2016 are higher in concentration at every location in comparison to those of 2017(Figure 13b). Additionally, the 2016 samples do not show a decrease in the concentration at the North Lake or other locations. The 2017 samples on the other hand show a nearly similar trend to the concentration of DOC samples on Samoylov, i.e., the concentration of the ponds are similar to each other (Polygon North 0.65 mg/L, Polygon Middle 0.62 mg/L and Polygon South 0.54 mg/L) and decrease in the direction of North Lake. Additionally, the concentration increases towards the floodplain (Figure 13b). The floodplain also has a similar concentration to the ponds. What differs from the trend of the DOC concentration is a decrease at the outflow of the floodplain. There the concentration is nearly the same as in North Lake.
The ∆ 14C-signatures range from 60 to -10‰ (Figure 13c). The signatures of samples from 2017 are more depleted then those of samples of 2016. This relation is only opposite at Pound South. The three ponds have more modern signatures in both years than the rest of the sampled locations. The sample taken from Polygon North in 2017 differs from the other polygons, but has a nearly similar signature to the North Lake, the outflow of the lake, the floodplain and the outflow at the coast. Those samples differ from each other in their signature from 10 to -10‰, but less than the difference between them and the polygons with signatures of 46 to 60‰ (Figure 13c).
The ∆14C signatures of POC of the samples from 2016 vary more strongly than those from 2017 (Figure 13 d). The minimum as well as the maximum of the ∆ 14C signatures of POC are from the year 2016. The most depleted signatures of 2016 occur in North Lake and the youngest in its outflow. Compared to the
∆14C-signatures of the atmosphere in 2016 and 2017 and the ∆14C-signature of the oldest measured soil sample (Figure 13c and 13d), the signatures of 2017 range within a narrower range between -34‰ and - 184‰. Notably, the signature of the deepest sample from North Lake has a more enriched ∆14C- signature than the polygons. In contrast to that strong enriched signature the most depleted sample is located at the floodplain as marked in the graph of the DOC 14C signatures.
Delta 14C signature of the oldest soil Delta 14C signature of the atmosphere in 2016 and 2017
PS PM PN NLNL NLO FPO
PS PM PN NLNLNL NLO FP FPO
Location of Sampling
2 4 6 8
DOC (mg/L)
-20 0 20 40 60
Delta 14C DOC
0 0,4 0,8 1,2 1,6 2 2,4
POC (mg/L)
-400 -200 0
Delta 14C POC
6,4 6,8 7,2
-420 -400
(a) (b)
(c) (d)
Figure 6 is a diagram showing the concentration and signa-ture of Delta 14C of DOC and POC from Samoylov.
Figure 13: Concentrations and radio- carbon signature (ex- pressed as ∆14C in ‰) of DOC and POC from Samoylov.
(a) – DOC concentration in mg/L from 2016 and 2017 (b) – POC concentration in mg/L from 2016 and 2017 (c) – ∆14C signature in per mill from 2016 and 2017 of DOC
(d) – ∆14C signature in per mill from 2016 and 2017 of POC
5.2 Kurungnakh
In Figure 14 the concentration and ∆14C signature of DOC and POC from Kurungnakh is shown. The highest DOC concentration on Kurungnakh is 5.04 mg/L (Figure 14a). It was measured in a sample, taken from the center of Lucky Lake at a depth of 3m in 2016. In contrast, the sample with the lowest concen- tration was taken at the outflow to the Lena River in 2017(Figure 14a). Generally, the DOC concentra- tions of the sampling sites over both years are similar, except at Lucky Lake and Lucky Lake Outflow, where larger differences were observed. In 2016 the concentration of DOC in samples from Lucky Lake increased with depth. However in 2017 the samples’ concentrations are nearly the same. The second bigger difference in concentration is at Lucky Lake Outflow. The sample from 2017 has a higher concen- tration than the one collected in 2016. The general trend of both years is the same. At the beginning of the flow on Kurungnakh the concentration is nearly the same in Oval Lake and its outflow. Afterwards the concentration increases in Lucky Lake and fro there decreases along the flow path to the outflow at the coast (Figure 14a).
The two measurements with the highest POC concentrations were taken from one filter in 2017 from the outflow to the Lena, which is covered by a dark organic rich layer (Figure 14b). The exact concentra- tions of those two measurements are 13.44 mg/L and 7.3 mg/L. The rest of the samples and measure- ments fit in a narrower range between 0.94 mg/L and 0.28 mg/L. The trend of Oval Lake and Outflow Oval Lake is similar to the trend observed in the concentration of DOC. At Lucky Lake the POC samples from 2016 are similar to those of Oval Lake and Outflow Oval Lake. In 2017 the concentration at Lucky Lake is higher at the surface (0.94 mg/L) and decreases with depth to 0.59 mg/L at 3m (Figure 14b). The concentration at the outflow of Lucky Lake reaches the lowest value on Kurungnakh.
The lowest ∆14C per mil value was measured in a sample from Lucky Lake from 2016 with -384‰ (Figure 14c). The highest per mil value was measured in a water sample from Oval Lake Outflow in 2017 with - 300‰. Generally, the graph looks like an inverse copy of the DOC concentration graph of Kurungnakh (Figure 14a). The samples from Oval Lake and Oval Lake Outflow have, together with the sample from the Outflow at the coast, the highest per ∆14C values (Figure 14c). In contrast to this the Lucky Lake cen- ter has the most 14C depleted signatures. In the continuing flow the signature becomes younger to the outflow at Lucky Lake and coast to the Lena River.
The range of different ∆14C signatures for POC on Kurungnakh is immense with a difference of 302‰
(Figure 14d). The most enriched value (-126‰) was measured in 2016 in Lucky Lake at a depth of 3.5- 3.7m (Figure 14d). The oldest signature was measured at the coastal outflow to Lena River with a ∆ 14C signature of -428‰. The general trend of the ∆ 14C signature of POC is decreasing towards the outflow to the Lena. From Oval Lake to Lucky Lake the signature becomes a little younger. Before the outflow it is older than at the outflow of Lucky Lake. The oldest signature was measured in samples of the outflow to the Lena River. While the DOC becomes younger towards the outflow in a small scale, the signature of POC is decreasing in a much larger scale (Figure 14d).
Kurungnakh
Delta 14C signature of the oldest soil Delta 14C signature of the atmosphere in 2016 and 2017
OV OV
OV OVO LLLLLL LLBOLLBOLLBO LLO OV
OV
OV OVO LLLLLL LLO OC
Location of Sampling
4 4,2 4,4 4,6 4,8 5 5,2
DOC (mg/L)
-400 -380 -360 -340 -320 -300 -280 Delta 14C DOC
0,2 0,4 0,6 0,8 1
POC (mg/L)
-500 -400 -300 -200 -100
Delta 14C POC
6 8 10 12 14 16
-1000 -960 8 -1000 -960
(b)
(a)
(c) (d)
Figure 7 is a diagram showing the concentration and signature of ∆ 14C of DOC and POC from Kurungnakh.
Figure 14: Concentration and 14C sig- nature in ∆14C (‰) of DOC and POC from Kurungnakh.
(a) –DOC concentration in mg/L from 2016 and 2017 (b) –POC concentration in mg/L from 2016 and 2017 (c) –∆14C signature in per mill from 2016 and 2017 of DOC (d) – Diagram d shows the Delta 14C signature in per mill from 2016 and 2017 of POC
6 Discussion
The plotted and described values of DOC-, POC concentrations and their measured ∆ 14C signatures show similarities and reoccurring differences. In this chapter those characteristics will be put into con- text by answering specific questions, which help to summarize the earned results.
Main factor at play between the samples exist between the terraces type and the sample locations (ponds vs lakes). The differences found due to the divergent hydrogeology and geology and may lead to certain connections between the sizes of waterbodies and DOC.
6.1 Does a relationship exist between the size of a water body, the DOC concentration and the ∆
14C signature on Samoylov?
Samoylov belongs to the First Terrace unit of the Lena Delta (Figure 15). On this island, concentrations and radiocarbon signatures of DOC in polygons and North Lake on Samoylov are distinctly different. The majority of the measurements from polygon samples show a high concentration of DOC (4.33 to 4.97 mg/L) whereas the lake has a lower concentration (2.62 to 3.29 mg/L).
Figure 15: Satellite picture of the three sampled Polygons (PS = Polygon South, PM = Polygon Middle, PN = Poly- gon North) of Samoylov (changed after Boike 2014). The red Arrow marks a crescent-shaped water- body, which may have an influence on Polygon North (PN).
Two DOC concentrations of polygons do not fit into this range. A higher concentration of 7.63 mg/L was measured in a sample from Polygon South in 2017. Ecological events and interactions could influence DOC concentrations in individual ponds, such as is seen in, the very high concentration of DOC in Poly- gon South in 2017. An algal bloom is an event that frequently occurs in ponds and lakes at different times during summer (personal communication Dr. Anne Morgenstern, Alfred-Wegner Institute, Pots- dam 2019). Thus, the extreme peak in concentration is not a unique attribute to show a relationship
between the size of a waterbody and the concentration of DOC because it happens in small and bigger water bodies.
The lower concentration (3.7 mg/L) was found in a sample of Polygon North in 2017. A difference in the hydrogeological shape might be the reason for this change. Possible changes between the years could result in a degradation of the polygon or a new lateral in- /outflow. In a satellite image, taken in 2014 (Figure 15), no real evidence for a future in- / outflow or any change in shape, is visible for Polygon North. The only possible hint for a change of the hydrogeological shape can be the crescent-shaped wa- terbody (Figure 15: red arrow), which could nowadays be connected with the Polygon North. This could mean that due to freezing and thawing the degradation of the remaining soil, which divorces the Poly- gon North from the two smaller ponds in south-eastern direction and the crescent-shaped waterbody, took place. This connection would lead to a bigger surface area and a larger volume of this waterbody.
Other studies show similar results. In measurements of Abnizova et al. (2012) the concentration of DOC in polygons is higher too (Table 4). The concentration in lakes on the other hand is low. One of the lakes sampled in the study of Abnizova et al (2012) shows a deviant high concentration of DOC, which is ex- plained by its connection with the floodplain of Samoylov. The floodplain supplies more organic matter to Lake 1, which leads to an increase of the DOC concentration. This influence of the floodplain on the lake can be recognized in the satellite pictures (Appendix 2). Furthermore, the increasing Cl- and Na+ Ions support an influence from the Lena River (Appendix 3).
Table 4: DOC concentrations of Abnizova (2012)
Abnizova Lake 1 Lake 2 Pond 1 Pond 2 Outlet Floodplain
DOC (mg/L) 3.99 2.1 4.2 6.8 2.79 4.29
min (mg/L) 2.79 1.7 3.1 4.2 1.89 2.6
max (mg/L) 5.6 2.6 5.4 14.4 3.8 6.5
Since the general volume is smaller a higher concentration would automatically be assumed. This causal- ity leads to the hypothesis that the concentration of DOC is higher in ponds than in lakes on islands from the first terrace.
The DOC concentration is not the only feature which is higher in polygons. Samples taken from these polygons show also a higher ∆14C value > 0‰ indicative of a modern carbon source. While ∆14C of 0‰
would reflect the atmospheric 14C content of 1950, much higher radiocarbon levels were reached in the second half of the 20th century as a result of the nuclear bomb tests in the 1950s (Trumbore 2009). By comparing the measured ∆14C values of the samples with the values of the atmosphere from the years 1955 to 2017, one can see that the signature of the polygons and the atmospheric values of 2002 are most similar (Table 5).
Table 5: Delta 14C values of the atmosphere of the northern Hemisphere (Graven et al. 2017)
Date 1999 2000 2001 2002 2003 2004 2005
Delta 14CO2 [‰] 94.1 88.3 82.2 76.2 70.6 65.4 60.7 The active layer does not only derive from one special year, which makes it also inhomogenous in the
∆14C-signature. One has to consider this mixture of material from the year of sampling and the years before (Table 6). This would mean for the measurement from Polygon Middle of 56 ‰ ∆ 14C in 2016 that a mixture of the same amount of material from the years 2016 to 2000 lead to the measured ∆ 14C sig- nature. The material dissolved in Polygon South with a ∆ 14C of 50 ‰ results from the period 2016 to 2002. The lowest ∆ 14C signature measured in Polygons in 2016 with 46 ‰ can be matched to period