Research Collection
Report
Nexus-e: GemEl Module Documentation
Author(s):
van Nieuwkoop, Renger H.
Publication Date:
2020-11-27 Permanent Link:
https://doi.org/10.3929/ethz-b-000471882
Rights / License:
In Copyright - Non-Commercial Use Permitted
Department of the Environment,
Transport, Energy and Communication DETEC Swiss Federal Office of Energy SFOE Energy Research and Cleantech
Final report
Nexus-e: Integrated Energy Systems Model- ing Platform
GemEl Module Documentation
Source:ESC 2019
Date: 27. November 2020 Location: Bern
Publisher:
Swiss Federal Office of Energy SFOE Energy Research and Cleantech CH-3003 Bern
www.bfe.admin.ch Co-financing:
-
Subsidy recipients:
ETH Zürich
Centre for Energy Policy and Economics (CEPE) Zürichbergstrasse 18, CH-8092, Zürich
https://cepe.ethz.ch Authors:
Renger van Nieuwkoop, Centre for Energy Policy and Economics - ETH Zurich, renger@vannieuwkoop.ch
SFOE project coordinators:
SFOE head of domain: Yasmine Calisesi, yasmine.calisesi@bfe.admin.ch
SFOE programme manager: Anne-Kathrin Faust, anne-kathrin.faust@bfe.admin.ch SFOE contract number:SI/501460-01
Summary
Policy changes in the energy sector result in wide-ranging implications throughout the entire energy system and influence all sectors of the economy. Due partly to the high complexity of combining separate models, few attempts have been undertaken to model the interactions between the components of the energy-economic system. The Nexus-e Integrated Energy Systems Modeling Platform aims to fill this gap by providing an interdisciplinary framework of modules that are linked through well-defined interfaces to holistically analyze and understand the impacts of future developments in the energy system. This platform combines bottom-up and top-down energy modeling approaches to represent a much broader scope of the energy-economic system than traditional stand-alone modeling approaches.
In Phase 1 of this project, the objective is to develop a novel tool for the analysis of the Swiss electricity system. This study illustrates the capabilities of Nexus-e in answering the crucial questions of how centralized and distributed flexibility technologies could be deployed in the Swiss electricity system and how they would impact the traditional operation of the system. The aim of the analysis is not policy advice, as some critical developments like the European net-zero emissions goal are not yet included in the scenarios, but rather to illustrate the unique capabilities of the Nexus-e modeling framework.
To answer these questions, consistent technical representations of a wide spectrum of current and novel energy supply, demand, and storage technologies are needed as well as a thorough economic evaluation of different investment incentives and the impact investments have on the wider economy.
Moreover, these aspects need to be combined with modeling of the long- and short-term electricity market structures and electricity networks. This report illustrates the capabilities of the Nexus-e platform.
The Nexus-e Platform consists of five interlinked modules:
1. General Equilibrium Module for Electricity (GemEl): a computable general equilibrium (CGE) mod- ule of the Swiss economy,
2. Centralized Investments Module (CentIv): a grid-constrained capacity expansion planning module considering system flexibility requirements,
3. Distributed Investments Module (DistIv): a generation expansion planning module of distributed energy resources,
4. Electricity Market Module (eMark): a market-based dispatch module for determining generator production schedules and electricity market prices,
5. Network Security and Expansion Module (Cascades): a power system security assessment and transmission system expansion planning module.
This report provides the description and documentation for the GemEl module, which is utilized in the Nexus-e framework to provide feedback between the economy and the bottom-up models, as well as give insights in the economic effects of the implemented scenarios. GemEl is a recursive-dynamic CGE model with up to 75 sectors and 14 household types. It is based on the 2014 Swiss energy-specific differentiated input–output table for the energy sector (IOT-Energy).
Zusammenfassung
Politische Veränderungen im Energiesektor haben weitreichende Auswirkungen auf das gesamte En- ergiesystem und beeinflussen alle Sektoren der Wirtschaft. Aufgrund der hohen Komplexität der En- ergiewirtschaft, wurden bisher nur wenige Versuche unternommen, die Wechselwirkungen zwischen den einzelnen Komponenten dieses Systems zu modellieren. Nexus-e, eine Plattform für die Model- lierung von integrierten Energiesystemen, schliesst diese Lücke und schafft einen interdisziplinäre Plat- tform, in welcher verschiedene Module über klar definierten Schnittstellen miteinander verbunden sind.
Dadurch können die Auswirkungen zukünftiger Entwicklungen in der Energiewirtschaft ganzheitlicher analysiert und verstanden werden. Die Nexus-e Plattform ermöglicht die Kombination von „Bottom- Up“ und „Top-Down“ Energiemodellen und ermöglicht es dadurch, einen breiteren Bereich der En- ergiewirtschaft abzubilden als dies bei traditionellen Modellierungsansätzen der Fall ist.
Phase 1 dieses Projekts zielt darauf ab, ein neuartiges Instrument für die Analyse des schweiz- erischen Elektrizitätssystems zu entwickeln. Um die Möglichkeiten von Nexus-e zu veranschaulichen, untersuchen wir die Frage, wie zentrale und dezentrale Flexibilitätstechnologien im schweizerischen Elektrizitätssystem eingesetzt werden können und wie sie sich auf den traditionellen Betrieb des En- ergiesystems auswirken würden. Ziel der Analyse ist es nicht Empfehlungen für die Politik zu geben, da einige wichtige Entwicklungen wie das Europäische Netto-Null-Emissionsziel noch nicht in den Szenar- ien enthalten sind. Vielmehr möchten wir die einzigartigen Fähigkeiten der Modellierungsplattform Nexus-e vorstellen. Um diese Fragen zu beantworten, ist eine konsistente technische Darstellun- gen aktueller und neuartiger Energieversorgungs-, Nachfrage- und Speichertechnologien, sowie eine gründliche wirtschaftliche Bewertung der verschiedenen Investitionsanreize und der Auswirkungen der Investitionen auf die Gesamtwirtschaft erforderlich. Darüber hinaus müssen diese Aspekte mit der Mod- ellierung der lang- und kurzfristigen Strommarktstrukturen und Stromnetze kombiniert werden.Dieser Report veranschaulicht die Fähigkeiten der Nexus-e Plattform.
Die Nexus-e Plattform besteht aus fünf miteinander verknüpften Modulen:
1. Allgemeines Gleichgewichtsmodul für Elektrizität (GemEl): ein Modul zur Darstellung des allge- meinen Gleichgewichts (CGE) der Schweizer Wirtschaft,
2. Investitionsmodul für zentrale Energiesysteme (CentIv): ein Modul zur Planung des netzgebunde- nen Erzeugungsausbaus (GEP) unter Berücksichtigung der Anforderungen an die Systemflexibil- ität,
3. Investitionsmodul für dezentrale Energiesysteme (DistIv): ein GEP-Modul für dezentrale Energieer- zeugung,
4. Strommarktmodul (eMark): ein marktorientiertes Dispatch-Modul zur Bestimmung von Generator- Produktionsplänen und Strommarktpreisen,
5. Netzsicherheits- und Erweiterungsmodul (Cascades): ein Modul zur Bewertung der Sicherheit des Energiesystems und zur Planung der Erweiterung des Übertragungsnetzes.
Dieser Bericht beinhaltet die Beschreibung und die Dokumentation des GemEl-Moduls. Dieses Modul wird im Rahmen der Nexus-e Plattform verwendet, um Feedback zwischen der Wirtschaft und den Bottom-up-Modellen zu liefern und Einblicke in die wirtschaftlichen Auswirkungen der implemen-
Résumé
Les changements de politique dans le secteur de l’énergie ont de vastes répercussions sur l’ensemble du système énergétique et influencent tous les secteurs de l’économie. En partie à cause de la grande complexité de la combinaison de modèles séparés, peu de tentatives ont été entreprises pour modéliser les interactions entre les composantes du système économico-énergétique. La plateforme de modélisa- tion des systèmes énergétiques intégrés Nexus-e vise à combler cette lacune en fournissant un cadre interdisciplinaire de modules qui sont reliés par des interfaces bien définies pour analyser et compren- dre de manière holistique l’impact des développements futurs du système énergétique. Cette plateforme combine des approches de modélisation énergétique ascendante et descendante pour représenter un champ d’application beaucoup plus large du système économico-énergétique que les approches de modélisation indépendantes traditionnelles.
Dans la phase 1 de ce projet, l’objectif est de développer un nouvel outil pour l’analyse du sys- tème électrique suisse. Cette étude sert à illustrer les capabilités de Nexus-e à répondre aux questions cruciales de comment les technologies de flexibilité centralisées et décentralisées pourraient être dé- ployées dans le système électrique suisse et comment elles affecteraient le fonctionnement traditionnel du système. Le but de cette analyse n’est pas d’offrir de conseils politiques, en tant que les scénarios ne considèrent pas des développements critiques comme l’objectif Européen d’atteindre zéro émission nette, mais d’illustrer les capabilités uniques de la plateforme Nexus. Pour répondre à ces questions, des représentations techniques cohérentes d’un large éventail de technologies actuelles et nouvelles d’approvisionnement, de demande et de stockage d’énergie sont nécessaires, ainsi qu’une évaluation économique approfondie des différentes incitations à l’investissement et de l’impact des investissements sur l’économie au sens large. En outre, ces aspects doivent être combinés avec la modélisation des structures du marché de l’électricité et des réseaux d’électricité à long et à court terme. Ce rapport illustre les capacités de la plateforme Nexus-e.
La plateforme Nexus-e se compose de cinq modules interconnectés:
1. Module d’équilibre général pour l’électricité (GemEl) : un module d’équilibre général calculable (CGE) de l’économie suisse,
2. Module d’investissements centralisés (CentIv) : un module de planification de l’expansion de la production (GEP) soumise aux contraintes du réseau, qui tient compte des exigences de flexibilité du système,
3. Module d’investissements distribués (DistIv) : un module GEP de la production décentralisée d’énergie,
4. Module du marché de l’électricité (eMark) : un module de répartition basé sur le marché pour déterminer les calendriers de production des producteurs et les prix du marché de l’électricité, 5. Module de sécurité et d’expansion du réseau (Cascades) : un module d’évaluation de la sécurité
du système électrique et de planification de l’expansion du système de transmission.
Ce rapport fournit la description et la documentation du module GemEl, qui est utilisé dans le cadre de Nexus-e pour fournir un retour d’information entre l’économie et les modèles ascendants, ainsi que pour donner un aperçu des effets économiques des scénarios mis en œuvre. GemEl est un modèle EGC récursif-dynamique comprenant jusqu’à 75 secteurs et 14 types de ménages. Il est basé sur le tableau entrées-sorties (TES) spécifique à l’énergie suisse de 2014.
Contents
Summary. . . 3
Zusammenfassung . . . 4
Résumé . . . 5
Contents . . . 6
Abbreviations . . . 7
1 Introduction . . . 9
1.1 Module purpose . . . 9
1.2 Process overview . . . 9
1.3 Attributes . . . 9
1.4 Capabilities . . . 9
1.5 Limitations . . . 10
1.6 Inputs and outputs . . . 10
2 Related work and contributions . . . 11
3 Detailed description of the module . . . 13
3.1 Consumer behavior in the model . . . 13
3.2 Producer behavior in the model . . . 17
3.3 International trade . . . 19
3.4 Market clearing . . . 21
3.5 The mixed-complemetarity format . . . 21
3.6 Time in the CGE model . . . 24
4 Description of interfaces . . . 26
4.1 Investments-GemEl interface . . . 28
4.2 eMark-GemEl interface . . . 28
4.3 GemEl-Investments interface . . . 28
5 Demonstration of results . . . 30
6 Publications . . . 32
7 References . . . 33
Abbreviations
BAU business-as-usual
Cascades Network Security and Expansion Module CentIv Centralized Investments Module
CES constant-elasticity of substitution CGE computable general equilibrium CHP combined heat and power CO2 carbon dioxide
CP complementarity problem DistIv Distributed Investments Module eMark Electricity Market Module
EMP-E Energy Modeling Platform for Europe
EU European Union
GDP gross domestic product
GemEl General Equilibrium Module for Electricity HBS household budget survey
IOT-Energy differentiated input–output table for the energy sector MCP mixed-complementarity problem
MSW municiple solid waste
MWh megawatt hour
OM operation and maintenance
PV photovoltaic
ROW rest of the world TWh terawatt hour
List of Figures
1 Diagram of the utility function . . . 14
2 Swiss households income and expenditures . . . 16
3 Illustration of domestic production function . . . 18
4 Illustration of the treatment of imports and exports . . . 20
5 Illustration of assumed projections . . . 25
6 Interface between GemEl and bottom-up models . . . 27
7 Recalibration of the electricity sector . . . 27
8 Changes in domestic producer prices . . . 30
9 Change in household utility . . . 31
10 Domestic electricity generation . . . 31
11 Calibration of the CES function with benchmark values. . . 35
12 Splitting a two-level nested CES production function . . . 36
List of Tables
1 GemEl required input data . . . 10
2 GemEl resulting output data . . . 10
3 CGE models used in Switzerland . . . 11
4 List of consumer goods modeled . . . 14
5 Variables and parameters of the utility functions . . . 14
6 Utility function substitution elasticities . . . 15
7 Comparison of household expenditures and income . . . 16
8 Sectors in GemEl . . . 17
9 Variables and parameters of the production functions . . . 18
10 Domestic production and Armington elasticities . . . 19
11 Variables and parameters of the trade functions . . . 20
12 International trade and Armington elasticities . . . 20
13 Variables and parameters of the zero-profit condition . . . 23
14 Assumed projections for Swiss population, GDP and energy demand . . . 25
15 CentIv-GemEl and DistIv-GemEl interface data . . . 28
16 eMark-GemEl interface data . . . 28
17 GemEl-Investments interface data . . . 29
18 Calibrated share formulas for CES and Cobb-Douglas functions. . . 35
1 Introduction
1.1 Module purpose
The GemEl module (Applied General Equilibrium of the Economy, the Environment, and Energy) is a detail-rich CGE model for Switzerland based on the most actual economic data available. The model simulates the markets for all goods and services produced and demanded. It can be used for almost any policy measure and especially for evaluating the efficiency and distributional effects of energy policy measures as well as new investments in new electricity generation. Analysis of distributional effects is possible because the model contains 14 active and retired household groups distinguished by income.
The model also can keep track of emissions and the yearly produced and demanded electricity.
1.2 Process overview
The GemEl module simulates the Swiss economy with over 77 sectors and 14 household groups using a yearly resolution. All good and factors markets are cleared simultaneously as GemEl is formulated as a system of non-linear equalities and inequalities resulting in the prevailing for each good the market prices, as well as the demand and supply.
1.3 Attributes
GemEl can be characterized by:
• Richness in detail: Around 75 sectors producing goods and services, 14 household groups. It also contains the Swiss emission trading system for carbon dioxide (CO2).
• Dynamics: The model can be run in yearly or multi-yearly periods and is calibrated to the Energy Perspectives growth paths for gross domestic product (GDP), and energy. The total and employed population is updated yearly according to the population scenarios of the Swiss Federal Statistics Office.
• Energy market: Not only the value of electricity demanded or produced but also the quantity (mea- sured in terawatt hour (TWh) per year).
• Environmental indicators: Information on the level of CO2emissions in Switzerland.
• Actual Data: The model uses the most recent actual data: the just-released energy- and transport- specific IOT-Energy, the newest household budget survey (HBS) data as well as the electricity statistic for Switzerland.
• Flexibility: It can be easily updated if new data is available or extended if more energy carriers are added to the Nexus-e Framework.
1.4 Capabilities
GemEl can analyze the economic impact of energy policies and changes in the electricity generation mix. It gives information on the behavior of key macroeconomic variables like GDP, ex- and imports, tax revenue, as well as information on changes in sectoral prices and production. On the demand side, GemEl provides information on the distributional impact of energy policies: Which household gains, which household looses? What are the costs for the household of a certain energy policy? Although
GemEl is not a model that produces projections, it can be used to compare alternative energy policies and rank them according to their impact on the efficiency of the economy. As the model has informa- tion on the sectoral and demand-side emissions of CO2, the model can be used to find the CO2price necessary for reaching the targets set by the Federal Council.
1.5 Limitations
GemEl has some limitations: It assumes perfect competition on all markets. It has a yearly time res- olution contrary to the high resolution of the bottom-up modules of the Nexus-e framework and can, therefore not depict the daily and seasonal price changes. GemEl is a single-country model and there- fore can only set policy-induced changes in import prices endogenously.
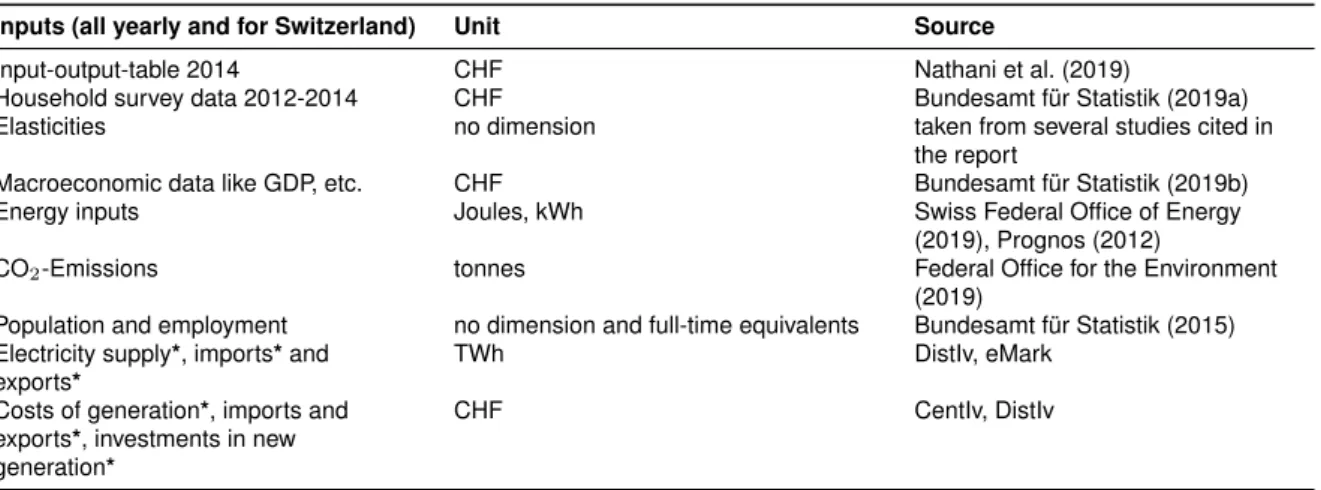
1.6 Inputs and outputs
Tables 1 and 2 below lists this module’s required input and resulting output data. Those data that are input from or sent to another module through an interface are noted with an asterisks (*).
Table 1: Listing of required input data for the GemEl module
Inputs (all yearly and for Switzerland) Unit Source
Input-output-table 2014 CHF Nathani et al. (2019)
Household survey data 2012-2014 CHF Bundesamt für Statistik (2019a)
Elasticities no dimension taken from several studies cited in
the report
Macroeconomic data like GDP, etc. CHF Bundesamt für Statistik (2019b)
Energy inputs Joules, kWh Swiss Federal Office of Energy
(2019), Prognos (2012)
CO2-Emissions tonnes Federal Office for the Environment
(2019)
Population and employment no dimension and full-time equivalents Bundesamt für Statistik (2015) Electricity supply*, imports*and
exports*
TWh DistIv, eMark
Costs of generation*, imports and exports*, investments in new generation*
CHF CentIv, DistIv
Table 2: Listing of resulting output data for the GemEl module.
Output (all yearly, for Switzerland) Units
GDP, exports, imports, sectoral production, tax revenue CHF or EUR
Welfare and distributional effects percentage change
Sectoral prices and production, cost indices* indexed CHF
CO2price of permits and CO2 tax* CHF
Electricity demand* TWh
CO2-Emissions tonnes
2 Related work and contributions
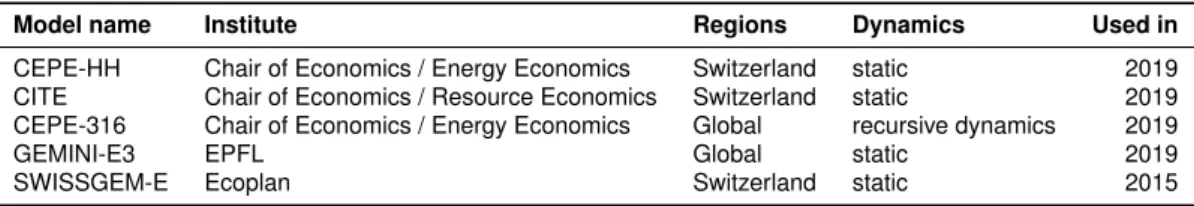
GemEl is a CGE model and distinguishes itself from other models in Switzerland through its higher complexity and use of the most recent actual IOT-Energy data. There are several research groups, as well as a consultancy firm currently also working on CGE modeling (listed in Table 3).1
Table 3: Actual CGE models used in Switzerland
Model name Institute Regions Dynamics Used in
CEPE-HH Chair of Economics / Energy Economics Switzerland static 2019 CITE Chair of Economics / Resource Economics Switzerland static 2019 CEPE-316 Chair of Economics / Energy Economics Global recursive dynamics 2019
GEMINI-E3 EPFL Global static 2019
SWISSGEM-E Ecoplan Switzerland static 2015
Landis et al. (2019) compare several Swiss CGE models used for assessing the economic and tech- nological consequences of reaching emission reduction targets for 2050 in the context of Switzerland:
• The CEPE-HH (Computable General Equilibrium Model for Energy Policy and Economics—with a focus on household consumption) is a static small open economy model of the Swiss economy (Landis, 2019) and designed to assess the implications of environmental and energy regulation in particular on the consumption and welfare of different Swiss households.
• The CEPE-316 is a recursive-dynamic, multi-country model with three regions and 16 sectors.
The three regions are Switzerland, the European Union (EU), and the rest of the world (ROW). It is based on the GTAP Power data set 9.1(Aguiar, Narayanan, and McDougall, 2016), which contains detailed information on energy sectors and emissions for the year 2011 (Peters, 2016). The model assumes myopic foresight. Capital stock in the next period is calculated using the actual invest- ments and the depreciated capital at the end of the actual period. The sectoral differentiation is geared to energy questions. The energy sectors are oil, gas, electricity generation (split into peak- or base-load generation from nuclear, coal, gas, wind, hydropower, oil, other energy, and solar), and electricity distribution. The other sectors are transport and the primary, secondary, and tertiary (minus transport) sectors. The transport sector is modeled as most other sectors in the model and does not contain detailed information on transport technologies used. Transportation demand is assumed to grow with the steady-state growth rate without taking into account the move from fossil fuels to electric driven cars. The model allows for exogenous technological change, capacity limits on electricity generation, and inclusions of new generation technologies. One advantage of the model is the multi-regional character, which allows for a more realistic implementation of different emission trading systems, regional endogenous or exogenous energy, or CO2taxes compared to a single-country model. Furthermore, the consideration of time allows analyzing changes during the transition period of a policy. The advantage of the use of the GTAP 9 Power data is the detailed representation of the electricity market.
• The CITE (Computable Induced Technical change and Energy) model is a dynamic small open economy model of the Swiss economy with fully endogenous growth. The main feature of CITE is that growth in the different sectors is driven by an expansion in the types of intermediate goods (machines), in accordance with the seminal contribution of Romer (1990). Investments in physical capital and knowledge extend the number of capital varieties, which fosters factor productivity. The CITE model represents different sectors of the economy, including ten non-energy sectors and the electricity sector. Transport is modeled as a non-energy sector without technological detail. Gen- eration technologies are divided into three categories: intermittent technologies including wind
1It must be noted that with the exception of the CITE and GEMINI-E3 models, the author either built the model (CEPE-316) or played a role in developing it.
and solar, nuclear power (available until 2034), and constant electricity supply technologies includ- ing hydropower, conventional thermal plants, electricity from waste, and biomass (Bretschger and Zhang, 2017) The trade-offs between and within groups are modeled with constant-elasticity-of- production functions. In CITE, a representative consumer allocates income between consumption and investments to maximize its inter-temporal utility under perfect foresight.
• GEMINI-E3 (General Equilibrium Model of International National Interactions between Economy, Energy, and the Environment) is a multi-country, multi-sector, recursive CGE model (Bernard and Vielle, 2008). It is a global model built using the GTAP database and the Swiss IOT-Energy.
GEMINI-E3 is recursive dynamic, with backward-looking (adaptive) expectations. In this model, periods are linked through endogenous real interest rates that equate savings and investment.
Capital is not mobile across regions. National and regional models are linked by endogenous real exchange rates resulting from constraints on foreign trade deficits or surpluses. It includes a specific representation of the road transport sector, where several types of vehicles are detailed according to the fuel used.
• SWISSGEM-E is a single-country static CGE model for Switzerland using data for the year 2008 developed by Ecoplan (Böhringer and Müller, 2014). It contains 62 sectors, and 15 different types of households. It contains a bottom-up formulation of electricity production. The model has been used to study the impacts of energy and CO2taxes.
GemEl distinguishes itself in several aspects and shows a higher complexity as it combines aspects of these models. At the moment, it is the only CGE model in Switzerland based on the most recent actual data (the energy-specific IOT-Energy from 2014 (Nathani et al., 2019)). Furthermore, it makes a clear distinction between the several sources of electricity generation by using actual prices and quantities in TWh (and not, as in all the other models, a unitary benchmark price for all electricity flows). It is also the only CGE model that is developed in close cooperation with engineers. GemEl is also dynamic and it contains several households.
3 Detailed description of the module
The standard CGE model is based on the work of Arrow and Debreu (1954), who proved that, under very general conditions, an equilibrium for the economic system as developed by Walras in 1924 exists.2 This general equilibrium is “the solution of a system of simultaneous equations representing the demand for goods by consumers, the supply of goods by producers, and the equilibrium condition that supply equal[s] demand on every market” (Arrow and Debreu, 1954, p.265).
The driving factors for reaching an equilibrium are the following three assumptions on the behavior of the producers and consumers in the model: First, each consumer, taking prices as given, chooses a bundle of goods whose cost does not exceed its income and maximizes its utility. Second, producers maximize their profits (or minimize their costs), given their production technology. Third, supply should at least cover demand in each market. These three conditions, together with the requirement that prices should be non-negative constitute a general equilibrium.
The following sections describe the consumer and producer behavior (Sections 3.1 and 3.2, respec- tively), and the closure of the model with the rest of the world (Section 3.3). The clearing of the markets is described in Section 3.4. The model is setup and solved as a mixed-complementarity problem (MCP).
This setup is explained in Section 3.5. Finally, Section 3.6 describes the treatment of time in the model.
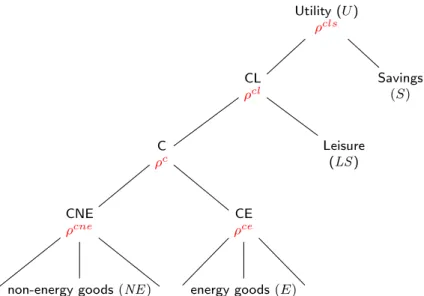
3.1 Consumer behavior in the model
The consumers in the model, a representative agent (or several household groups) and the government, maximize their welfare in the form of a hierarchical constant-elasticity of substitution (CES) utility function (see Figure 1). At each nest, the responsiveness to relative changes in the prices of the goods in the nest is defined by the substitution elasticity. The goods are perfect substitutes when the substitution elasticity approaches infinity and perfect complements when it approaches zero. At the lowest level of the hierarchy, the consumer decides on the composition of a bundle of non-energy and energy goods.
These two bundles build a composite consumption good that, at the next level, is combined with leisure.
At the top level, the composite of consumption and leisure is combined with savings to a measure for welfare.
The utility function as shown in Figure 1 is given by:3
U =
θcls h
θclCρcl+ (1−θcl)LSρcli1/ρclρ
cls
+ (1−θcls)Sρcls
1/ρcls
, (1)
whereLSis the demand for leisure andSthe amount of savings. The composite consumption good is defined over the available consumer goods categorized according to the divisions of the Classification of the Purposes of Non-Profit Institutions Serving Households (United Nations, 1999). These goods are listed in Table 4. The substitution and value share parameters are denoted withρandθ. The superscripts of the elasticities indicate the nest. The variables and parameters of the equations are described in Table 5. The aggregated consumption (C) good of non-energy (N E) and energy goods (E) is given by:
C=
θc
X
ne
θcnene NEρnecne
!1/ρcne
ρc
+ (1−θc)
X
e
θeceEeρce
!1/ρce
ρc
1/ρc
, (2)
2The Walras system can be found in the English translation of the original work Walras (2014).
3Note that variables are always written in capitals and parameters in small letters.
Utility (U) ρcls
Savings (S) CL
ρcl
Leisure (LS) C
ρc
CE ρce
energy goods(E) CNE
ρcne
non-energy goods(NE)
Figure 1: Utility function with substitution parameters (ρ) for each nest.
Table 4: Consumer goods in the model.
COICOP Description HABE
C01 Food and non-alcoholic beverages A51
C02 Alcoholic beverages, tobacco, and narcotics A52
C03 Clothing and footwear A56
C04 Housing, water, gas, electricity, and other fuels A57
C05 Furnishings, household equipment and routine maintenance of the house A58
C06 Health A61
C07 Transport A62
C08 Communication A63
C09 Recreation and culture A66
C10 Education A67
C11 Restaurants and hotels A53
C12 Miscellaneous goods and services A68
Table 5: Variables and parameters of the utility functions.
Variable Parameter
U Utility θcls value share of consumption-leisure composite
C Total consumption θcl subst. parameter of leisure-consumption nest
LS Leisure ρcls subst. parameter top nest
S Savings ρce subst. parameter of energy goods
CNE Non-energy consumption goods θcne cost share of non-energy goods CEe Consumption of energy goode θcee cost share of energy goode
T R Transfers θcne subst. parameter between non-energy goods
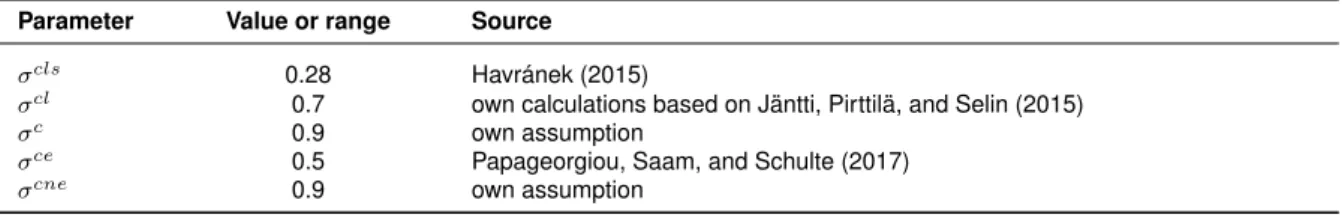
An important aspect of the utility function is the choice of elasticities of substitution. These elasticities
Table 6: Utility function: Values for the substitution elasticities and their source.
Parameter Value or range Source
σcls 0.28 Havránek (2015)
σcl 0.7 own calculations based on Jäntti, Pirttilä, and Selin (2015)
σc 0.9 own assumption
σce 0.5 Papageorgiou, Saam, and Schulte (2017)
σcne 0.9 own assumption
The income for the representative agent (RA) is defined by:
IRA=w(L−LS) +rK+TR−TRA, (3) whereLis the time endowment,rthe rental price of capital endowmentK. The income for the govern- ment is given as:
IGov =TRA+TP rod−TR (4)
The labor endowment of the government (and therefore its leisure demand in the utility function) is zero. The behavior of the representative consumer and the government in the model is now explicitly described by the maximization of the utility function (Equations (1) and (2)) subject to their respective income constraints (Equations (3) and (4)).
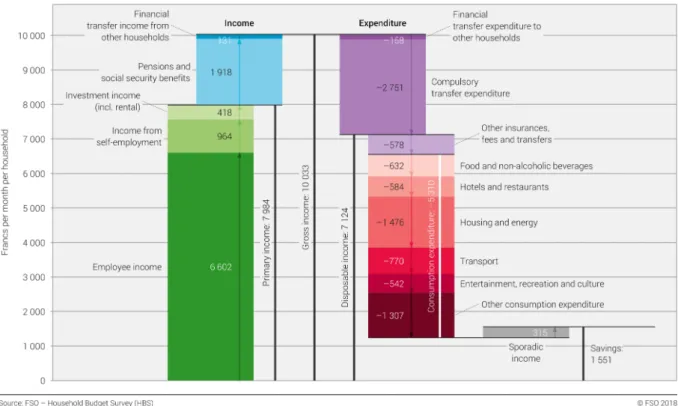
The database used for GemEl is the Swiss IOT-Energy of the year 2014 (Nathani et al., 2019). This table provides a detailed description of an economy’s circular flow of goods and services. GemEl allows to disaggregate the representative household from the IOT-Energy in 14 separate household groups according to their income and being retired or not (10 working and 4 retired groups). This disaggregation is based on data from the Swiss HBS (Bundesamt für Statistik, 2019a). The HBS is conducted yearly and collects all income and expenditures. Due to the rather small annual HBS sample size (around 3000 households), tables for subgroups can only be based on a pooled sample of at least three years. We use the data for the years 2012, 2013, and 2014. Figure 2 taken from Bundesamt für Statistik (2019a) shows the most important income and expenditures of households in Switzerland.
Every household has a weight that secures that the total sample of around 10’000 households is a good representation of the actual households in Switzerland. If we aggregate using the household weights, we found a discrepancy between the consumer expenditure and income with the numbers in the IOT-Energy 2014. We reconciled the data to get a close match. In a first step, we use the HBS to calculate the total income and expenditure for all households in Switzerland (column “HBS” in Table 7) and compare these figures with the respective figures in the IOT-Energy, the national accounts, and other statistics (column “target”). The table shows that there are greater differences in some of the consumer goods, taxes on income, and capital income. The discrepancy in consumer good C02 (Alcoholic beverages, tobacco, and narcotics) is a typical result in HBSs as households tend to under- report these items. Health expenditure is treated differently at the macroeconomic level and often leads to big discrepancies. In a second step, the household data is scaled to the IOT-Energy values.
Figure 2: Average income and expenditure of households in Switzerland for the year 2016.(Bundesamt für Statistik, 2019a)
Table 7: Comparison of macro values of household expenditure and income in million CHF.
Code Description Source for target Target HBS Difference Factor
C01 Food and non-alcoholic beverages IOT20141 -29’633 -26’985 -2’649 1.1
C02 Alcoholic beverages, tobacco, and narcotics IOT2014 -8’725 -4’445 -4’279 2.0
C03 Clothing and footwear IOT2014 -10’293 -9’502 -791 1.1
C04 Housing, water, gas, electricity, and other fuels
IOT2014 -80’983 -63’172 -17’811 1.3
C05 Furnishings, household equipment and routine maintenance of the house
IOT2014 -12’318 -11’586 -733 1.1
C06 Health IOT2014 -59’417 -11’077 -48’340 5.4
C07 Transport IOT2014 -27’767 -33’839 6’072 0.8
C08 Communication IOT2014 -8’087 -7’816 -270 1.0
C09 Recreation and culture IOT2014 -26’003 -25’450 -553 1.0
C10 Education IOT2014 -2’060 -1’878 -182 1.1
C11 Restaurants and hotels IOT2014 -21’995 -23’512 1’517 0.9
C12 Miscellaneous goods and services IOT2014 -38’144 -10’548 -27’596 3.6
Lab Labor income IOT2014 325’381 319’468 5’913 1.0
Cap Capital income VGR: S14-D.42 69’230 33’396 35’833 2.1
IncTax Taxes on income VGR: S14-D.5 -68’555 -49’774 -18’781 1.4
Labtax Social security contributions BSV3 -42’521 -41’919 -602 1.0
3.2 Producer behavior in the model
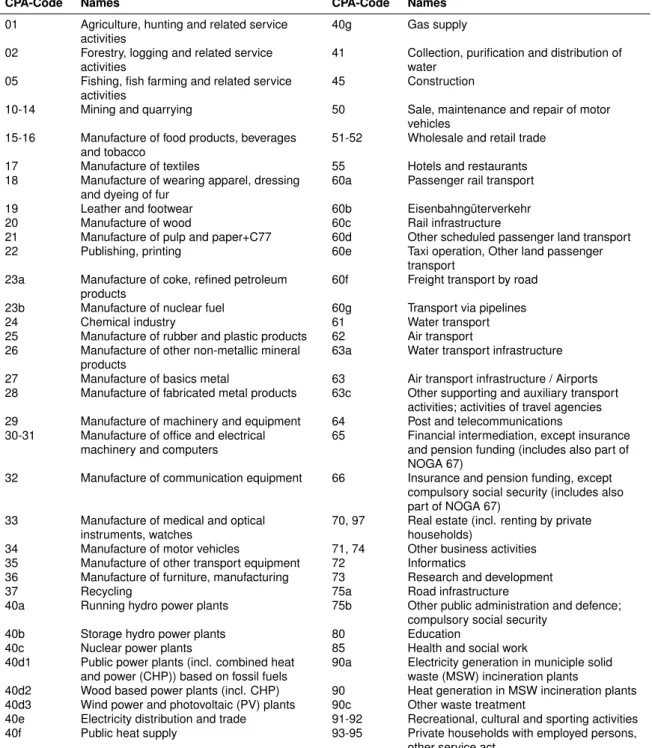
GemEl contains over 70 sectors (see Table 8) taken from the Swiss IOT-Energy. Each sector is treated in the model as a producer.
Table 8: Sectors in GemEl.
CPA-Code Names CPA-Code Names
01 Agriculture, hunting and related service activities
40g Gas supply
02 Forestry, logging and related service activities
41 Collection, purification and distribution of water
05 Fishing, fish farming and related service activities
45 Construction
10-14 Mining and quarrying 50 Sale, maintenance and repair of motor
vehicles 15-16 Manufacture of food products, beverages
and tobacco
51-52 Wholesale and retail trade
17 Manufacture of textiles 55 Hotels and restaurants
18 Manufacture of wearing apparel, dressing and dyeing of fur
60a Passenger rail transport
19 Leather and footwear 60b Eisenbahngüterverkehr
20 Manufacture of wood 60c Rail infrastructure
21 Manufacture of pulp and paper+C77 60d Other scheduled passenger land transport
22 Publishing, printing 60e Taxi operation, Other land passenger
transport 23a Manufacture of coke, refined petroleum
products
60f Freight transport by road
23b Manufacture of nuclear fuel 60g Transport via pipelines
24 Chemical industry 61 Water transport
25 Manufacture of rubber and plastic products 62 Air transport 26 Manufacture of other non-metallic mineral
products
63a Water transport infrastructure 27 Manufacture of basics metal 63 Air transport infrastructure / Airports 28 Manufacture of fabricated metal products 63c Other supporting and auxiliary transport
activities; activities of travel agencies 29 Manufacture of machinery and equipment 64 Post and telecommunications 30-31 Manufacture of office and electrical
machinery and computers
65 Financial intermediation, except insurance and pension funding (includes also part of NOGA 67)
32 Manufacture of communication equipment 66 Insurance and pension funding, except compulsory social security (includes also part of NOGA 67)
33 Manufacture of medical and optical instruments, watches
70, 97 Real estate (incl. renting by private households)
34 Manufacture of motor vehicles 71, 74 Other business activities 35 Manufacture of other transport equipment 72 Informatics
36 Manufacture of furniture, manufacturing 73 Research and development
37 Recycling 75a Road infrastructure
40a Running hydro power plants 75b Other public administration and defence;
compulsory social security
40b Storage hydro power plants 80 Education
40c Nuclear power plants 85 Health and social work
40d1 Public power plants (incl. combined heat and power (CHP)) based on fossil fuels
90a Electricity generation in municiple solid waste (MSW) incineration plants
40d2 Wood based power plants (incl. CHP) 90 Heat generation in MSW incineration plants 40d3 Wind power and photovoltaic (PV) plants 90c Other waste treatment
40e Electricity distribution and trade 91-92 Recreational, cultural and sporting activities
40f Public heat supply 93-95 Private households with employed persons,
other service act.
The behavior of each producer is given by the maximization of profits defined as valued output minus the costs of the inputs. In the case of perfect competition, the producer takes the prices of outputs
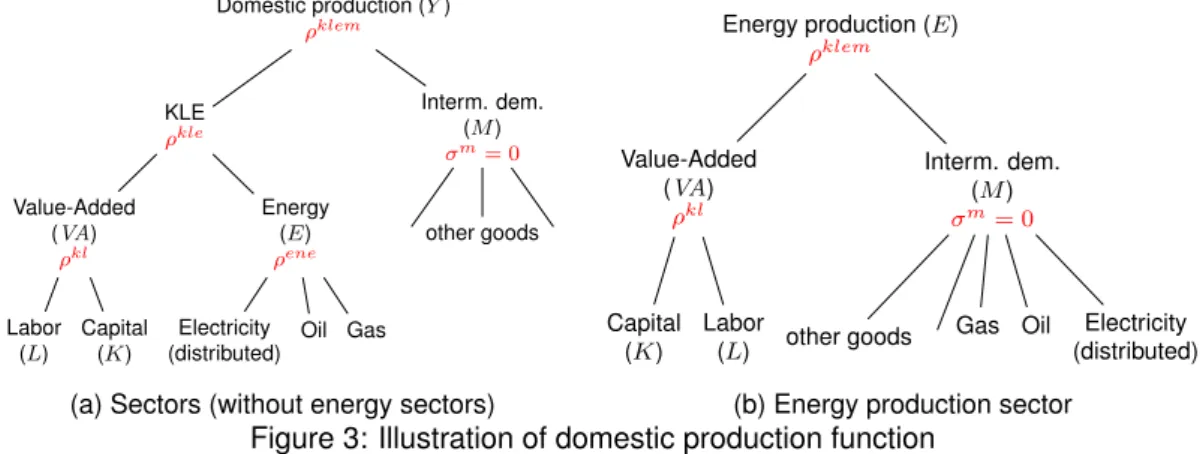
and inputs as given. The production technology is formulated as a nested CES function as shown in Figure 3. We make a distinction between non-energy and energy sectors. In the non-energy sectors, substitution between energy and value-added (capital and labor) is allowed. In the energy sectors, the input of energy fuels is treated as a complementary input to value-added and other inputs to keep inputs and outputs of energy consistent.
Domestic production (Y) ρklem
KLE ρkle
Value-Added (VA)
ρkl
Labor (L)
Capital (K)
Energy (E) ρene
Electricity (distributed)
Oil Gas
Interm. dem.
(M) σm= 0
other goods
(a) Sectors (without energy sectors)
Energy production (E) ρklem
Interm. dem.
(M) σm= 0
Electricity (distributed) Oil
other goods Gas Value-Added
(VA) ρkl
Labor (L) Capital
(K)
(b) Energy production sector Figure 3: Illustration of domestic production function
We follow van der Werf (2008) in the choice of the substitution possibilities between capital (K), labor (L), energy (E) and intermediate demand (M). He estimates and compares the substitution elasticities of six industrial sectors for several nesting structures (KE-L, KL-E, KLE) and finds the highest statistical significance for the elasticities of theKL-E-structure. The substitution elasticity in the intermediate nest (σm) is set to 0, which is common practice in applied CGE work.5
All producers maximize their profits, which is defined as the difference between their sales and costs, given their production function. The production function for the non-energy sectors can be written as:
Yi =
θikle h
θvai VAρklei + (1−θvai )ECρklei i1/ρklei ρ
klem i
+ (1−θklei )
minj Xji
ρklemi
1/ρklemi
. (5)
The description of the variables and parameters in Equations (5)-(7) can be found in Table 9.
Table 9: Variables and parameters of the production functions (5)-(7).
Variable Parameter
Yi output θklei value share of the composite of KLE
VAi value-added θvai value share of value-added
ECi energy composite ρklei subst. parameter for KLE nest
Xji intermediate demand of sectori ρklemi subst. parameter of top nest
Ki capital services θk share of capital costs inV A
Li labor ρkl subst. parameter for KL nest
Eei energy good inpute θeneei cost share of energy goode
ELEt Technologytproducing electricity ρenei subst. parameter of energy nest
and the composite good of energy inputs (EC) is defined as:
ECi=
"
X
e
θeieneEeiρene
#1/ρene
. (7)
In the stand-alone version of the model, electricity can be produced using several technologies (nuclear, hydro, solar, PV, etc.). Each technologytis modeled as a Leontief-function:
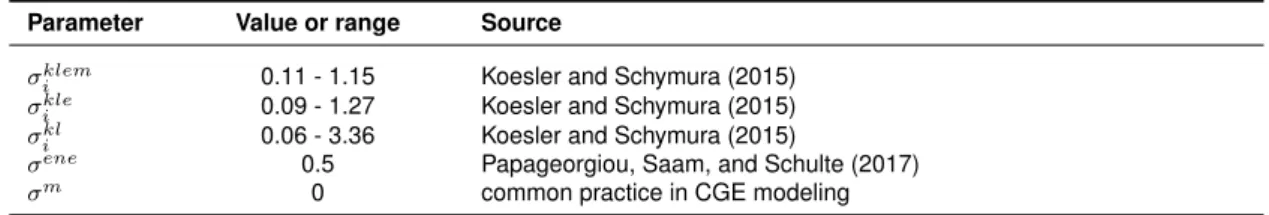
ELEt= min (Lt, Kt, Eet, Xit) (8) The produced electricity serves as input in the distribution sector. The relative costs of the technologies and the available capacity determine the production mix. Table 10 contains the values or range of the chosen sectoral elasticities.
Table 10: Domestic production and Armington elasticities.
Parameter Value or range Source
σklemi 0.11 - 1.15 Koesler and Schymura (2015) σklei 0.09 - 1.27 Koesler and Schymura (2015) σkli 0.06 - 3.36 Koesler and Schymura (2015)
σene 0.5 Papageorgiou, Saam, and Schulte (2017)
σm 0 common practice in CGE modeling
The producer behavior can now explicitly be described as the maximization of profits given the pro- duction functions as defined in Equations (5)-(8).
3.3 International trade
The original general equilibrium formulation is based on a closed economy without any flows coming in from or going out to other countries or regions. In a single-country model like GemEl, sectoral output is transformed into goods produced for the domestic market and exports (see Figure 4). Goods for the domestic market are a composite of imports and domestically produced goods, the so-called Armington good. The domestically produced good is split in domestically supplied goods and exports.
The producer maximizes its profit given the transformation function:
max Πi=PiEEXi+PiDDi−PiAAi (9) subject to the transformation technology:
h
θEi EXτi + (1−θiE)DDψii1/τi
=Yi. (10)
whereψ is the transformation elasticity. The description of the variables and parameters in Equations (9)-(13) can be found in Table 11.
Imports in the model are seen as imperfect substitutes for similar domestically produced goods to allow for cross hauling (importing and exporting the same kind of good). Armington (1969) suggested to replace the domestic consumption by an (Armington) function which converts imported and domestically produced goods into a composite good (see also Figure 4) defined as:
Ai =h
θidYiρai + (1−θiD)MiρAi1/ρai
(11)
Armington good (A)
ρa
Imported good (M) Domestically produced good
(Y)
(a) Imports
τ
Domestically produced good Y
Domestically demanded good (DD)
Exported good (EX)
(b) Exports
Figure 4: Illustration of the treatment of imports (Armington) and exports.
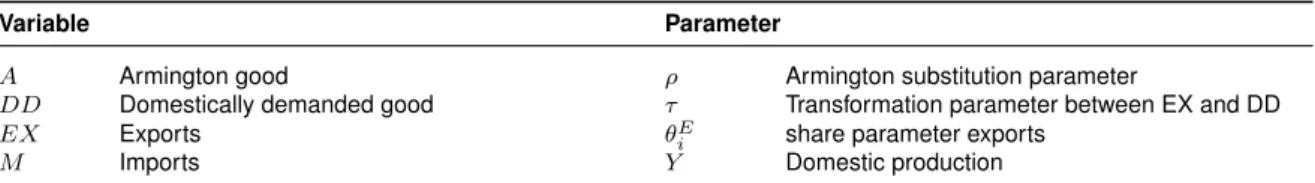
Table 11: Variables and parameters of the international trade functions.
Variable Parameter
A Armington good ρ Armington substitution parameter
DD Domestically demanded good τ Transformation parameter between EX and DD
EX Exports θEi share parameter exports
M Imports Y Domestic production
The similarity between imported and domestic goods is measured by the substitution parameterρa.6 There is no agreement in the literature on the correct value of the sectoral substitution and transformation elasticities (see, for example, Hillberry and Hummels, 2013). Table 12 contains the values or range of the chosen elasticities.
Table 12: International trade and Armington elasticities.
Parameter Value or range Source ofσAandτ
σA 1.2 - 8.0 Own calculations based on Imbs and Méjean (2010)
τ 1.3 - 8.0 and Lofgren and Cicowiez (2018)
We treat Switzerland as a small, open economy, meaning that Switzerland can not influence the world market prices for goods and services. The domestic prices (P) for exports (E) and imports (M) for each good (i) are given by:
Pie=PFX ·Pwie and Pim=PFX ·Pwim, (12) wherePFX is the exchange rate, andPwis the given world market price in foreign currency. In the last forty years, except for 1981 and 2008, Switzerland faced a current account surplus.7 We assume that the surplus is fixed leading to the following additional constraint:
X
i
Pie·EXi+CA=X
i
Pim·Mi, (13)
whereCAis the level of the current account surplus,Eiis the quantity of each exported good andMiis the quantity of each imported good.
In CGE modeling, the investments are treated as Leontief production functions that generate a ho-
3.4 Market clearing
The third set of conditions for a general equilibrium demands that supply should cover demand in each market (note that this also includes the case of excess supply resulting in a zero price). GemEl con- tains market clearing conditions for the factors (labor, capital), and produced goods (Armington good, domestically produced good, investment good).
The market-clearing conditions for the factor markets (laborLand capitalK) are given by:
X
i
Li =L−LSand X
i
Ki =K, (15)
while the market-clearing conditions for the domestically produced and the Armington goods are given by:
Yi=Di+Ei, andAi=X
j
Xij+Xic+Xiinv. (16) WhereXiC is the consumption demand for goodi, andXiinvis the demand for goodiin the investment function. Additionally, the market clearing for the investment good is given by the savings-investment equality:
S
Pinv =IN V. (17)
Lastly, the market clearing function for the utility goods of the representative agent (RA) and the govern- ment (Gov) is given by:
U =IRA
P U, andU G= IGov
P U G. (18)
3.5 The mixed-complemetarity format
GemEl is set up and solved as a MCP. Mathiesen (1985) showed that the three Arrow-Debreu conditions for a general equilibrium as discussed above can be formulated as a MCP problem. The MCP format is a special case of a variational inequality problem in which all the variables lie in the positive orthant (see Facchinei and Pang, 2003). The MCP format suits itself for solving general equilibrium models.
As Mathiesen (1985, p. 1226) writes, although the first-order optimality conditions of a mathematical programming model also satisfy a complementarity problem (CP) problem, there may be no optimiza- tion problem for a general equilibrium model that leads to this CP problem (the so-called integrability- problem, Samuelson, 1950). This can happen if, for example, the model contains several households with distinct endowments and preferences, or if there are ad-valorem taxes or constraints on prices.
A CP can be described as a system of (non-)linear constraints where the system variables are linked to the constraints with complementarity conditions (Ferris and Munson, 2014). More formally, given a functionF : Rn → Rn, lower boundsl ∈ {R∪ −∞}n and upper boundsu∈ {R∪ ∞}n, we try to find x∈Rnsuch that precisely one of the following holds for eachi∈1, . . . , n:
Fi(xi) =li and Fi(xi)≥0, or Fi(xi) =ui and Fi(xi)≤0, or li< xi< ui and Fi(xi) = 0
This means that the variablexiis at one of its bounds or the linked function is equal to zero.
In the MCP, we not only have inequalities with complementary non-negative variables but also equa- tions where the associated variables are free. The complementarity conditions can then be written as:
Fi(xi, xj)≥0, xi≥0, xiFi(x) = 0, Fj(xi, xj) = 0, xjfree,
where we partition the setninto the setsiandj.
Often the following shorthand notation is used, where the perpendicular symbol (⊥) indicates the complementarity slackness between the constraint and the variable:
0≥F(x)⊥x≥0. (19)
Complementarity models can be used for solving linear, quadratic and nonlinear programs by writing the Karush-Kuhn-Tucker optimality conditions. In the case of minimizing a functionf(x), wherex∈R+, the first-order condition is given by:
∂f
∂x ≥0, x≥0. (20)
Ifxis at its lower bound, we must have that the function is increasing inx. If we have an interior solution, the derivative must be equal to zero. Combining these two pieces of information, we get the mixed complementarity formulation:
∂f
∂x ≤0, x≥0, x∂f
∂x = 0. (21)
As the CP can often be formulated using the optimality conditions of the original problem, it is easy to write down the model equations. However, there is not always an optimization problem that corresponds to the complementarity conditions. This means that a MCP formulation allows us to solve a wider class of problems.
Complementary models have been used for expressing a variety of economic equilibrium models for both markets and games, where the underlying problem cannot be written down as a single optimization problem or if no equivalent optimization problem exists, for example, due to non-integrability conditions.8 Many examples in MCP format can be found in Ferris and Munson (2014), Rutherford (1995), and Dirkse and Ferris (1995). The development of the complementarity modeling format was motivated by theoretical and practical developments in algorithms for nonlinear CPs and variational inequalities.
The most recent techniques are based on ideas from interior-point algorithms for linear programming (Kojima et al., 1991). Computational evidence suggests that algorithms for solving MCPs are relatively reliable and efficient, particularly for models that are not natural optimization problems. A survey of developments in the theory and applications of these methods is provided by Harker and Pang (1990).
Mathiesen’s MCP version of the CGE model is formulated as a nonlinear system of (weak) inequal- ities and equalities corresponding to the three classes of equilibrium conditions associated with the Arrow-Debreu general equilibrium. The fundamental unknowns of the system are three vectors con- sisting of non-negative prices (for commodities and factors), activity levels (production and utility) and household incomes. In equilibrium, each of these variables is linked to one of the inequalities or equali- ties. The three classes are:
1. The zero-profit conditions(more precise, the non-positive profit conditions). In this class the variable complementary to the equation is the activity level: If a sector in equilibrium makes a
We use the calibrated share form of the CES function (see Rutherford (1998) and Appendix A) to write down the zero-profit condition for the utility function:
PU ≤
θcls Pinv
Pinv 1−σcls
+ (1−θcls)
"Pcls Pcls
1−σcl1 #1−σ
cls
1 1−σcls
⊥U
wherePz=
θcl Pls
Pls 1−σcl
+ (1−θcl) PC
Pc 1−σcl
andPc=
"
θc Pne
Pne 1−σc
+ (1−θc) Pe
Pe
1−σc#1−σc1
wherePne=
X
sne
θsnecne PsneA PAsne
!1−σcne
1 1−σcne
andPe=
X
e
θece PeA PAe
!1−σce
1/1−σce
(22)
Table 13 contains the description of variables and parameters not mentioned before.
Table 13: Variables and parameters of the zero-profit condition.
Variable Parameter
Y output θkle value share of the composite of KLE
VA value-added θva value share of value-added
EC energy composite ρkle subst. parameter for KLE nest
Xi intermediate demand of sectori ρklem subst. parameter of top nest
K capital services θk share of capital costs inV A
L labor ρkl subst. parameter for KL nest
Ee energy goode θenee cost share of energy goode
ELEt Technologytproducing electricity ρene subst. parameter of energy nest
Using the calibrated share form, it is straightforward to write down the other zero-profit conditions.
We refrain from writing down these equations in the extensive form and use a condensed form.
The zero-profit function for the government utility, the domestic non-energy and energy sectors, the Armington sectors as well as the investment sector is given by:
Government utility: −ΠG≥0⊥U G (23)
Non-energy domestic production: −ΠDne≥0⊥Yne (24)
Energy domestic production: −ΠDe ≥0⊥Ye (25)
Armington sector: −ΠAi ≥0⊥Ai (26)
Investment sector: −Πinvi ≥0⊥IN Vi. (27)
2. Themarket clearing conditions. These equations are complementary with the prices: Supply minus demand for every commodity should be non-negative. In equilibrium, a positive supply means that the complementary price is zero (the case of a free good); if supply is equal to demand, a positive equilibrium price will be the result. The market clearing conditions can be derived using Shephard’s lemma. This lemma states that the conditional demand for an input in production is