Research Collection
Report
Nexus-e: DistIv Module Documentation
Author(s):
Han, Xuejiao; Hug, Gabriela Publication Date:
2020-11-27 Permanent Link:
https://doi.org/10.3929/ethz-b-000471890
Rights / License:
In Copyright - Non-Commercial Use Permitted
This page was generated automatically upon download from the ETH Zurich Research Collection. For more information please consult the Terms of use.
Department of the Environment,
Transport, Energy and Communication DETEC Swiss Federal Office of Energy SFOE Energy Research and Cleantech
Final report
Nexus-e: Integrated Energy Systems Modeling Platform
DistIv Module Documentation
Source:ESC 2019
2/44
Date: 30. November 2020 Location: Bern
Publisher:
Swiss Federal Office of Energy SFOE Energy Research and Cleantech CH-3003 Bern
www.bfe.admin.ch Subsidy recipients:
ETH Zürich
Power Systems Laboratory Physikstrasse 3, CH-8092, Zürich www.psl.ee.ethz.ch
Authors:
Xuejiao Han, Power Systems Laboratory - ETH Zürich, xuhan@ethz.ch
Prof. Gabriela Hug, Power Systems Laboratory - ETH Zürich, hug@eeh.ee.ethz.ch
SFOE project coordinators:
SFOE head of domain: Yasmine Calisesi, yasmine.calisesi@bfe.admin.ch
SFOE programme manager: Anne-Kathrin Faust, anne-kathrin.faust@bfe.admin.ch SFOE contract number:SI/501460-01
The authors bear the entire responsibility for the content of this report and for the conclusions drawn therefrom.
Summary
Policy changes in the energy sector result in wide-ranging implications throughout the entire energy system and influence all sectors of the economy. Due partly to the high complexity of combining separate models, few attempts have been undertaken to model the interactions between the components of the energy-economic system. The Nexus-e Integrated Energy Systems Modeling Platform aims to fill this gap by providing an interdisciplinary framework of modules that are linked through well-defined interfaces to holistically analyze and understand the impacts of future developments in the energy system. This platform combines bottom-up and top-down energy modeling approaches to represent a much broader scope of the energy-economic system than traditional stand-alone modeling approaches.
In Phase 1 of this project, the objective is to develop a novel tool for the analysis of the Swiss electricity system. This study illustrates the capabilities of Nexus-e in answering the crucial questions of how centralized and distributed flexibility technologies could be deployed in the Swiss electricity system and how they would impact the traditional operation of the system. The aim of the analysis is not policy advice, as some critical developments like the European net-zero emissions goal are not yet included in the scenarios, but rather to illustrate the unique capabilities of the Nexus-e modeling framework.
To answer these questions, consistent technical representations of a wide spectrum of current and novel energy supply, demand, and storage technologies are needed as well as a thorough economic evaluation of different investment incentives and the impact investments have on the wider economy.
Moreover, these aspects need to be combined with modeling of the long- and short-term electricity market structures and electricity networks. This report illustrates the capabilities of the Nexus-e platform.
The Nexus-e Platform consists of five interlinked modules:
1. General Equilibrium Module for Electricity (GemEl): a computable general equilibrium (CGE) mod- ule of the Swiss economy,
2. Centralized Investments Module (CentIv): a grid-constrained generation expansion planning (GEP) module considering system flexibility requirements,
3. Distributed Investments Module (DistIv): a GEP module of distributed energy resources,
4. Electricity Market Module (eMark): a market-based dispatch module for determining generator production schedules and electricity market prices,
5. Network Security and Expansion Module (Cascades): a power system security assessment and transmission system expansion planning module.
This report describes the validation and calibration of the different modules within the Nexus-e frame- work. The objectives of the validation and the calibration of the Nexus-e modules is to develop trustwor- thy and high-fidelity modules as well as to adjust the modules to better represent the complexity of the involved real systems and processes.
Zusammenfassung
Politische Veränderungen im Energiesektor haben weitreichende Auswirkungen auf das gesamte En- ergiesystem und beeinflussen alle Sektoren der Wirtschaft. Aufgrund der hohen Komplexität der En- ergiewirtschaft, wurden bisher nur wenige Versuche unternommen, die Wechselwirkungen zwischen den einzelnen Komponenten dieses Systems zu modellieren. Nexus-e, eine Plattform für die Model- lierung von integrierten Energiesystemen, schliesst diese Lücke und schafft einen interdisziplinäre Plat- tform, in welcher verschiedene Module über klar definierten Schnittstellen miteinander verbunden sind.
Dadurch können die Auswirkungen zukünftiger Entwicklungen in der Energiewirtschaft ganzheitlicher analysiert und verstanden werden. Die Nexus-e Plattform ermöglicht die Kombination von „Bottom- Up“ und „Top-Down“ Energiemodellen und ermöglicht es dadurch, einen breiteren Bereich der En- ergiewirtschaft abzubilden als dies bei traditionellen Modellierungsansätzen der Fall ist.
Phase 1 dieses Projekts zielt darauf ab, ein neuartiges Instrument für die Analyse des schweiz- erischen Elektrizitätssystems zu entwickeln. Um die Möglichkeiten von Nexus-e zu veranschaulichen, untersuchen wir die Frage, wie zentrale und dezentrale Flexibilitätstechnologien im schweizerischen Elektrizitätssystem eingesetzt werden können und wie sie sich auf den traditionellen Betrieb des En- ergiesystems auswirken würden. Ziel der Analyse ist es nicht Empfehlungen für die Politik zu geben, da einige wichtige Entwicklungen wie das Europäische Netto-Null-Emissionsziel noch nicht in den Szenar- ien enthalten sind. Vielmehr möchten wir die einzigartigen Fähigkeiten der Modellierungsplattform Nexus-e vorstellen. Um diese Fragen zu beantworten, ist eine konsistente technische Darstellun- gen aktueller und neuartiger Energieversorgungs-, Nachfrage- und Speichertechnologien, sowie eine gründliche wirtschaftliche Bewertung der verschiedenen Investitionsanreize und der Auswirkungen der Investitionen auf die Gesamtwirtschaft erforderlich. Darüber hinaus müssen diese Aspekte mit der Mod- ellierung der lang- und kurzfristigen Strommarktstrukturen und Stromnetze kombiniert werden. Dieser Report veranschaulicht die Fähigkeiten der Nexus-e Plattform.
Die Nexus-e Plattform besteht aus fünf miteinander verknüpften Modulen:
1. Allgemeines Gleichgewichtsmodul für Elektrizität (GemEl): ein Modul zur Darstellung des allge- meinen Gleichgewichts (CGE) der Schweizer Wirtschaft,
2. Investitionsmodul für zentrale Energiesysteme (CentIv): ein Modul zur Planung des netzgebunde- nen Erzeugungsausbaus (GEP) unter Berücksichtigung der Anforderungen an die Systemflexibil- ität,
3. Investitionsmodul für dezentrale Energiesysteme (DistIv): ein GEP-Modul für dezentrale Energieer- zeugung,
4. Strommarktmodul (eMark): ein marktorientiertes Dispatch-Modul zur Bestimmung von Generator- Produktionsplänen und Strommarktpreisen,
5. Netzsicherheits- und Erweiterungsmodul (Cascades): ein Modul zur Bewertung der Sicherheit des Energiesystems und zur Planung der Erweiterung des Übertragungsnetzes.
Dieser Bericht beschreibt die Validierung und Kalibrierung der verschiedenen Module im Rahmen von Nexus-e. Das Ziel der Validierung und Kalibrierung ist es, vertrauenswürdige und originalgetreue Module zu entwickeln und diese so anzupassen, dass sie die Komplexität der beteiligten realen Systeme und Prozesse besser repräsentieren.
Résumé
Les changements de politique dans le secteur de l’énergie ont de vastes répercussions sur l’ensemble du système énergétique et influencent tous les secteurs de l’économie. En partie à cause de la grande complexité de la combinaison de modèles séparés, peu de tentatives ont été entreprises pour modéliser les interactions entre les composantes du système économico-énergétique. La plateforme de modélisa- tion des systèmes énergétiques intégrés Nexus-e vise à combler cette lacune en fournissant un cadre interdisciplinaire de modules qui sont reliés par des interfaces bien définies pour analyser et compren- dre de manière holistique l’impact des développements futurs du système énergétique. Cette plateforme combine des approches de modélisation énergétique ascendante et descendante pour représenter un champ d’application beaucoup plus large du système économico-énergétique que les approches de modélisation indépendantes traditionnelles.
Dans la phase 1 de ce projet, l’objectif est de développer un nouvel outil pour l’analyse du sys- tème électrique suisse. Cette étude sert à illustrer les capabilités de Nexus-e à répondre aux questions cruciales de comment les technologies de flexibilité centralisées et décentralisées pourraient être dé- ployées dans le système électrique suisse et comment elles affecteraient le fonctionnement traditionnel du système. Le but de cette analyse n’est pas d’offrir de conseils politiques, en tant que les scénarios ne considèrent pas des développements critiques comme l’objectif Européen d’atteindre zéro émission nette, mais d’illustrer les capabilités uniques de la plateforme Nexus. Pour répondre à ces questions, des représentations techniques cohérentes d’un large éventail de technologies actuelles et nouvelles d’approvisionnement, de demande et de stockage d’énergie sont nécessaires, ainsi qu’une évaluation économique approfondie des différentes incitations à l’investissement et de l’impact des investissements sur l’économie au sens large. En outre, ces aspects doivent être combinés avec la modélisation des structures du marché de l’électricité et des réseaux d’électricité à long et à court terme. Ce rapport illustre les capacités de la plateforme Nexus-e.
La plateforme Nexus-e se compose de cinq modules interconnectés:
1. Module d’équilibre général pour l’électricité (GemEl) : un module d’équilibre général calculable (CGE) de l’économie suisse,
2. Module d’investissements centralisés (CentIv) : un module de planification de l’expansion de la production (GEP) soumise aux contraintes du réseau, qui tient compte des exigences de flexibilité du système,
3. Module d’investissements distribués (DistIv) : un module GEP de la production décentralisée d’énergie,
4. Module du marché de l’électricité (eMark) : un module de répartition basé sur le marché pour déterminer les calendriers de production des producteurs et les prix du marché de l’électricité, 5. Module de sécurité et d’expansion du réseau (Cascades) : un module d’évaluation de la sécurité
du système électrique et de planification de l’expansion du système de transmission.
Ce rapport décrit la validation et la calibration des différents modules dans le cadre de Nexus-e.
L’objectif de la validation et de la calibration des modules Nexus-e est de gagner en confiance dans les modules ainsi que d’ajuster les modules pour mieux représenter la complexité des systèmes et des processus réels concernés.
Contents
Summary. . . 3
Zusammenfassung . . . 4
Résumé . . . 5
Contents . . . 7
Abbreviations . . . 8
1 Introduction . . . 9
1.1 Module purpose . . . 9
1.2 Process overview . . . 9
1.3 Attributes . . . 9
1.4 Capabilities . . . 9
1.5 Limitations . . . 10
1.6 Inputs and outputs . . . 10
2 Related work and contributions . . . 11
3 Detailed module description . . . 12
3.1 Problem description . . . 12
3.2 Mathematical formulation . . . 12
4 Representation of flexibility . . . 23
4.1 Flexibility requirement . . . 23
4.2 Flexibility provision . . . 23
5 Description of interfaces . . . 24
5.1 DistIv-CentIv interface . . . 25
5.2 CentIv-DistIv Interface . . . 25
5.3 DistIv-GemEl interface . . . 26
6 Demonstration of results . . . 27
6.1 Input data . . . 27
6.2 Results . . . 31
7 Publications . . . 39
8 References . . . 40
Appendices . . . 42
A Grid tariff . . . 42
B PV injection tariff . . . 43 C Wholesale-to-retail price margin . . . 44
List of Figures
1 Structure of one sample aggregator. . . 12
2 Structure of the PV system. . . 17
3 Illustration of Nexus-e platform . . . 24
4 Regional PV investment potential . . . 28
5 PV investment potential for different categories . . . 28
6 PV Investment per region . . . 32
7 PV investments for each simulation period . . . 33
8 Electricity generation . . . 34
9 Monthly electricity generation . . . 34
10 Hourly dispatch of PV system in 2020 . . . 36
11 Hourly dispatch of PV system in 2050 . . . 37
12 Hourly demand response (DR) and PV-battery dispatch of PV system . . . 38
List of Tables
1 DistIv input data list . . . 102 DistIv output data list . . . 10
3 Interface data DistIv-CentIv . . . 25
4 Interface data CentIv-DistIv . . . 26
5 DistIv-GemEl interface data . . . 26
6 Parameters for candidate units . . . 27
7 Future investment and operational costs . . . 28
8 Parameters of storage units . . . 29
9 Total investments over years . . . 31
10 Grid tariff . . . 42
11 PV injection tariff . . . 43
12 Wholesale-to-retail price margin . . . 44
1 Introduction
1.1 Module purpose
The Distributed Investments Module aims to jointly optimize the investments and operations of a distri- bution system to satisfy the demand and policy targets while minimizing total costs, considering potential trading of energy and reserve with the transmission system. The components considered in the distri- bution system include distributed energy resources such as storage units, demand response programs, variable and dispatchable generation units.
1.2 Process overview
The Distributed Investments Module (DistIv) module optimizes the investment decisions of distributed energy resources over a one year period using an hourly resolution. Given the electricity prices from Centralized Investments Module (CentIv), the model makes the trade-off between investing in local dis- tributed energy resources and purchasing electricity from the transmission grid. The trade-off is realized by jointly optimizing the investments and operations of a distribution system considering different types of storage units, variable and dispatchable generation units and demand response programs, while tak- ing the exchange with the transmission system into consideration. To reduce the computational time, every other day instead of all hours of the year is simulated.
1.3 Attributes
The following list characterizes some of the main module attributes:
• Hourly resolution;
• Computation time reduced by simulating every x days (e.g. x = 2 means that 183 instead 365 days are considered for the simulation);
• Co-optimization of multiple regions;
• Modeled market structure consists of both energy and reserve markets;
• Investment potentials of photovoltaic (PV) are considered for different PV sizes, cantons, and irra- diation levels;
• A green-field investment is modeled, i.e. no existing units considered in the distribution system.
1.4 Capabilities
The following list describes some of the main capabilities of this module:
• Co-optimization of the investment decisions of multiple regions while satisfying a common renew- able energy target;
• Optimization of the investment decisions of different distributed energy resources considering their participation in both energy and reserve markets;
• Modeling of demand response programs;
• Incorporation of PV-battery and demand response into the modeling of PV self-consumption rate;
1.5 Limitations
The following list provides some of the main limitations of this module:
• Distribution grid is not considered;
• Simple reserve bidding model (no differentiation between different reserve products, reserve de- ployment not considered);
• Electric vehicles are not considered;
1.6 Inputs and outputs
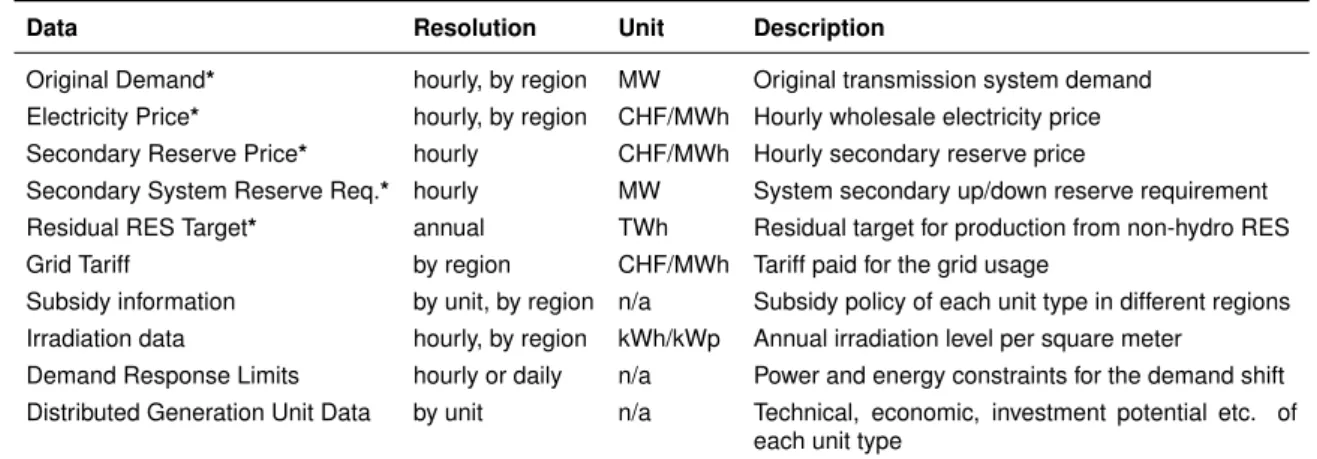
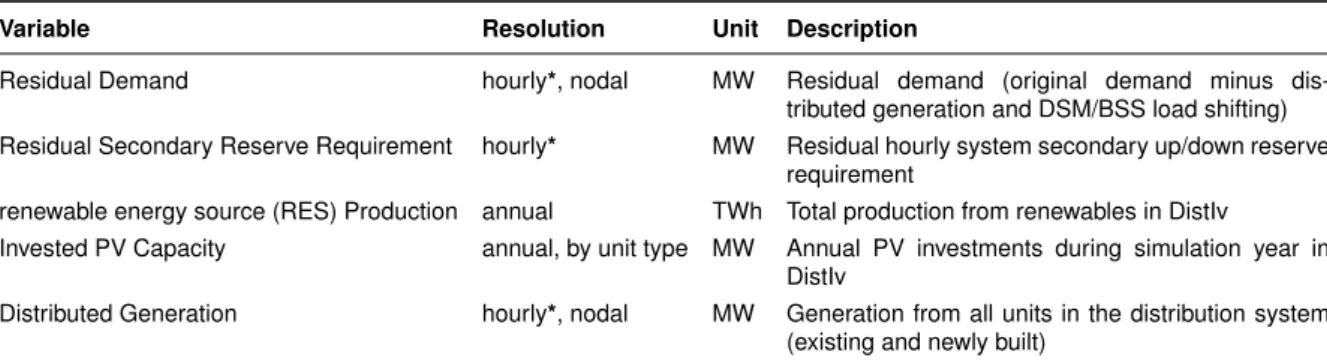
Tables 1 and 2 below list the required input of the DistIv module and resulting output data. Those data that are input from or sent to another module through an interface are noted with an asterisk (*).
Table 1: Listing of required input data for DistIv module.
Data Resolution Unit Description
Original Demand* hourly, by region MW Original transmission system demand Electricity Price* hourly, by region CHF/MWh Hourly wholesale electricity price Secondary Reserve Price* hourly CHF/MWh Hourly secondary reserve price
Secondary System Reserve Req.* hourly MW System secondary up/down reserve requirement Residual RES Target* annual TWh Residual target for production from non-hydro RES Grid Tariff by region CHF/MWh Tariff paid for the grid usage
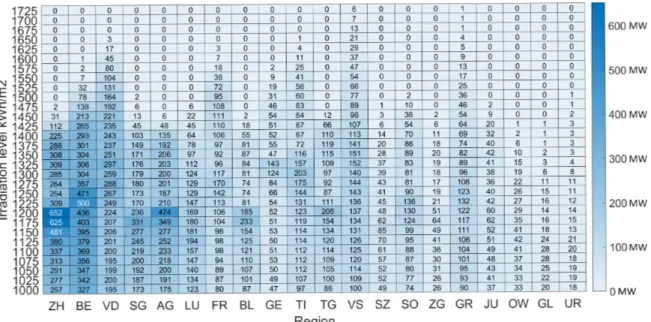
Subsidy information by unit, by region n/a Subsidy policy of each unit type in different regions Irradiation data hourly, by region kWh/kWp Annual irradiation level per square meter
Demand Response Limits hourly or daily n/a Power and energy constraints for the demand shift Distributed Generation Unit Data by unit n/a Technical, economic, investment potential etc. of
each unit type
Table 2: Listing of resulting output data for DistIv module.
Data Resolution Unit Description
Residual Demand* hourly, by region MW Residual demand (original demand minus dis- tributed generation and demand-side management (DSM)/battery storage system (BSS) load shifting) DistIv Generation* hourly, by region MW Generation from units in the distribution system Residual Secondary System Reserve Req.* hourly MW Residual hourly system secondary up/down reserve
requirement
RES Generation* annual TWh Total renewable generation in DistIv
Non-dispatchable Distributed Capacity* annual, by unit MW Accumulated non-dispatchable investments per technology in DistIv
Costs of Existing and Invested Units* annual, by unit CHF Investment and operating costs of each unit type Investment by unit, by region MW Regional investment capacity decisions for each unit
type
Demand Response Dispatch hourly, by region MW Hourly dispatch of demand shifting
2 Related work and contributions
While a significant amount of work has been done in terms of investment planning in the past, tradi- tional distribution planning models mainly focus on optimizing network topology, the size of dispatchable generation units, the size of substations, feeders and/or transformers, e.g. [1] and [2]. With the increas- ing penetration of distributed resources such as storage devices, PV and wind generation and demand response (DR) programs in recent years, modern models are more complex and focus on one or the co- ordinated planning of several distributed energy resources (DER) technologies. For example, [3] and [4]
investigated the effects of electric vehicles’ penetrations. References [5] and [6] focus on the integration of demand response programs, while [7] and [8] consider the incorporation of both demand response programs and storage investments. In [9, 10, 11], approaches for planning and operating renewable energies and storage devices are proposed whereas in [12] a planning method to decide on optimal locations, sizes and mix of both dispatchable and intermittent distributed generation is presented, with renewable outputs’ uncertainties incorporated using robust optimization. The authors of [13] proposed a method that considers a comprehensive configuration of microgrids with demand-side management, but the candidate technologies are limited to solar, wind and battery. As a result, most of the exist- ing models only target the optimization of investment decisions considering limited options of candidate technologies and without considering their participation in electricity markets. However, because of the uncertain nature of variable generation outputs, it is important to consider the coordination of different units already in the planning phase to support their integration. Furthermore, as DERs are expected to participate in markets in the future and contribute flexibility, it is important to consider their market participation to exploit the economic value of DER investments. Note that DERs are assumed to be price-takers since the market exchange is limited by the transmission capacity between the distribution and the transmission system.
As mentioned earlier, the focus of this work is on joint investment and operation optimization of DERs, considering their participation in both energy and reserve markets.
Consequently, the contributions of this work are:
1. To propose a multi-stage programming model that jointly optimizes the investments and operations of a distribution system considering different types of storage units, variable and dispatchable generation units and demand response programs.
2. To model the market environment and analyze its impact on investment and operation decisions.
3. To validate the model using Swiss data.
4. To analyze the effects of demand response program participation.
5. To construct a detailed PV investment decision-making model by considering investment behaviors of different PV unit categories, irradiation levels and regions.
6. To integrate the PV-battery and the demand response into the modeling of the self-consumption of PV.
7. To consider the trade-off between investing in distributed energy resources and purchasing elec- tricity from the transmission system.
3 Detailed module description
3.1 Problem description
In this document, questions concerning the optimal distributed generation mix for a distribution system are addressed, considering DERs’ participation in reserve and energy markets. The target country (Switzerland) is split into different regions and each region is considered as an aggregator. The aggre- gator which can also be a distribution system operator, is modeled as a cluster of storage devices, loads, dispatchable and variable generation units.
The structure of the proposed multi-stage optimization model is set up as follows:
• 1st stage: The aggregator optimizes the investment decisions for the examined year (i.e. how much should be invested into each type of units) taking constraints such as the available resource potential and the previous investments into consideration.
• 2nd stage: The short-term operation stage consists of two periods, corresponding to two markets:
reserve and energy markets. Following a realistic market structure, the aggregator first decides its bids into the reserve market and then to the energy market.
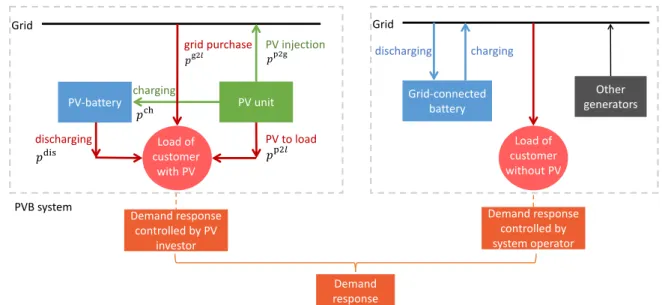
The objective is to minimize the combined costs of all stages. The structure of a sample aggregator is shown in Fig.1. The system is split into two parts, represented by two dotted squares, while the left square indicates the PV-battery (PVB) system, the right one includes other system components that are directly connected to the grid. The arrows show the directions of the power flow.
PV-battery Grid
PV unit
PV injection
discharging PV to load
grid purchase
charging Grid-connected
battery Grid
discharging charging
Demand response Demand response
controlled by PV investor
Demand response controlled by system operator
Other generators
PVB system
Load of customer without PV 𝑝𝑝ch
𝑝𝑝p2g 𝑝𝑝g2𝑙𝑙
𝑝𝑝dis Load of 𝑝𝑝p2𝑙𝑙
customer with PV
Figure 1: Structure of one sample aggregator.
3.2 Mathematical formulation
This section describes the main mathematical formulations considered in the DistIv module. The con- sidered system is divided into regionsreg ∈ REG(in the case study corresponding to the cantons in
Switzerland). Each region is modeled as an aggregated node connected to the transmission system.
3.2.1 Constraints modeling
To optimize the investment and operation decisions, five groups of constraints are considered: 1) invest- ment constraints, 2) operation constraints 3) power balance of the system, 4) market constraints, and 5) policy constraints. The operation constraints are further split into the constraints for components inside the PV system and the components outside the PV system. All grid-connected units are assumed to par- ticipate in the energy market and all grid-connected units except variable generation units are assumed to have access to the reserve market. Note that as revenues from reserve deployment are comparably low, only the reserve commitment phase is considered in this work. Reserve provision by variable gen- eration units such as PV generation through curtailments, while omitted here, could be considered using formulations similar to other units. Network constraints are not considered in this work.
Investment constraint In yeary ∈Y, for each regionreg ∈REGthe investment capacityxinvi,reg,y,lev
in candidate unit type i ∈ I with output level lev are limited by the maximum potential capacity for deployment measured in the initial simulation year minus the investments made from the initial until the current simulation year, whereI,REGandY are the set of considered unit types, regions and years:
0≤xinvi,reg,y,lev≤depmaxi,reg,lev−
y0=y−1
X
y0=y0
xexisti,reg,y0,lev (1)
xinvi,reg,y=
lev=Nilev
X
lev=1
xinvi,reg,y,lev (2)
xexisti,reg,y=
lev=Nilev
X
lev=1
y0=y−1
X
y0=y0
xinvi,reg,y0,lev (3)
where depmaxi,reg,lev is the initial potential for deployment in region reg for output level lev in the initial simulation yeary0andxexisti,reg,y,lev is the existing capacity in the current simulation yeary. Andlevis an integer ranging from 1 toNilev whereNilev is the number of output levels for uniti. Nilev equals to one for all units except PVs, whose potentials are considered with respect to different irradiation levels and theNilevequals the number of considered irradiation levels. For simplification purposes, in the following formulations indexlevis ignored for all units except PV.
Operation constraints for units and demand outside the PV system The planned distribution sys- tem outside the PV system consists of four different categories of components, namely dispatchable generation units, variable generation units except PV, grid-connected storage units and loads (including elastic and inelastic).
Dispatchable generation unit We use Gto indicate the set of dispatchable generation unit cat- egories. The power output Pg,t,reg at time t of newly invested dispatchable generation unit type g in regionregis non-negative and limited by its invested capacity in the current yearxinvg,reg. The increase or reduction in output per unit time is limited by the maximum ramp ratexinvg,regrgmaxwherermaxg is presented
as a percentage of the capacity. Mathematically,
0≤Pg,t,reg ≤xinvg,reg (4)
0≤Pg,t,reg+RUg,t,reg−RDg,t,reg ≤xinvg,reg (5)
Pg,t,reg−Pg,t−1,reg+RUg,t,reg ≤xinvg,regrmaxg (6) Pg,t−1,reg−Pg,t,reg+RDg,t,reg ≤xinvg,regrmaxg (7) whereg ∈ G,RUg,t,reg andRDg,t,reg are up- and down-regulation capacities bidding into the reserve market. Similarly, constraints for existing dispatchable generation units are as follows:
0≤Pg,t,regexist ≤xexistg,reg (8)
0≤Pg,t,regexist +RUg,t,regexist −RDg,t,regexist ≤xexistg,reg (9) Pg,t,regexist −Pg,t−1,regexist +RUg,t,regexist ≤xexistg,regrmaxg (10) Pg,t−1,regexist −Pg,t,regexist +RDg,t,regexist ≤xexistg,regrmaxg (11) wherexexistg,regis the current existing capacity of unit typegin regionreg.
Variable generation unit (except PV) LetV denote the set of all candidate variable generation units, the power output of newly invested variable generation Pv,t,reg is non-negative and limited by the product of the generation forecasts in percentagepfv,t,reg,lev at potential levellev and the invested capacityxinvv,reg,lev. Similarly, the outputPv,t,reg,yexist 0 of existing variable generation unitvthat was invested in yeary0is non-negative and limited by the product of the generation forecasts in percentagepfv,t,reg,lev
and the capacity invested for the corresponding year, which is calculated by(xexistv,reg,y0+1,lev−xexistv,reg,y0,lev).
0≤Pv,t,reg ≤
lev=Nvlev
X
lev=1
xinvv,reg,levpfv,t,reg,lev (12)
0≤Pv,t,reg,yexist 0 ≤
lev=Nvlev
X
lev=1
(xexistv,reg,y0+1,lev−xexistv,reg,y0,lev)pfv,t,reg,lev(1−agey0βvdeg) (13)
Pv,t,regexist =
y0=y−1
X
y0=y0
Pv,t,reg,yexist 0 (14)
wherev∈V.βvdegindicates the annual degradation rate of unitvwhileagey0 is the age of the unit calcu- lated by the current simulation yearyminus the invested yeary0. The curtailment costs are assumed to be zero.
Grid-connected storage unit We denote the set of the grid-connected storage units bySand the minimum and maximum energy stored in storage unit categorysas a percentage of the capacity of the storage byEsmin andEsmax, while the maximum inflow and outflow rates of the storage are indicated by
Psch,maxandPsdis,max, respectively. This results in the following set of equations:
Esminxinvs,reg≤Es,t,reg ≤Esmaxxinvs,reg (15)
0≤Ps,t,regch ≤Psch,maxxinvs,reg (16)
0≤Ps,t,regdis ≤Psdis,maxxinvs,reg (17)
Ps,t,regch −Ps,t,regdis +RDs,t,reg≤Psch,maxxinvs,reg (18) Ps,t,regdis −Ps,t,regch +RUs,t,reg ≤Psdis,maxxinvs,reg (19)
0≤Ps,tch ≤M us,t (20)
0≤Ps,tdis ≤M(1−us,t) (21) (22) whereEs,t,reg, Ps,t,regch and Ps,t,regdis are the stored energy, inflow and outflow of the storage units at time t in region reg. us,t is a binary variable indicating charging/discharging status and M is a big value.RUs,t,regandRDs,t,regare the non-negative up- and down-reserve bidding quantities. Finally, the relationship of storage levels for two consecutive time steps is defined by
Es,t,reg=Es,t−1,reg+ηsPs,t,regch ∆t−ηs−1Ps,t,regdis ∆t−ζsEs,t−1,reg (23) whereηs and ζs are the conversion efficiency and the self-discharging rate of storage units, and ∆t
is one hour. To lower the computational burden, only limited number of days are simulated. These representative days are selected everynd days from the beginning of the simulation year and the days in between are assumed to follow the same dispatch as the latest simulated day. For example, if sim- ulations are done every two days (i.e. nd = 2), then the first day, the third day, the fifth day, etc. are simulated while the second day, the fourth day, etc. are assumed to have the same dispatch as the first day, the third, etc. Thus, additional constraints should be applied to the first hour of all simulation days except the first simulation day to take the operations of the days that are not simulated in between into consideration:
Es,T T(ii−1)+1,reg=(1−ζs)[Es,T T(ii−1),reg+ (Es,T T(ii−1),reg−Es,T T(ii−2)+1,reg (24) +ηsPs,T Tch (ii−2)+1,reg∆t−ηs−1Ps,T T(ii−2)+1,regdis )∆t(nd−1)]
+ηsPs,T Tch (ii−1)+1,reg∆t−ηs−1Ps,T T(ii−1)+1,regdis ∆t
whereT T is the total number of hours (i.e. 24) of a day. The index of each simulation day is indicated byiiwithii = 2,3, ...,dNnd
de, whereNd is the total number of days of the simulation year. Furthermore, the following constraints limit the storage levels of the first and the last hour of the days that are not simulated to be within the minimum and the maximum storage level.
Esminxinvs,reg≤(1−ζs)Es,T T(ii−1),reg+ηsPs,T T(ii−2)+1,regch ∆t−ηs−1Ps,T Tdis (ii−2)+1,reg∆t (25) Esmaxxinvs,reg≥(1−ζs)Es,T T(ii−1),reg+ηsPs,T T(ii−2)+1,regch ∆t−ηs−1Ps,T Tdis (ii−2)+1,reg∆t (26)
Esminxinvs,reg≤Es,T T(ii−1),reg+ (Es,T T(ii−1),reg−Es,T T(ii−2)+1,reg
+ηsPs,T T(ii−2)+1,regch ∆t−ηs−1Ps,T Tdis (ii−2)+1,reg∆t)(nd−1) (27) Esmaxxinvs,reg≥Es,T T(ii−1),reg+ (Es,T T(ii−1),reg−Es,T T(ii−2)+1,reg
+ηsPs,T T(ii−2)+1,regch ∆t−ηs−1Ps,T Tdis (ii−2)+1,reg∆t)(nd−1) (28)
Similarly, corresponding constraints for existing storage units are as follows:
Esminxexists,reg≤Es,t,regexist ≤Esmaxxexists,reg (29)
0≤Ps,t,regch,exist≤Psch,maxxexists,reg (30)
0≤Ps,t,regdis,exist≤Psdis,maxxexists,reg (31)
Ps,t,regch,exist−Ps,t,regdis,exist+RDs,t,regexist ≤Psch,maxxexists,reg (32) Ps,t,regdis,exist−Ps,t,regch,exist+RUs,t,regexist ≤Psdis,maxxexists,reg (33) Es,t,regexist =Es,t−1,regexist +ηsPs,t,regch,exist∆t−η−1s Ps,t,regdis,exist∆t−ζsEs,t−1,regexist (34)
0≤Ps,tch,exist≤M uexists,t (35)
0≤Ps,tdis,exist≤M(1−uexists,t ) (36)
Es,T T(ii−1)+1,regexist = (1−ζs)[Es,T T(ii−1),regexist + (Es,T T(ii−1),regexist −Eexists,T T(ii−2)+1,reg (37) +ηsPs,T T(ii−2)+1,regch,exist ∆t−ηs−1Ps,T Tdis,exist(ii−2)+1,reg)∆t(nd−1)]
+ηsPs,T T(ii−1)+1,regch,exist ∆t−ηs−1Ps,T Tdis,exist(ii−1)+1,reg∆t
Esminxexists,reg≤(1−ζs)Es,T T(ii−1),regexist +ηsPs,T T(ii−2)+1,regch,exist ∆t−ηs−1Ps,T Tdis,exist(ii−2)+1,reg∆t (38) Esmaxxexists,reg≥(1−ζs)Eexists,T T(ii−1),reg+ηsPs,T T(ii−2)+1,regch,exist ∆t−ηs−1Ps,T Tdis,exist(ii−2)+1,reg∆t (39) Esminxexists,reg≤Es,T Texist(ii−1),reg+ (Es,T Texist(ii−1),reg−Es,T Texist(ii−2)+1,reg
+ηsPs,T Tch,exist(ii−2)+1,reg∆t−ηs−1Ps,T Tdis,exist(ii−2)+1,reg∆t)(nd−1) (40) Esmaxxexists,reg≥Es,T Texist(ii−1),reg+ (Es,T Texist(ii−1),reg−Es,T Texist(ii−2)+1,reg
+ηsPs,T Tch,exist(ii−2)+1,reg∆t−ηs−1Ps,T Tdis,exist(ii−2)+1,reg∆t)(nd−1) (41) whereii∈[2,3, ...,dNnd
de].
Load For consumers without PV, as part of their load is elastic, it is assumed that they participate in the demand response program and their load shifting can be fully controlled by the system operator.
The initial estimation of the load of these consumers in regionreg isPt,regL,est,npvand their final scheduled load profile is given by
Pt,regL,sch,npv=Pt,regL,est,npv+rt,regL+,npv−rL-,npvt,reg (42) whererL+,npvt,reg andrL-,npvt,reg indicate the load increase and decrease for consumers without PV for time step tin regionreg. These values are determined based on the maximum power and energy allowed to be shifted for elastic demand of consumers without PV for each region denoted byLsh,max,npvreg andEsh,max,npvreg , respectively. Mathematically,rL+,npvt,reg andrL-,npvt,reg are limited by the following constraints:
0≤rL+,npvt,reg ≤Lsh,max,npvreg (43)
0≤rL-,npvt,reg ≤Lsh,max,npvreg (44)
rL+,npvt,reg −rt,regL-,npv+RDLt,reg≤Lsh,max,npvreg (45) rL-,npvt,reg −rL+,npvt,reg +RUt,regL ≤Lsh,max,npvreg (46)
t0+24
X
t=t0
(rt,regL+,npv+rt,regL-,npv)≤Eregsh,max,npv (47) wheret0is the starting time point for each simulation day,RUt,regL andRDLt,regare non-negative up- and down-reserve bidding quantities. Additionally, it is required that the energy consumption during each
day should not be changed:
t0+24
X
t=t0
(rt,regL+ −rL-t,reg) = 0 (48)
As mentioned, it is assumed that the load participating in the DR program can be fully controlled by the aggregator, however, as this is not true in reality, a discomfort cost is therefore considered for which the formulation is described in the next section.
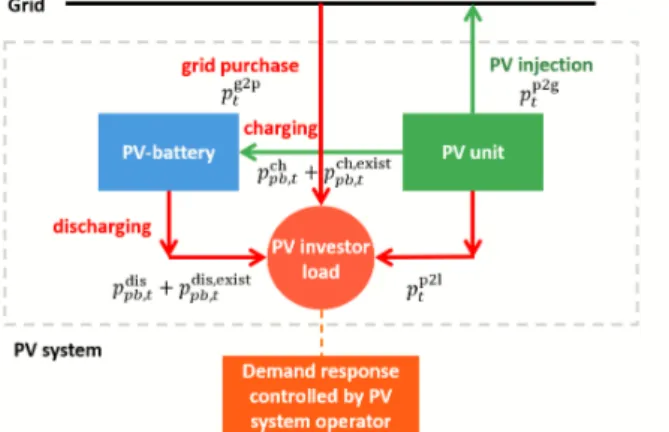
Operation constraint for the PV system The PV system shown in Fig. 2 is composed of PV units, PV-batteries and loads of the PV investor (including elastic and inelastic). Constraints for the three components are described in the following paragraphs.
Figure 2: Structure of the PV system.
PV unit LetP denote the set of all candidate PV units, as P ∈ V, constraints (12)-(14) are also applicable to PV units, i.e.
0≤Pp,t,reg≤
Nplev
X
lev=1
xinvp,reg,levpfp,t,reg,lev (49)
0≤Pp,t,reg,yexist 0≤
Nplev
X
lev=1
(xexistp,reg,y0+1,lev−xexistp,reg,y0,lev)pfp,t,reg,lev(1−agey0βdegp ) (50)
Pp,t,regexist =
y0=y−1
X
y0=y0
Pp,t,reg,yexist 0 (51)
wherep∈P.
PV-battery unit The operations of the PV-battery unit are similar to the grid-connected storage units. However, the PV-battery has no connection to the grid and in general it charges (discharges) when the demand of the PV investor is lower (higher) than the PV generation. We denote the set of the PV-battery units byP B and the minimum and maximum energy stored in storage unitpbas a percentage of the capacity of the storage byEpbminandEpbmax, while the maximum inflow and outflow rates
equations:
Eminpb xinvpb,reg≤Epb,t,reg ≤Epbmaxxinvpb,reg (52)
0≤Ppb,t,regch ≤Ppbch,maxxinvpb,reg (53)
0≤Ppb,t,regdis ≤Ppbdis,maxxinvpb,reg (54)
Ppb,t,regch −Ppb,t,regdis ≤Ppbch,maxxinvpb,reg (55) Ppb,t,regdis −Ppb,t,regch ≤Ppbdis,maxxinvpb,reg (56)
0≤Ppb,tch ≤M upb,t (57)
0≤Ppb,tdis ≤M(1−upb,t) (58) (59) whereEpb,t,reg,Ppb,t,regch andPpb,t,regdis are the stored energy, inflow and outflow of the PV-battery unitpb at timet in regionreg. upb,t is a binary variable indicating charging/discharging status and M is a big value. Finally, the relationship of storage levels for two consecutive time steps is defined by
Epb,t,reg =Epb,t−1,reg+ηpbPpb,t,regch ∆t−η−1pb Ppb,t,regdis ∆t−ζpbEpb,t−1,reg (60) whereηpbandζpbare the conversion efficiency and the self-discharging rate of the PV-batterypb.
When limited number of days are simulated, additional constraints are applied to the first hour of all simulation days except the first day to consider the dispatch of the days in between that are not simulated:
Epb,T T(ii−1)+1,reg=(1−ζpb)[Epb,T T(ii−1),reg+ (Epb,T T(ii−1),reg−Epb,T T(ii−2)+1,reg (61) +ηpbPpb,T Tch (ii−2)+1,reg∆t−ηpb−1Ppb,T Tdis (ii−2)+1,reg∆t)(nd−1)]
+ηpbPpb,T Tch (ii−1)+1,reg∆t−ηpb−1Ppb,T Tdis (ii−1)+1,reg∆t
whereii ∈ [2,3, ...,dNnd
de]. The storage levels of the first and the last hour of the days that are not simulated are limited to be within the minimum and the maximum storage level by constraints (62)-(65).
Epbminxinvpb,reg ≤(1−ζpb)Epb,T T(ii−1),reg+ηpbPpb,T Tch (ii−2)+1,reg∆t−ηpb−1Ppb,T Tdis (ii−2)+1,reg∆t (62) Epbmaxxinvpb,reg ≥(1−ζpb)Epb,T T(ii−1),reg+ηpbPpb,T Tch (ii−2)+1,reg∆t−ηpb−1Ppb,T Tdis (ii−2)+1,reg∆t (63)
Epbminxinvpb,reg ≤Epb,T T(ii−1),reg+ (Epb,T T(ii−1),reg−Epb,T T(ii−2)+1,reg
+ηpbPpb,T T(ii−2)+1,regch ∆t−η−1pbPpb,T T(ii−2)+1,regdis ∆t)(nd−1) (64) Epbmaxxinvpb,reg ≥Epb,T T(ii−1),reg+ (Epb,T T(ii−1),reg−Epb,T T(ii−2)+1,reg
+ηpbPpb,T T(ii−2)+1,regch ∆t−η−1pbPpb,T T(ii−2)+1,regdis ∆t)(nd−1) (65)
The corresponding constraints for existing PV-batteries are as follows:
Epbminxexistpb,reg ≤Eexistpb,t,reg≤Epbmaxxexistpb,reg (66)
0≤Ppb,t,regch,exist ≤Ppbch,maxxexistpb,reg (67)
0≤Ppb,t,regdis,exist ≤Ppbdis,maxxexistpb,reg (68)
Ppb,t,regch,exist −Ppb,t,regdis,exist ≤Ppbch,maxxexistpb,reg (69)
Ppb,t,regdis,exist −Ppb,t,regch,exist ≤Ppbdis,maxxexistpb,reg (70)
Epb,t,regexist =Eexistpb,t−1,reg+ηsPpb,t,regch,exist∆t−ηs−1Ppb,t,regdis,exist∆t−ζsEexistpb,t−1,reg (71)
0≤Ppb,tch,exist≤M uexistpb,t (72)
0≤Ppb,tdis,exist≤M(1−uexistpb,t) (73)
Epb,T T(ii−1)+1,regexist = (1−ζpb)[Epb,T T(ii−1),regexist + (Epb,T Texist (ii−1),reg−Epb,T T(ii−2)+1,regexist (74) +ηpbPpb,T T(ii−2)+1,regch,exist ∆t−ηpb−1Ppb,T Tdis,exist(ii−2)+1,reg∆t)(nd−1)]
+ηpbPpb,T T(ii−1)+1,regch,exist ∆t−ηpb−1Ppb,T Tdis,exist(ii−1)+1,reg∆t
Epbminxexistpb,reg ≤(1−ζpb)Eexistpb,T T(ii−1),reg+ηpbPpb,T Tch,exist(ii−2)+1,reg∆t−ηpb−1Ppb,T T(ii−2)+1,regdis,exist ∆t (75) Epbmaxxexistpb,reg ≥(1−ζpb)Epb,T Texist (ii−1),reg+ηpbPpb,T Tch,exist(ii−2)+1,reg∆t−ηpb−1Ppb,T T(ii−2)+1,regdis,exist ∆t (76) Epbminxexistpb,reg ≤Eexistpb,T T(ii−1),reg+ (Epb,T T(ii−1),regexist −Epb,T T(ii−2)+1,regexist
+ηpbPpb,T Tch,exist(ii−2)+1,reg∆t−ηpb−1Ppb,T Tdis,exist(ii−2)+1,reg∆t)(nd−1) (77) Epbmaxxexistpb,reg ≥Epb,T Texist (ii−1),reg+ (Epb,T T(ii−1),regexist −Epb,T T(ii−2)+1,regexist
+ηpbPpb,T Tch,exist(ii−2)+1,reg∆t−ηpb−1Ppb,T Tdis,exist(ii−2)+1,reg∆t)(nd−1) (78)
Load For consumers with PV units, as it is more profitable for them to use the demand flexibility to increase the self-consumption rate of the PV, it is assumed that their elastic load is fully controlled by themselves and serves for improving the self-consumption rate of PV. The initial estimation of the load of consumers with PV installation in regionregisPt,regL,est,pvand the final scheduled load profile is given by Pt,regL,sch,pv=Pt,regL,est,pv+rt,regL+,pv−rt,regL-,pv (79) wherert,regL+,pvand rt,regL-,pv indicate the load increase and decrease for consumers with PV for time stept in regionreg. These values are determined based on the maximum power and energy allowed to be shifted for elastic demand of consumers with PV for each region denoted byLsh,max,pvreg andEregsh,max,pv, respectively. Mathematically,rL+,pvt,reg andrt,regL-,pv are limited by the following constraints:
0≤rt,regL+,pv≤Lsh,max,pvreg (80)
0≤rt,regL-,pv ≤Lsh,max,pvreg (81)
t0+24
X
t=t0
(rL+,pvt,reg+rL-,pvt,reg)≤Eregsh,max,pv (82) wheret0 is the starting time point for each simulation day. Additionally, it is required that the energy consumption during each day should not be changed:
t0+24
It is assumed that the load participating in the DR program can be fully controlled by the aggregator, however, as this is not true in reality, a discomfort cost is therefore considered for which the formulation is described in the next section.
Two kinds of power balance constraints including one for the PVB system and one for the overall region are enforced.
Power balance of the PV system As shown in Fig. 1, for the PVB system, the PV generation can be used for satisfying the loadPp2l, grid injectionPp2g or charging the PV-battery. Similarly, the PVB system’s load (i.e. load of consumers with PV) can be met by the PV generation, the electricity from the gridPg2lor the PV-battery discharge. Mathematically, Mathematically,
Pp,t,reg+Pp,t,regexist ≥Pp,t,regp2l +Pp,t,regp2g +Ppb,t,regch +Ppb,t,regch,exist (84) Pp,t,regL,sch,pv≤Pp,t,regp2l +Pp,t,regg2l +Ppb,t,regdis +Ppb,t,regdis,exist (85) Pp,t,regselfcon =Pp,t,regp2l +Ppb,t,regdis +Ppb,t,regdis,exist (86)
Pp,t,regg2l , Pp,t,regp2g , Pp,t,regp2l ≥0 (87)
wherePp,t,regselfcon denotes the self-consumed PV generation. Note that four PV-battery types each associ- ated with one of the four PV size categories are considered to reflect the different economic trade-offs (e.g. electricity tariffs) faced and the investments made by the investors of different sizes of PV.
Power Balance constraint of the system For the distribution system in each region, at each time step, the sum of the net electricity generation (i.e. generation minus consumption) must be equal to the electricity exchange with the transmission systemPDA, i.e.
X
g∈G
(Pg,t,reg+Pg,t,regexist )+ X
v∈V\P
(Pv,t,reg+Pv,t,regexist )+X
s∈S
(Ps,t,regdis +Ps,t,regdis,exist−Ps,t,regch −Ps,t,regch,exist)−Pt,regL,sch,npv
+X
p∈P
(Pp,t,regp2g −Pp,t,regg2l ) =Pt,regDA (88)
where the first line includes all devices and consumers except for consumers with PV or PVB systems which are included using their interaction with the grid in the second line. The exchange with the grid PDAis positive when selling to and negative when purchasing from the transmission grid.
Market constraint As distribution transformers are rarely fully loaded in reality for security reasons, the power that is exchanged between the distribution and the transmission system considering the reserve provision is set to be limited by the transformer capacity, which is estimated by the regional peak demand PregL,max multiplied by a factorγexthat is greater than one, i.e.
Pt,regDAs +Pt,regRMu ≤γexPregL,max (89)
Pt,regDAb +Pt,regRMd ≤γexPregL,max (90)
Pt,regDA =Pt,regDAs −Pt,regDAb (91)
Pt,regRMu =X
g∈G
(RUg,t,reg+RUg,t,regexist )+X
s∈S
(RUs,t,reg+RUs,t,regexist )+RUt,regL (92) Pt,regRMd =X
g∈G
(RDg,t,reg+RDexistg,t,reg)+X
s∈S
(RDs,t,reg+RDs,t,regexist )+RDLt,reg (93)
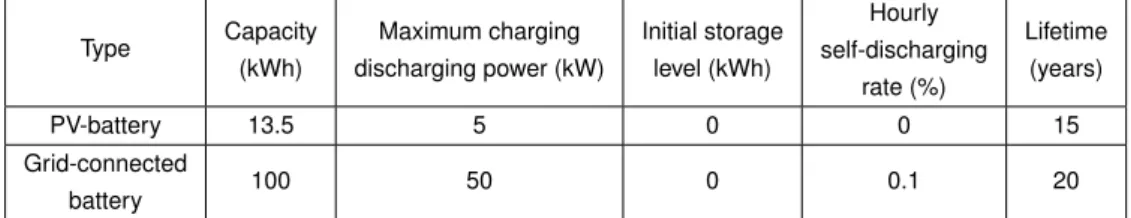
![Table 6 summarizes the parameters used in DistIv based on the data in [14] (except for batteries)](https://thumb-eu.123doks.com/thumbv2/1library_info/4424588.1584395/28.892.135.808.393.666/table-summarizes-parameters-used-distiv-based-data-batteries.webp)