Research Collection
Report
Nexus-e: CentIv Module Documentation
Author(s):
Raycheva, Elena; Schaffner, Christian; Hug, Gabriela Publication Date:
2020-11-27 Permanent Link:
https://doi.org/10.3929/ethz-b-000471885
Rights / License:
In Copyright - Non-Commercial Use Permitted
This page was generated automatically upon download from the ETH Zurich Research Collection. For more information please consult the Terms of use.
Department of the Environment,
Transport, Energy and Communication DETEC
Swiss Federal Office of Energy SFOE Energy Research and Cleantech
Final report
Nexus-e: Integrated Energy Systems Modeling Platform
CentIv Module Documentation
Source:ESC 2019
2/28
Date: 27. November 2020 Location: Bern
Publisher:
Swiss Federal Office of Energy SFOE Energy Research and Cleantech CH-3003 Bern
www.bfe.admin.ch Co-financing:
-
Subsidy recipients:
ETH Zürich
Energy Science Center (ESC) Sonneggstrasse 28, CH-8092, Zürich www.esc.ethz.ch
ETH Zürich
Power Systems Lab (PSL) Physikstrasse 3, CH-8092, Zürich www.psl.ee.ethz.ch
Authors:
Elena Raycheva, ESC/PSL - ETH Zürich, elena.raycheva@esc.ethz.ch Christian Schaffner, ESC - ETH Zürich, schaffner@esc.ethz.ch
Gabriela Hug, PSL - ETH Zürich, hug@eeh.ee.ethz.ch SFOE project coordinators:
SFOE head of domain: Yasmine Calisesi, yasmine.calisesi@bfe.admin.ch
SFOE programme manager: Anne-Kathrin Faust, anne-kathrin.faust@bfe.admin.ch SFOE contract number:SI/501460-01
The authors bear the entire responsibility for the content of this report and for the conclusions drawn therefrom.
Summary
Policy changes in the energy sector result in wide-ranging implications throughout the entire energy system and influence all sectors of the economy. Due partly to the high complexity of combining separate models, few attempts have been undertaken to model the interactions between the components of the energy-economic system. The Nexus-e Integrated Energy Systems Modeling Platform aims to fill this gap by providing an interdisciplinary framework of modules that are linked through well-defined interfaces to holistically analyze and understand the impacts of future developments in the energy system. This platform combines bottom-up and top-down energy modeling approaches to represent a much broader scope of the energy-economic system than traditional stand-alone modeling approaches.
In Phase 1 of this project, the objective is to develop a novel tool for the analysis of the Swiss electricity system. This study illustrates the capabilities of Nexus-e in answering the crucial questions of how centralized and distributed flexibility technologies could be deployed in the Swiss electricity system and how they would impact the traditional operation of the system. The aim of the analysis is not policy advice, as some critical developments like the European net-zero emissions goal are not yet included in the scenarios, but rather to illustrate the unique capabilities of the Nexus-e modelling framework.
To answer these questions, consistent technical representations of a wide spectrum of current and novel energy supply, demand, and storage technologies are needed as well as a thorough economic evaluation of different investment incentives and the impact investments have on the wider economy.
Moreover, these aspects need to be combined with modeling of the long- and short-term electricity market structures and electricity networks. This report illustrates the capabilities of the Nexus-e platform.
The Nexus-e Platform consists of five interlinked modules:
1. General Equilibrium Module for Electricity (GemEl): a computable general equilibrium (CGE) mod- ule of the Swiss economy,
2. Centralized Investments Module (CentIv): a grid-constrained generation expansion planning (GEP) considering system flexibility requirements,
3. Distributed Investments Module (DistIv): a GEP module of distributed energy resources,
4. Electricity Market Module (eMark): a market-based dispatch module for determining generator production schedules and electricity market prices,
5. Network Security and Expansion Module (Cascades): a power system security assessment and transmission system expansion planning module.
This report provides the description and documentation for the CentIv module, which is utilized in the Nexus-e framework to provide information regarding optimal investments in new generation and storage technologies at the transmission system level.
Zusammenfassung
Politische Veränderungen im Energiesektor haben weitreichende Auswirkungen auf das gesamte En- ergiesystem und beeinflussen alle Sektoren der Wirtschaft. Aufgrund der hohen Komplexität der En- ergiewirtschaft, wurden bisher nur wenige Versuche unternommen, die Wechselwirkungen zwischen den einzelnen Komponenten dieses Systems zu modellieren. Nexus-e, eine Plattform für die Model- lierung von integrierten Energiesystemen, schliesst diese Lücke und schafft einen interdisziplinäre Plat- tform, in welcher verschiedene Module über klar definierten Schnittstellen miteinander verbunden sind.
Dadurch können die Auswirkungen zukünftiger Entwicklungen in der Energiewirtschaft ganzheitlicher analysiert und verstanden werden. Die Nexus-e Plattform ermöglicht die Kombination von „Bottom- Up“ und „Top-Down“ Energiemodellen und ermöglicht es dadurch, einen breiteren Bereich der En- ergiewirtschaft abzubilden als dies bei traditionellen Modellierungsansätzen der Fall ist.
Phase 1 dieses Projekts zielt darauf ab, ein neuartiges Instrument für die Analyse des schweiz- erischen Elektrizitätssystems zu entwickeln. Um die Möglichkeiten von Nexus-e zu veranschaulichen, untersuchen wir die Frage, wie zentrale und dezentrale Flexibilitätstechnologien im schweizerischen Elektrizitätssystem eingesetzt werden können und wie sie sich auf den traditionellen Betrieb des En- ergiesystems auswirken würden. Ziel der Analyse ist es nicht Empfehlungen für die Politik zu geben, da einige wichtige Entwicklungen wie das Europäische Netto-Null-Emissionsziel noch nicht in den Szenar- ien enthalten sind. Vielmehr möchten wir die einzigartigen Fähigkeiten der Modellierungsplattform Nexus-e vorstellen. Um diese Fragen zu beantworten, ist eine konsistente technische Darstellun- gen aktueller und neuartiger Energieversorgungs-, Nachfrage- und Speichertechnologien, sowie eine gründliche wirtschaftliche Bewertung der verschiedenen Investitionsanreize und der Auswirkungen der Investitionen auf die Gesamtwirtschaft erforderlich. Darüber hinaus müssen diese Aspekte mit der Mod- ellierung der lang- und kurzfristigen Strommarktstrukturen und Stromnetze kombiniert werden.Dieser Report veranschaulicht die Fähigkeiten der Nexus-e Plattform.
Die Nexus-e Plattform besteht aus fünf miteinander verknüpften Modulen:
1. Allgemeines Gleichgewichtsmodul für Elektrizität (GemEl): ein Modul zur Darstellung des allge- meinen Gleichgewichts (CGE) der Schweizer Wirtschaft,
2. Investitionsmodul für zentrale Energiesysteme (CentIv): ein Modul zur Planung des netzgebunde- nen Erzeugungsausbaus (GEP) unter Berücksichtigung der Anforderungen an die Systemflexibil- ität,
3. Investitionsmodul für dezentrale Energiesysteme (DistIv): ein GEP-Modul für dezentrale Energieerzeu- gung,
4. Strommarktmodul (eMark): ein marktorientiertes Dispatch-Modul zur Bestimmung von Generator- Produktionsplänen und Strommarktpreisen,
5. Netzsicherheits- und Erweiterungsmodul (Cascades): ein Modul zur Bewertung der Sicherheit des Energiesystems und zur Planung der Erweiterung des Übertragungsnetzes.
Dieser Bericht beinhaltet die Beschreibung und Dokumentation für das CentIv-Modul. Dieses Modul wird im Rahmen von Nexus-e verwendet, um Informationen über optimale Investitionen in neue Generations- und Speichertechnologien auf der Ebene des Übertragungsnetzes zu liefern.
Résumé
Les changements de politique dans le secteur de l’énergie ont de vastes répercussions sur l’ensemble du système énergétique et influencent tous les secteurs de l’économie. En partie à cause de la grande complexité de la combinaison de modèles séparés, peu de tentatives ont été entreprises pour modéliser les interactions entre les composantes du système économico-énergétique. La plateforme de modélisa- tion des systèmes énergétiques intégrés Nexus-e vise à combler cette lacune en fournissant un cadre interdisciplinaire de modules qui sont reliés par des interfaces bien définies pour analyser et compren- dre de manière holistique l’impact des développements futurs du système énergétique. Cette plateforme combine des approches de modélisation énergétique ascendante et descendante pour représenter un champ d’application beaucoup plus large du système économico-énergétique que les approches de modélisation indépendantes traditionnelles.
Dans la phase 1 de ce projet, l’objectif est de développer un nouvel outil pour l’analyse du sys- tème électrique suisse. Cette étude sert à illustrer les capabilités de Nexus-e à répondre aux questions cruciales de comment les technologies de flexibilité centralisées et décentralisées pourraient être dé- ployées dans le système électrique suisse et comment elles affecteraient le fonctionnement traditionnel du système. Le but de cette analyse n’est pas d’offrir de conseils politiques, en tant que les scénarios ne considèrent pas des développements critiques comme l’objectif Européen d’atteindre zéro émission nette, mais d’illustrer les capabilités uniques de la plateforme Nexus. Pour répondre à ces questions, des représentations techniques cohérentes d’un large éventail de technologies actuelles et nouvelles d’approvisionnement, de demande et de stockage d’énergie sont nécessaires, ainsi qu’une évaluation économique approfondie des différentes incitations à l’investissement et de l’impact des investissements sur l’économie au sens large. En outre, ces aspects doivent être combinés avec la modélisation des structures du marché de l’électricité et des réseaux d’électricité à long et à court terme. Ce rapport illustre les capacités de la plateforme Nexus-e.
La plateforme Nexus-e se compose de cinq modules interconnectés:
1. Module d’équilibre général pour l’électricité (GemEl): ein Modul zur Darstellung des allgemeinen Gleichgewichts (CGE) der Schweizer Wirtschaft,
2. Module d’investissements centralisés (CentIv): un module de planification de l’expansion de la production (PEP) soumise aux contraintes du réseau, qui tient compte des exigences de flexibilité du système,
3. Module d’investissements distribués (DistIv): un module PEP de la production décentralisée d’énergie, 4. Module du marché de l’électricité (eMark): un module de répartition basé sur le marché pour
déterminer les calendriers de production des producteurs et les prix du marché de l’électricité, 5. Module de sécurité et d’expansion du réseau (Cascades) : un module d’évaluation de la sécurité
du système électrique et de planification de l’expansion du système de transmission.
Ce rapport fournit la description et la documentation du module CentIv, qui est utilisé dans le cadre de Nexus-e pour fournir des informations concernant les investissements optimaux dans les nouvelles technologies de production et de stockage au niveau du réseau de transport.
Contents
Summary. . . 3
Zusammenfassung . . . 4
Résumé . . . 5
Contents . . . 7
Abbreviations . . . 7
1 Introduction . . . 8
1.1 Module purpose . . . 8
1.2 Process overview . . . 8
1.3 Attributes . . . 8
1.4 Capabilities . . . 8
1.5 Limitations . . . 9
1.6 Inputs and outputs . . . 10
2 Related work and contributions . . . 11
3 Detailed description of the CentIv module. . . 12
3.1 Short-term operation . . . 12
3.2 Investments . . . 15
3.3 System reserves . . . 15
3.4 Transmission system . . . 16
3.5 Computational tractability . . . 16
3.6 Simulation options . . . 17
4 Representation of flexibility . . . 18
5 Description of interfaces . . . 19
5.1 Investments loop . . . 19
5.2 Energy-economic loop . . . 20
6 Demonstration of results . . . 22
7 Publications . . . 25
8 References . . . 25
Appendices . . . 27
A Right-hand-sides of upward generation constraints and ramping constraints of con- ventional thermal generators . . . 27
B Fixing initial minimum up/down times of conventional thermal generators . . . 28
Abbreviations
Cascades Network Security and Expansion Module CentIv Centralized Investments Module
CGE computable general equilibrium DC direct current
DistIv Distributed Investments Module eMark Electricity Market Module
GemEl General Equilibrium Module for Electricity GEP generation expansion planning
MILP mixed-integer linear programming
MW megawatt
MWh megawatt hour
OM operation and maintenance
PV photovoltaic
RES renewable energy source SCR secondary control reserve TCR tertiary control reserve TWh terrawatt hour
UC unit commitment
List of Figures
1 Days compression for simulation speed-up . . . 17
2 Integration and interfacing of the various modules used in Nexus-e . . . 19
3 Location of new generation capacities in Switzerland for 2030 (BaU scenario). . . 23
4 Monthly simulated production per technology in Switzerland . . . 23
5 End-of-month simulated hydro storage levels in Switzerland (2015 vs. 2030) . . . 24
List of Tables
1 Input data for CentIv . . . 102 Output data from CentIv . . . 10
3 Reserve provision per technology. . . 12
4 Interface data CentIv-DistIv . . . 20
5 Interface data DistIv-CentIv . . . 20
6 Interface data CentIv-eMark . . . 21
7 Interface data GemEl-CentIv . . . 21
8 Interface data CentIv-GemEl . . . 21
9 Cost parameters of candidate units in Switzerland (2030) . . . 22
10 New investments in Switzerland (2030) . . . 22
11 Change in net generation and average el. price in Switzerland (2030) . . . 23
12 Net Swiss cross-border exchange 2015 (sim) vs. 2030 (sim) . . . 24
13 Right-hand-side of upward generation constraints . . . 27
14 Right-hand-side of ramp-up constraint - Eq. (6) and ramp-down constraint - Eq. (7) . . . . 27
1 Introduction
1.1 Module purpose
The purpose of CentIv is to co-optimize generation investment and operational decisions on the trans- mission system level for a target year. Depending on the scenario defined, investments can be estab- lished for one zone (country), as shown in this report, or for multiple zones. The module is geared towards providing results with high temporal and spatial resolution from the perspective of a central- ized decision maker. In its formulation, the module includes detailed dispatch, reserve and investment constraints for a wide range of flexibility providers and is tailored to give insight into how real-size power systems would evolve and cope with a projected increase in intermittent renewable energy source (RES) generation.
1.2 Process overview
CentIv co-optimizes operational and capacity investments decisions at the transmission system level with hourly resolution for every other day of a given target year. The overall objective of the optimization problem is to minimize the sum of the investment and dispatch costs of different generation and stor- age technologies such that demand and supply are matched and reserve requirements are met. We include linear transmission network constraints to position candidate units precisely and consider the import/export behavior with other interconnected zones by modeling, albeit at a very aggregated level, their generation as part of the optimization problem.
1.3 Attributes
The following list characterises the main module attributes:
• Static, i.e. decisions are made for a target year and at a single point in time, namely the beginning of the target year
• Deterministic
• Hourly resolution spanning every other day of the year
• Database-powered
• Easily adaptable to other test systems (flexible and modular implementation in Python)
1.4 Capabilities
The following list describes the main module capabilities:
• Co-optimizes investment and dispatch decisions at the transmission level
• Provides location, type and capacity of new investments at the transmission level
• Includes detailed operational and reserve constraints for a wide range of technologies
• Models transmission system limits
1.5 Limitations
The following list provides context on some of the main limitations of CentIv:
• No hydro network modeling
Multi-reservoir systems are not modeled as such in this version of CentIv. Each generator/pump in the system is assigned to a different reservoir with fictitious energy storage levels using sim- ple heuristics. In the near future, this limitation shall be overcome by modeling the operation of cascaded hydro power plants in Switzerland. To this end, hydro network data is already being collected and processed.
• Static formulation
Currently, CentIv is formulated as a static capacity expansion planning tool. This means that new investments in generation/storage assets are established for a given target year and are made at a single point in time, namely the beginning of the target year. These decisions are based on the demand, weather conditions, surrounding countries’ generation portfolios, etc. for that par- ticular year without any knowledge about past/future years. In a dynamic model, multiple years are considered simultaneously and investment decisions can be made at more than one point in time. In the scope of this project, maintaining high resolution (both temporal and spatial) has been important for interfacing with DistIv which relies heavily on locational timeseries data from CentIv.
Since mixed-integer linear programming (MILP) formulations (the core of CentIv) can become com- putationally intractable as the number of simulated time periods increases, it was decided to build a very detailed static (single year) module instead of focusing on a dynamic formulation. Future work will focus on reducing complexities to be able to incorporate a dynamic aspect (long-term) in the decision-making and compare the investment decisions in both cases.
• No modeling of uncertainties
It is assumed that the capacity expansion decisions are made with perfect knowledge about fu- ture demand, inflows, weather conditions, etc. Even though uncertainty is not directly considered through a stochastic/robust programming framework, the impact of uncertainties related to RES production are captured through detailed modeling of the reserve provision capabilities of both existing and candidate generators. Furthermore, by maintaining a high temporal resolution, a wide range of possible operating conditions is considered. For the time being, no future efforts towards a stochastic formulation are planned.
1.6 Inputs and outputs
Table 1 below lists the required input data of the CentIv module. Those data that are input from or sent to another module through an interface are noted with an asterisk (*).
Table 1: Listing of required input data for CentIv.
Data Resolution Unit Description
Existing Generators Data* by unit - Location, costs, operational parameters, etc.
Candidate Generators Data* by unit - Location, costs, operational parameters, etc.
Grid Topology and Line Parameters - - Detailed transmission system data
Reserve Requirements* hourly MW Hourly secondary/tertiary up/down reserve requirement Nuclear Refueling Schedule by unit/weekly - Weekly schedule of planned outages of nuclear reactors
Demand* hourly MW Nodal hourly total transmission system demand
Renewable power injections hourly MW Hourly production of run-of-river,photovoltaic (PV) and wind power plants RES Target* annual TWh Annual total gen. from non-hydro RES (biomass, wind, PV)
Invested PV capacity from DistIv annual MW Annual PV investments during simulation year from DistIv
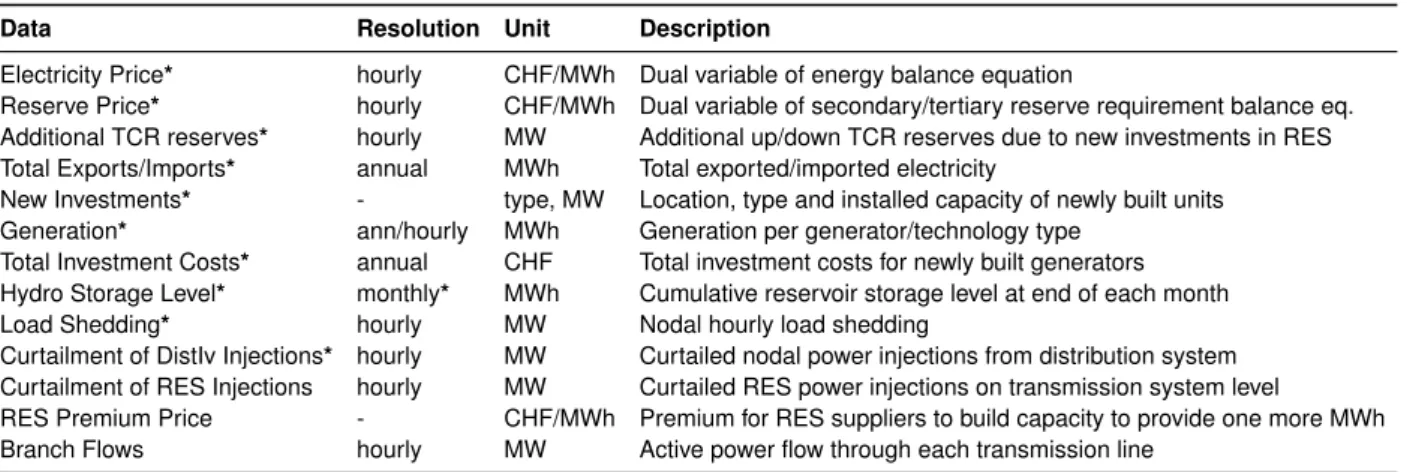
Table 2 summarizes the outputs that CentIv is currently capable of providing.
Table 2: Listing of resulting output data from CentIv.
Data Resolution Unit Description
Electricity Price* hourly CHF/MWh Dual variable of energy balance equation
Reserve Price* hourly CHF/MWh Dual variable of secondary/tertiary reserve requirement balance eq.
Additional TCR reserves* hourly MW Additional up/down TCR reserves due to new investments in RES Total Exports/Imports* annual MWh Total exported/imported electricity
New Investments* - type, MW Location, type and installed capacity of newly built units Generation* ann/hourly MWh Generation per generator/technology type
Total Investment Costs* annual CHF Total investment costs for newly built generators Hydro Storage Level* monthly* MWh Cumulative reservoir storage level at end of each month
Load Shedding* hourly MW Nodal hourly load shedding
Curtailment of DistIv Injections* hourly MW Curtailed nodal power injections from distribution system Curtailment of RES Injections hourly MW Curtailed RES power injections on transmission system level
RES Premium Price - CHF/MWh Premium for RES suppliers to build capacity to provide one more MWh Branch Flows hourly MW Active power flow through each transmission line
2 Related work and contributions
The integration of large shares of RES has a significant impact on power systems planning as it in- creases the need for operational flexibility from existing and future units. Consequently, the change in system reserve requirements in response to the expected growth of RES has to be accounted for. The main objective of this report is to present the formulation of the GEP problem which accounts for both present and future flexibility needs and demonstrate its functionality on the detailed Swiss transmission system.
The goal of GEP is to determine the optimal investments in new generation and storage technolo- gies over a certain planning horizon, in order to meet load growth and replace decommissioned units. A detailed review of existing formulations related to increasing integration of RES is presented in [1]. Plan- ning generation expansion in power systems with large shares of RES requires modeling the detailed operational constraints of both existing and candidate technologies providing flexibility such as storages, hydro and thermal generators. Furthermore, reserve constraints have to be included in order to fully capture the costs of integrating intermittent generation and ensure normal system operating conditions.
While [2, 3, 4, 5] recognize this and handle some of the constraints, they focus primarily on thermal units and do not consider hydro or battery storages as sources of operational flexibility. In contrast, CentIv includes different types of flexibility providers.
Further flexibility can be provided through imports and exports from other interconnected zones. This is currently considered to be the most convenient and cheapest way to increase flexibility in regions with reliable grid connectivity [6]. Thereby, it is important to model market-based tie line flow constraints as opposed to the full cross-border line limits to better reflect the realistic ability to import/export. Modeling the grid within the considered zone including its connection to neighboring countries, allows to position candidate units at system nodes of interest and determine favorable locations to alleviate, for example, grid congestions. In [7] and [8], direct current (DC) formulations of transmission system constraints are included within the investment model, using simplified power systems as test cases. In contrast, in the present work we investigate the capability of a real-size power system to evolve and cope with the future increase in intermittent RES capacities. We address uncertainties related to renewable production by modeling the reserve provision of both existing and candidate units and capture the increased needs and costs in terms of tertiary system reserve requirements in the optimization problem. This is similar to [9], however, in CentIv we use nodal dispatch, market-based limits on the cross-border tie lines as well as a unit commitment formulation for the operation of conventional thermal generators, which has been shown to have a significant impact on investment decisions [8].
A novelty of this work lies in the high temporal and spacial resolution of the conducted simulations coupled with detailed modeling of flexibility provision, spanning 1) imports/exports from other zones, 2) operation and 3) reserves. In the context of this project, CentIv is validated and then used to establish investments in new generation capacity on the Swiss transmission system level for the time period 2020- 2050. As generation in Switzerland is dominated by hydro capacities, a high temporal resolution for both the validation and generation expansion is needed. While in [2, 3, 4, 5], [7, 8] a few representative days or weeks are used, in the present formulation every other day of the target year is simulated with hourly resolution. This approach is unique to CentIv and features a heuristic to adjust storage levels of hydro power plants in order to correctly account for turbining/pumping during days which are not simulated, leading to significant computational speed-ups.
3 Detailed description of the CentIv module
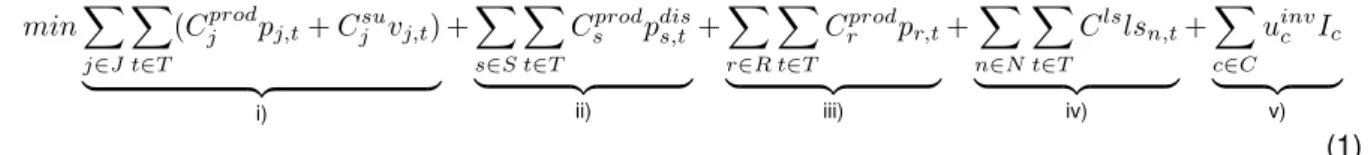
In the following problem formulation lowercase letters are used to denote variables and uppercase letters denote parameters. The objective of the generation expansion planning problem is to minimize the sum of the production and investment costs of all existing and candidate generation and storage technologies over the planning horizonT, which in the present work is fixed to a single year:
minX
j∈J
X
t∈T
(Cjprodpj,t+Cjsuvj,t)
| {z }
i)
+X
s∈S
X
t∈T
Csprodpdiss,t
| {z }
ii)
+X
r∈R
X
t∈T
Crprodpr,t
| {z }
iii)
+X
n∈N
X
t∈T
Clslsn,t
| {z }
iv)
+X
c∈C
uinvc Ic
| {z }
v)
(1) where i) - iii) are the production costs of the set of thermal generatorsJ, energy storage systemsSand non-dispatchable renewable generatorsR, iv) refers to the load shedding costs at theN system nodes and v) are the investment costs associated with building new units from the set of candidate unitsC. All production costs are assumed to be linear functions of the power generated by the given thermal unit, storage system or renewable generator and the associated operational cost parameterCprod. The start- up costs of all thermal generators are expressed as linear functions of the cost parameterCjsuand the startup binary variablevj,tand are independent of the time since last shut-down. For energy storages, only the operational cost associated with purchasing electricity during charging (pumping) are included.
The load shedding at any system nodenis the product of the load shedding cost parameterClsand the load shedding variablelsn,t. In the investment cost formulation,uinvc denotes the investment decision for each candidate unitc, i.e. is equal to 1 if invested and 0 if not. The investment costIc is annualized to account for differences in lifetime. Expression (1) is subject to four sets of constraints related to: 3.1 short-term operation, 3.2 investments, 3.3 reserve provision, and 3.4 transmission system, all of which are described in the following.
3.1 Short-term operation
Short-term operation is modeled by incorporating both the production as well as the reserve provision capabilities of thermal generation, storage and non-dispatchable RES technologies. Table 3 shows which technology types can contribute towards secondary control reserve (SCR) and tertiary control reserve (TCR). Primary reserve is not explicitly modeled as it constitutes less than 10% of the total hourly reserve quantity and in many western EU countries it does not have to be procured locally [10].
Table 3: Reserve provision per technology.
Technology SCR↑↓ TCR↑↓
Thermal: Nuclear/Gas/Coal, etc. 3 3
Storage: Pumped Hydro/Dam 3 3
Storage: Battery 3 7
RES: PV/Wind/Run-of-River 7 7
3.1.1 Thermal generators
The unit commitment (UC) constraints of thermal generators are based on the tight and compact for- mulation in [11] and use three binary variablesuj,t, vj,t, wj,t, respectively for the on/off status, start up
and shut down and one continuous variablepminj,t for the power output above minimum by each unitjin each time periodt. In the following, we give an overview of these constraints. The downward generation constraint is:
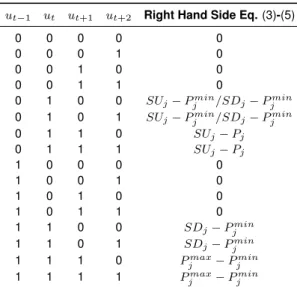
0≤pminj,t −(rj,tSCR↓+rT CR↓j,t ),∀j, t (2) whererSCR↑↓j,t and rj,tT CR↑↓ denote the variables for the contribution of each generator towards down- ward SCR and TCR. The upward generation constraints are given by:
pminj,t + (rj,tSCR↑+rT CR↑j,t )≤(Pjmax−Pjmin)uj,t−(Pjmax−SUj)vj,t,∀t,∀j∈Mjut= 1 (3) pminj,t + (rSCR↑j,t +rT CR↑j,t )≤(Pjmax−Pjmin)uj,t−(Pjmax−SDj)wj,t+1,∀t,∀j∈Mjut= 1 (4) wherePjmax/min refers to the maximum/minimum power output of the conventional generator j and SUj/SDj are its start-up/shut-down capabilities. In case the min. uptime of the generator,Mjut, is two hours or more, a tighter formulation is:
pminj,t + (rSCR↑j,t +rj,tT CR↑)≤(Pjmax−Pjmin)uj,t−(Pjmax−SUj)vj,t− (5) (Pjmax−SDj)wj,t+1,∀t,∀j∈Mjut≥2
It is important to note that constraint (5) is not valid for generators with minimum uptime equal to 1 hour, hence Eq. (3)-(4) are used in such cases. The ramp up and ramp down constraints are respectively:
pminj,t −pminj,t−1+ (rSCR↑j,t +rT CR↑j,t )≤RUjuj,t+ (SUj−Pjmin−RUj)vj,t,∀t,∀j (6) pminj,t−1−pminj,t + (rj,tSCR↓+rT CR↓j,t )≤RDjuj,t−1+ (SDj−Pjmin−RDj)wj,t,∀t,∀j (7) whereRUj/RDj indicate the ramp up/ramp down rate. The logic constraint between the generator statuses is:
uj,t−1−uj,t+vj,t−wj,t= 0,∀t,∀j (8)
In order to make it easier to understand these constraints, the right hand sides of constraints (3)-(7) are given in Appendix A for the various situations, i.e. generator starting, shutting down, etc. The minimum up and minimum down time constraints are respectively:
uj,t≥
t
X
t0=t+1−Mjut
vj,t0,∀t∈[Mjut, T],∀j (9)
1−uj,t≥
t
X
t0=t+1−Mjdt
wj,t0,∀t∈[Mjdt, T],∀j (10)
The initial conditions forcing the on/off status of the units in the first hours are described in Appendix B.
The total generation in any hour is given by:
pj,t=Pjminuj,t+pminj,t ,∀t,∀j (11) Planned maintenance is modeled using:
uj,t≤Sj,t,∀t,∀j ∈Jmaint (12)
whereSj,t is the time series indicating the generators’s availability throughout the simulation horizon.
3.1.2 Energy storage systems
The operational constraints of each storage unit are modeled with three continuous variables: pdiss,t and pchs,tare used for the discharge (turbine) and charge (pump) power and are limited by the maximum dis- charge/charge powerPs,tmax,dis/ch. The variable energy leveles,tis limited by the energy rating (reservoir energy storage level)Emaxs and the final storage levelEs,T is set equal to the initial valueEs,0, i.e. en- ergy levels at the beginning and the end of the year should be equal. It is assumed that each storage system can turn on and produce/consume at maximum discharge/charge power instantaneously:
0≤pdis/chs,t ≤Psmax,dis/ch,∀t,∀s, (14)
Esmin≤es,t≤Esmax,∀t,∀s and Es,T =Es,T0,∀s (15) es,t=es,t−1+ηschpchs,t−pdiss,t
ηsdis
| {z }
∀s,∀t
+ ξs,t
|{z}
∀s∈Shyd,∀t
and es,t≥0,∀t,∀s (16)
Eq. (16) describes the energy content of each storage unit in each hour, taking into account the charg- ing/discharging efficienciesηbch andηsdis. It is important to note that the present formulation of storage constraints allows for simultaneous charging and discharging, however, due to the associated efficiency terms, an optimal solution will lead to either charging or discharging [12]. The upward and downward reserve constraints are:
rSCR↑s,t +rT CR↑s,t ≤Psmax,dis−pdiss,t +pchs,t,∀t,∀s∈S (17) rSCR↓s,t +rs,tT CR↓≤Psmax,ch−pchs,t+pdiss,t,∀t,∀s /∈Sdam (18)
rSCR/T CR↑↓s,t ≥0,∀t,∀s (19)
where for batteries the variable contribution towards tertiary reserverT CR↑↓s,t is set to zero, as it is as- sumed they do not contribute towards TCR (see Table 3). Equations (14)-(17) are valid for hydro dams without pumping capabilities with pchs,t set to zero. Constraint (17) allows all storage types to provide upward reserve even if they are not producing. Similarly, pumped hydro and batteries can provide down- ward reserve while staying idle. This assumption is valid as storage units are considered to be infinitely flexible. To ensure that hydro dams do not provide downward reserve when not producing, the following constraint is added:
0≤pdiss,t −(rs,tSCR↓+rT CR↓s,t )≤Psmax,dis,∀t,∀s∈Sdam (20)
3.1.3 Non-dispatchable RES
Production from solar, wind and run-of-river power plants is modeled via exogenously determined ca- pacity factor profiles,CFr,tmultiplied by the unit’s maximum installed powerPrmax. We further allow for curtailment of renewable power, i.e.:
0≤pr,t≤CFr,tPrmax,∀t,∀r (21) In case of setting a fixed RES target, TRES, to be covered by non-hydro renewable generators (PV, wind, biomass), the following constraint is added:
X
r∈Rpv,wind
X
t∈T
pr,t+ X
j∈Jbio
X
t∈T
pj,t≥TRES (22)
3.2 Investments
The constraints in the previous subsection have been formulated for units that are already a part of the supply system. For candidate units, for which a decision is still to be made, the same constraints, but slightly adapted can be included. For thermal generators, the investment decision variableuinvc from (1) is binary which corresponds to investments in discrete units. To only dispatch units that have been built, the investment and operational decisions are linked by:
uc,t≤uinvc , uinvc ∈[0,1],∀t,∀c∈ Cthermal (23) whereuc,t is the binary variable for the on/off status of each thermal candidate unit in each time step.
Similarly, for storages:
0≤pdis/chc,t ≤uinvc Pmax,dis/ch, uinvc ∈[0,1],∀t,∀c∈ Cstorage (24) To only allow reserve provision by units that are built, we multiplyPsmax,dis/ch in (17)-(18) byuinvc , but otherwise use the same constraints. For non-dispatchable RES candidate generators, the investment decision variableuinvc is continuous and corresponds to the built capacity at the candidate location with capacity factorCFc,tand maximum allowable investment capacityPinv,max:
0≤pc,t≤uinvc CFc,t, 0≤uinvc ≤Pcinv,max,∀t,∀c∈ CRES (25)
3.3 System reserves
The formulation of the reserve constraints in Section 3.1 allows for non-symmetric reserve provision by each generator/storage unit which is consistent with efforts to reduce market barriers for smaller bidders who might be unable to offer symmetrical power bids [10]. The reserves provided by the units have to satisfy the system-wide demand for up/down balancing capacity in each time period:
X
j∈J
rj,tT CR↑+ X
s∈Shydro
rs,tT CR↑≥T CR↑,syst +rT CR↑,RES,∀t (26) X
j∈J
rj,tT CR↓+ X
s∈Shydro
rs,tT CR↓≥T CR↓,syst +rT CR↓,RES,∀t (27) whereT CR↑,syst is the upward tertiary system reserve quantity required by the Transmission System Operator (TSO) att. Depending on the investments in wind and solar PV capacities, an additional tertiary reserve quantityrT CR↑↓,RES is added to ensure that there is enough system flexibility to compensate uncertainties in RES production:
rT CR↑↓,RES =A↑↓wind X
c∈CwindRES
uinvc +A↑↓pv X
c∈CRESpv
uinvc (28)
whereAwind/pv is an empirically derived coefficient calculated following the methodology in [9] where short-term wind and PV forecast methods were used to quantify the additional reserves needed. The constraints for provision of secondary reserve are identical to (26)-(27) without the additional terms from (28). Similar to [13, 14], this formulation assumes that the variability in RES generation is accounted for in the tertiary reserve requirement.
3.4 Transmission system
The active power balance at each bus noden∈ N is:
pn,t =Pn,tD −lsn,t−dcurtn,t+ X
s∈Sn,t
pchs,t− X
j∈Jn,t
pj,t− X
s∈Sn,t
pdiss,t − X
r∈Rn,t
pr,t, ∀t,∀n (29)
wherePn,tD is the nodal demand, lsn,t refers to the load shedding variable,dcurtn,t is the variable for the curtailment of power injections from the distribution grid and the remaining terms correspond to the power output of each generator or storage system. It is important to note thatPn,tD is an input parameter defined over real numbers (Pn,tD ∈IR). Positive values indicate loads while negative values are power injections from the distribution grid. Load shedding is allowed at each bus with associated demand and is strictly non-negative:
lsn,t≤max(0, Pn,tD),∀n,∀t (30) while the curtailment of distribution grid injections (strictly non-positive) is constrained as follows:
dcurtn,t≥min(Pn,tD,0),∀n,∀t (31) The nodal active powerpn,t is the sum of the active power flows of all linesl ∈ L connected tonas given in:
pn,t = X
i∈l(n,i)
pl(n,i),t,∀t,∀n (32)
and the active power flowplof a single line is:
pl(n,i),t=Bl(δn,t−δi,t),∀t (33)
−Plmax≤pl(n,i),t≤Plmax,∀t,∀l(n, i), (34)
whereBl is the admittance,δn,δi are the voltage angles at the start and end nodes and Plmax is the thermal limit of the line. At the slack bus, the voltage angle is zero degrees. Assuming normal power system operating conditions, the voltage angle difference between the sending and receiving end of each line is restricted to 20◦[15].
3.5 Computational tractability
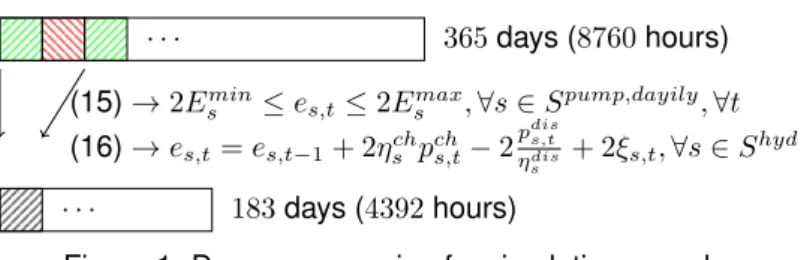
The large-scale MILP formulation described in (1)-(34) is implemented in Pyomo [16] and solved with Gurobi [17]. As Switzerland’s generation portfolio is heavily dominated by hydro capacities, capturing their operational behavior is salient to any model attempting to replicate historical or predict future pro- duction. To speed up computations, while maintaining very high temporal resolution (necessary due to short-term fluctuations in river flows, wind and solar generation) and chronological accuracy (necessary due to the presence of seasonal storages), every other day of the year is simulated with hourly reso- lution. Thus, the change in demand behavior between weekdays and weekends during each week is always captured.
Fig.1 shows how hydro storage levels are approximated for the days which are not simulated. This form of compression is only used for pumped and dam hydro power plants and not for battery storages as it is assumed the latter operate on shorter cycles (less than a day). Our approach relies on the assumption of day-to-day similarity in operation of both pump and dam power plants. This is valid for dams as they operate on a seasonal cycle as well as for pumped power plants which, depending on their reservoir capacity, operate on a daily to weekly cycle. By adapting (15)-(16), the pumping/turbining across two days is aggregated into the time during which the storage charges/discharges in a single
365days (8760hours) . . .
. . . 183days (4392hours)
(15)→2Emins ≤es,t≤2Esmax,∀s∈Spump,dayily,∀t (16)→es,t=es,t−1+ 2ηschpchs,t−2p
dis s,t
ηdiss + 2ξs,t,∀s∈Shyd
Figure 1: Days compression for simulation speed-up
day, which means that the modeled fluctuations in storage level would have double the amplitude. This doubling is not relevant for seasonal storages, but is relevant for those that operate on a daily cycle.
Therefore, the initial/minimum/maximum reservoir levels of daily pumped storages are doubled.
The considered investment costs span the entire year instead of only every second day, therefore we double the operating costs in (1). As it is possible to get non-unique solutions for the hourly operation of hydro storages, stemming from the aggregated modeling of the surrounding countries and simplified production costs, we fix the investment (uinvc ) and binary UC decisions (uj,t, vj,t, wj,t) and re-solve the linear dispatch problem while also including a negligible price incentive,β, for keeping more water in the storages as a security measure:
minX
j∈J0
X
t∈T
(Cjprodpj,t+Cjsuvj,t) +X
s∈S0
X
t∈T
Csprodpdiss,t + X
r∈R0
X
t∈T
Crprodpr,t+ X
n∈N
X
t∈T
Clslsn,t−X
s∈S0
X
t∈T
es,tβ
(35) whereJ0,S0 andR0refer to the sets containing both the existing and newly invested units. In this way, we are able to choose a specific storage curve out of the ones that all lead to the same objective function value.
3.6 Simulation options
CentIv can be run in a stand-alone or interfaced mode. Since it combines a detailed operational model and an investment model, it can be used to determine 1) optimal dispatch or 2) co-optimized dispatch and capacity expansion. To increase computational efficiency during interface testing, every second/third/fourth, etc. day can be simulated following the methodology described in Section 3.5. Due to the large-scale MILP formulation, a single module run with the current test system and every-other-day time resolution can take5−15husing high-performance computing (Processor Specs: 2nd Generation AMD EPYC 7742 / RAM Specs: 512 GB DDR4 memory clocked at 3200 MHz). During the module calibration and validation phase, the results from a full-resolution (8760h) and compressed-resolution (4392h) simulation for the year 2015 have been compared, with only minor differences observed in the dispatch of dams during summer and run-time speed-up of a factor of3. It is important to note that the computational advantages gained by using compressed temporal resolution increase when simulat- ing future years due to the addition of candidate units and corresponding investment and operational constraints which makes the problem both larger and more complex.
4 Representation of flexibility
In CentIv the demand for flexibility is taken into account by 1) modeling the hourly system reserve re- quirements and 2) augmenting these as part of the optimization problem in case investments in new intermittent RES generators are made. In this way it is possible to capture the integration costs associ- ated with increased penetration of RES.
The supply of flexibility is accounted for in three different ways. First, CentIv includes a detailed formulation of the operation (including scheduled maintenance) and reserve provision capabilities of different flexibility providers such as conventional thermal generators and storages. Second, we consider the market-based tie line flow constraints in the optimization problem to better reflect the realistic ability to export and import. Providing flexibility through imports and exports is currently considered to be the most convenient and cheapest way to increase flexibility [6]. Third, CentIv is capable of covering various residual demand profiles resulting from different penetration levels of distributed PV by means of allowing both 1) curtailment of available resources on the transmission system level as well as 2) curtailment of distribution system injections to match demand and supply.
5 Description of interfaces
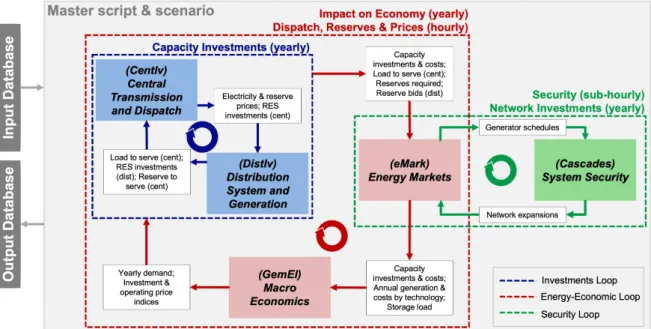
The most significant novelty of the Nexus-e platform is that it combines the core modules used in a sophisticated way with automated interfaces to pass all necessary information between modules as shown in Figure 2. The CentIv module is connected within the Investment and Energy-Economic loops of this framework with an input interface where data is coming from the GemEl and DistIv modules and an output interface that sends data to the GemEl, DistIv and eMark modules. The following subsections briefly outline the information exchange and purpose of the interfaces. For further information regarding module interfaces, the reader is referred to theNexus-e Interfaces Report.
Figure 2: Illustration of the integration and interfacing of the various modules used in Nexus-e.
5.1 Investments loop
5.1.1 CentIv - DistIv - CentIv
As part of the Investments Loop (in blue in Fig. 2), CentIv is interfaced with DistIv in order to model a coordinated generation expansion planning at the transmission and distribution system levels. To this end, CentIv provides DistIv with 1) nodal demand, 2) nodal electricity and reserve prices, 3) total system reserve requirements, 4) total electricity generated and total investment costs as well as 5) electricity produced from RES and RES target. The data transfer from CentIv to DistIv is summarized in Table 4. The hourly resolution denoted by an asterisk(*) refers to the fact that in both modules every other day of the year is simulated with an hourly resolution (4392hrs instead of 8760hrs) in order to reduce the computational complexity, see Section 3.5. The nodal electricity prices and zonal reserve prices, together with the net generation and investment costs at the transmission system level, are used by DistIv to trade-off investing at the distribution level and purchasing the electricity from the transmission system.
Table 4: CentIv-DistIv module interface detail.
Data Resolution Unit Description
Original Demand hourly*, nodal MW Original transmission system demand Electricity Price hourly*, nodal CHF/MWh Dual variable of energy balance equation
SCR Reserve Price hourly* CHF/MWh Dual variable of secondary reserve requirement equation SCR Requirement hourly* MW System SCR up/down requirement
Total Net Generation annual MWh Total net generation (generation - pump consumption) Investment Costs annual CHF Investment and Fixed OM costs of newly built units RES Production annual TWh Total production from non-hydro RES (biomass, wind, PV) Original RES Target annual TWh Target for production from non-hydro RES
After DistIv is run, it sends back the 1) residual nodal demand, 2) residual reserve requirement and 3) investments in PV such that CentIv can re-evaluate investments, augment the reserve requirements (in case of investment in PV at the distribution level) and conduct a new centralized expansion planning.
The data transfer from DistIv to CentIv is summarized in Table 5. Such a set-up, while not resulting in an optimal mix of investments, aims to emulate coordination between transmission system operator (TSO) and distribution system operator (DSO), whereby each makes informed decisions based on information exchange.
Table 5: DistIv-CentIv module interface details.
Variable Resolution Unit Description
Residual Demand hourly*, nodal MW Residual demand (original demand minus distributed gener- ation and DSM/BSS load shifting)
Distributed Generation hourly*, nodal MW Generation from all units in the distribution system (existing and newly built)
Residual SCR Requirement hourly* MW Residual hourly system SCR up/down requirement RES Production - TWh Total accumulated production from RES in DistIv Invested PV Capacity annual, by unit type MW Annual PV investments during simulation year in DistIv
5.2 Energy-economic loop
As part of the Energy-Economic Loop (in red in Fig. 2), CentIv is interfaced with eMark and GemEl.
5.2.1 CentIv - eMark
The main purpose of the interface to eMark is to provide information regarding the generators/storages (existing and newly built) that participate in the electricity market as well as the demand and reserve requirements to be covered. The generator ID’s, capacities and variable costs are used to update eMark and include any newly built units by CentIv and any adjustment to generator operating costs from the GemEl cost indices. Investments in DistIv are not modeled in eMark (i.e. not market participants) but their injections are accounted for in the residual load sent by CentIv. CentIv also provides any update to the reserve requirements that could increase as new RES capacities are built in either CentIv or DistIv.
The hydro dam storage levels at the end of each month are also updated by CentIv so that eMark will use the same seasonal pattern as CentIv. Note that CentIv optimizes the operation of dams so the resulting seasonal pattern is not fixed to match the historical trend and is a result of the optimization.
The nodal demand (i.e. original and residual), curtailments, and demand shed are provided by CentIv so that eMark sets the proper hourly electricity demands. Table 6 shows details of the data transferred
in this interface.
Table 6: CentIv-eMark module interface details.
Variable Resolution Unit Description
Generator ID’s by unit – Generator database identifiers Generator capacities by unit MW Generator capacities
Generator variable costs by unit CHF/MWh Variable generation costs
System reserve requirements hourly, zonal MW Requirement for each reserve product Original demand hourly, nodal MWh Original electricity load to serve
Residual demand hourly, nodal MWh Residual load after distribution self-supply (DistIv) Curtailments hourly, nodal MWh Curtailments by CentIv of DistIv injections Demand shed hourly, nodal MWh Load shed by CentIv
Demand scale ratio annual – Swiss load scale ratio from Gemel
Dam monthly storage levels monthly MWh Aggr. energy volume in dams at the end of each month
5.2.2 GemEl - CentIv - GemEl
The GemEl-CentIv interface provides feedback from the macroeconomic GemEl module to CentIv about how the economy and consumers respond to the expenses incurred in the electricity system. The feedback is in the form of a change to the annual Swiss demand and a change to the operating and investment costs for generating units and is summarized in Table 7 below. CentIv compares the adjusted annual Swiss demand to the initial value of the annual demand pulled from the database and calculates their ratio as a scaling factor. The scaling factor is applied as a multiplier to the hourly nodal Swiss load profiles to re-scale them to match the adjusted total from GemEl. Similarly, new price indices provided by GemEl for operating and investment costs are used as a multiplier to reset all existing and candidate variable operation and maintenance (OM) costs, fixed OM costs, and investment costs.
Table 7: GemEl-CentIv module interface details.
Variable Resolution Unit Description
Total Swiss demand annual MWh Yearly demand in Switzerland Price index for variable OM costs annual – Change in variable OM costs Price index for fixed OM costs annual – Change in fixed OM costs Price index for investment costs annual – Change in investment costs
The interface from CentIv to GemEl passes cost information for all generators, those newly built as well as those already existing, on the transmission system level. This information is mapped to the technology types in GemEl and used to recalibrate the module to reflect the new generation mix and costs. Table 8 shows details of the data transferred through the CentIv-GemEl interface.
Table 8: CentIv-GemEl module interface details.
Variable Resolution Unit Description
Investment cost annual, by unit type mill CHF Investment cost per technology type Fixed OM cost annual, by unit type mill CHF Fixed OM cost per technology type Generation share annual, by unit type MWh Generation per technology type
6 Demonstration of results
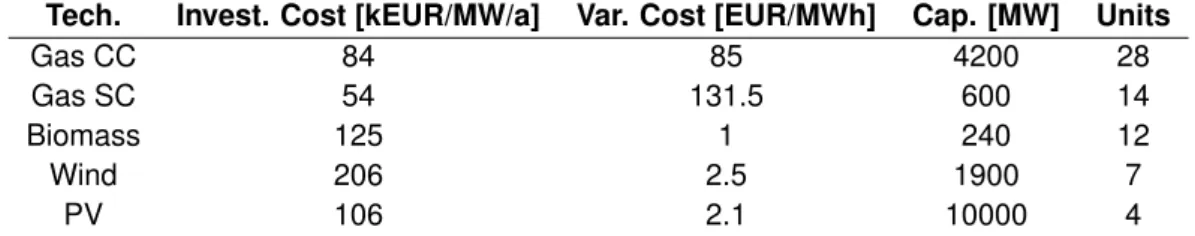
The demonstration results in this section highlight the capabilities and insights CentIv provides. These results are only for illustrative purposes and are not meant to represent the final results of the Nexus-e simulation framework for any particular scenario. In this section we demonstrate sample results from a standalone CentIv module run for Switzerland for the target year 2030. Following a 50-year decom- missioning plan, only 36% (1220 MW) of the 2015 installed nuclear capacity in the country will remain operational in 2030. We present two different scenarios: 1) business-as-usual (BaU) and 2) enforcing a renewable energy target (RES target). In 2) a production target of 9 TWh from non-hydro renewable generators (including existing biomass, PV and wind) is imposed in Switzerland. In both scenarios, 65 candidate units with varying sizes and cost parameters from [18] and own calculations, summarized in Table 9, are placed at system nodes of interest. While the costs of biomass reflect on-going waste incineration subsidies which are expected to continue in the future, we assume no subsidies for PV and wind. It is important to note that in this simulation the PV candidate units are included as injections at transmission system nodes (as opposed to distribution system nodes) in order to have a more diverse list of candidates as well as enough candidate capacity to satisfy the renewable target. Therefore, here we don’t consider self-consumption, demand side management, etc. All planned hydro power and trans- mission system upgrades in the period 2016-2025 are included. The transmission system is identical to the one used to conduct the 2030 simulations for the final results report (i.e. Swiss transmission system in full detail and surrounding countries (AT, DE, FR, IT) aggregated to one node per country).
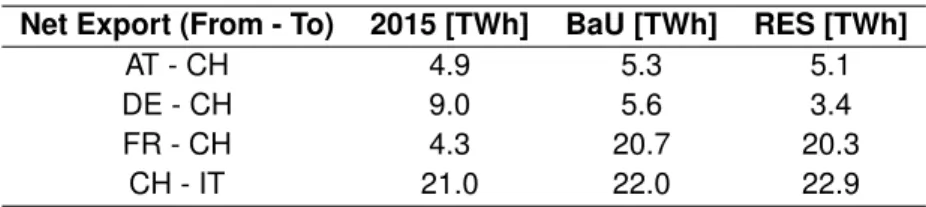
Swiss demand and fuel cost projections for 2030 are from [19] and [20]. Hydro inflows are set to the 2015 values from [21] and the production profiles for PV and wind candidates are from [9]. The hourly Swiss system reserve requirements for CH are taken from [22] and are for the year 2015. The demand, generators and fuel costs in the surrounding countries are adapted to reflect the 2030 projections from [20]. The 2015 wind and PV production profiles of the neighbors are scaled to match the projected 2030 totals from [20] and the cross-border flows with all other countries are fixed to the values for 2015 [23].
Table 9: Cost parameters of candidate units in Switzerland (2030)
Tech. Invest. Cost [kEUR/MW/a] Var. Cost [EUR/MWh] Cap. [MW] Units
Gas CC 84 85 4200 28
Gas SC 54 131.5 600 14
Biomass 125 1 240 12
Wind 206 2.5 1900 7
PV 106 2.1 10000 4
Table 10 summarizes the investments made under the two considered scenarios. Even without a RES target, all biomass candidate power plants are built. Given their low costs and the decreased nu- clear production, it is more economically viable to have new generators produce locally than to solely import. Figure 3 shows the location of the new units. In total 12 units (20 MW each) are added at 6 nodes where waste incineration power plants already exist. To satisfy the target, a total of 240 MW biomass and 3254 MW PV is invested in (the remaining 3.36 TWh to achieve the 9 TWh are produced by existing generators: 2.1 TWh (biomass), 1.1 TWh ( PV) and 0.16 TWh (wind)). As a result of the increased intermittent RES generation in the second scenario, the total TCR requirement in each hour increases by 26 MW (up) and 28 MW (down) without the need for investments in new dispatchable units.
Table 10: New investments in Switzerland (2030)
Scen. Techn. Built [MW] Gen. [TWh] + TCR↑[MW] + TCR↓[MW]
BaU Biomass 240 2.0 7 7
RES Biomass PV
240 3254
2.0 3.64
7 26
7 28
New Units in 2030 (BaU) 380 kV
220 kV 150 kV Y-connection node single transformer double transformer 40 MW Biomass
Figure 3: Location of new generation capacities in Switzerland for 2030 (BaU scenario).
Table 11 shows the percentage decrease (-%) in net generation and increase (+%) in average annual electricity price in 2030 compared to 2015. The reasons for the price increase in 2030 are twofold: 1) less domestic generation and 2) projected increase in CO2and fuel costs. Since Switzerland is a price taker during the majority of the year, the generation costs of the conventional units in the surrounding countries have a profound impact on Swiss electricity prices.
Table 11: Change in net generation and average el. price in Switzerland (2030) Scen. Tot. net gen. [% 2015] Av. el. price [% 2015]
BaU -19% +51%
RES -14% +47%
light – 2015 / normal - 2030 BaU / striped – 2030 RES 2
4 6
month TWh
RoR Nuclear Storage Biomass
PV Wind Others