Department of the Environment,
Transport, Energy and Communication DETEC
Swiss Federal Office of Energy SFOE Energy Research and Cleantech
Final report
Nexus-e: Integrated Energy Systems Modeling Platform
eMark Module Documentation
Source:ESC 2019
2/39
Date: 27. November 2020 Location: Bern
Publisher:
Swiss Federal Office of Energy SFOE Energy Research and Cleantech CH-3003 Bern
www.bfe.admin.ch Co-financing:
-
Subsidy recipients:
ETH Zürich
Forschungsstelle Energienetze (FEN) Sonneggstrasse 28, CH-8092, Zürich www.fen.ethz.ch
Authors:
Jared Garrison, Forschungsstelle Energienetze - ETH Zürich, garrison@fen.ethz.ch Turhan Demiray, Forschungsstelle Energienetze - ETH Zürich, demirayt@ethz.ch SFOE project coordinators:
SFOE head of domain: Yasmine Calisesi, yasmine.calisesi@bfe.admin.ch
SFOE programme manager: Anne-Kathrin Faust, anne-kathrin.faust@bfe.admin.ch SFOE contract number:SI/501460-01
The authors bear the entire responsibility for the content of this report and for the conclusions drawn therefrom.
Summary
Policy changes in the energy sector result in wide-ranging implications throughout the entire energy system and influence all sectors of the economy. Due partly to the high complexity of combining separate models, few attempts have been undertaken to model the interactions between the components of the energy-economic system. The Nexus-e Integrated Energy Systems Modeling Platform aims to fill this gap by providing an interdisciplinary framework of modules that are linked through well-defined interfaces to holistically analyze and understand the impacts of future developments in the energy system. This platform combines bottom-up and top-down energy modeling approaches to represent a much broader scope of the energy-economic system than traditional stand-alone modeling approaches.
In Phase 1 of this project, the objective is to develop a novel tool for the analysis of the Swiss electricity system. This study illustrates the capabilities of Nexus-e in answering the crucial questions of how centralized and distributed flexibility technologies could be deployed in the Swiss electricity system and how they would impact the traditional operation of the system. The aim of the analysis is not policy advice, as some critical developments like the European net-zero emissions goal are not yet included in the scenarios, but rather to illustrate the unique capabilities of the Nexus-e modeling framework.
To answer these questions, consistent technical representations of a wide spectrum of current and novel energy supply, demand, and storage technologies are needed as well as a thorough economic evaluation of different investment incentives and the impact investments have on the wider economy.
Moreover, these aspects need to be combined with modeling of the long- and short-term electricity market structures and electricity networks.
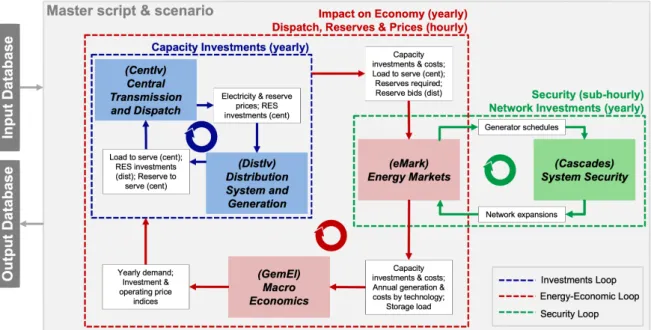
The Nexus-e Platform consists of five interlinked modules:
1. General Equilibrium Module for Electricity (GemEl): a computable general equilibrium (CGE) mod- ule of the Swiss economy,
2. Centralized Investments Module (CentIv): a grid-constrained generation expansion planning (GEP) module considering system flexibility requirements,
3. Distributed Investments Module (DistIv): a GEP module of distributed energy resources,
4. Electricity Market Module (eMark): a market-based dispatch module for determining generator production schedules and electricity market prices,
5. Network Security and Expansion Module (Cascades): a power system security assessment and transmission system expansion planning module.
This report provides the description and documentation for the eMark module, which is utilized in the Nexus-e framework to provide a market-based dispatch of generators that better reflects the actual procedures currently used to clear the energy and reserve markets as well as the timing of the various market products and the coupling of market zones.
Zusammenfassung
Politische Veränderungen im Energiesektor haben weitreichende Auswirkungen auf das gesamte En- ergiesystem und beeinflussen alle Sektoren der Wirtschaft. Aufgrund der hohen Komplexität der En- ergiewirtschaft, wurden bisher nur wenige Versuche unternommen, die Wechselwirkungen zwischen den einzelnen Komponenten dieses Systems zu modellieren. Nexus-e, eine Plattform für die Model- lierung von integrierten Energiesystemen, schliesst diese Lücke und schafft einen interdisziplinäre Plat- tform, in welcher verschiedene Module über klar definierten Schnittstellen miteinander verbunden sind.
Dadurch können die Auswirkungen zukünftiger Entwicklungen in der Energiewirtschaft ganzheitlicher analysiert und verstanden werden. Die Nexus-e Plattform ermöglicht die Kombination von „Bottom- Up“ und „Top-Down“ Energiemodellen und ermöglicht es dadurch, einen breiteren Bereich der En- ergiewirtschaft abzubilden als dies bei traditionellen Modellierungsansätzen der Fall ist.
Phase 1 dieses Projekts zielt darauf ab, ein neuartiges Instrument für die Analyse des schweiz- erischen Elektrizitätssystems zu entwickeln. Um die Möglichkeiten von Nexus-e zu veranschaulichen, untersuchen wir die Frage, wie zentrale und dezentrale Flexibilitätstechnologien im schweizerischen Elektrizitätssystem eingesetzt werden können und wie sie sich auf den traditionellen Betrieb des En- ergiesystems auswirken würden. Ziel der Analyse ist es nicht Empfehlungen für die Politik zu geben, da einige wichtige Entwicklungen wie das Europäische Netto-Null-Emissionsziel noch nicht in den Szenar- ien enthalten sind. Vielmehr möchten wir die einzigartigen Fähigkeiten der Modellierungsplattform Nexus-e vorstellen. Um diese Fragen zu beantworten, ist eine konsistente technische Darstellun- gen aktueller und neuartiger Energieversorgungs-, Nachfrage- und Speichertechnologien, sowie eine gründliche wirtschaftliche Bewertung der verschiedenen Investitionsanreize und der Auswirkungen der Investitionen auf die Gesamtwirtschaft erforderlich. Darüber hinaus müssen diese Aspekte mit der Mod- ellierung der lang- und kurzfristigen Strommarktstrukturen und Stromnetze kombiniert werden.
Die Nexus-e Plattform besteht aus fünf miteinander verknüpften Modulen:
1. Allgemeines Gleichgewichtsmodul für Elektrizität (GemEl): ein Modul zur Darstellung des allge- meinen Gleichgewichts (CGE) der Schweizer Wirtschaft,
2. Investitionsmodul für zentrale Energiesysteme (CentIv): ein Modul zur Planung des netzgebunde- nen Erzeugungsausbaus (GEP) unter Berücksichtigung der Anforderungen an die Systemflexibil- ität,
3. Investitionsmodul für dezentrale Energiesysteme (DistIv): ein GEP-Modul für dezentrale Energieer- zeugung,
4. Strommarktmodul (eMark): ein marktorientiertes Dispatch-Modul zur Bestimmung von Generator- Produktionsplänen und Strommarktpreisen,
5. Netzsicherheits- und Erweiterungsmodul (Cascades): ein Modul zur Bewertung der Sicherheit des Energiesystems und zur Planung der Erweiterung des Übertragungsnetzes.
Dieser Bericht beinhaltet die Beschreibung und Dokumentation des eMark-Moduls. Dieses Modul wird im Rahmen von Nexus-e verwendet, um eine marktorientierte Einspeisung von Stromerzeugern zu ermöglichen, die die aktuellen Verfahren zur Abwicklung der Energie- und Reservemärkte sowie das Timing der verschiedenen Marktprodukte und die Kopplung von Marktzonen besser widerspiegelt.
Résumé
Les changements de politique dans le secteur de l’énergie ont de vastes répercussions sur l’ensemble du système énergétique et influencent tous les secteurs de l’économie. En partie à cause de la grande complexité de la combinaison de modèles séparés, peu de tentatives ont été entreprises pour modéliser les interactions entre les composantes du système économico-énergétique. La plateforme de modélisa- tion des systèmes énergétiques intégrés Nexus-e vise à combler cette lacune en fournissant un cadre interdisciplinaire de modules qui sont reliés par des interfaces bien définies pour analyser et compren- dre de manière holistique l’impact des développements futurs du système énergétique. Cette plateforme combine des approches de modélisation énergétique ascendante et descendante pour représenter un champ d’application beaucoup plus large du système économico-énergétique que les approches de modélisation indépendantes traditionnelles.
Dans la phase 1 de ce projet, l’objectif est de développer un nouvel outil pour l’analyse du sys- tème électrique suisse. Cette étude sert à illustrer les capabilités de Nexus-e à répondre aux questions cruciales de comment les technologies de flexibilité centralisées et décentralisées pourraient être dé- ployées dans le système électrique suisse et comment elles affecteraient le fonctionnement traditionnel du système. Le but de cette analyse n’est pas d’offrir de conseils politiques, en tant que les scénarios ne considèrent pas des développements critiques comme l’objectif Européen d’atteindre zéro émission nette, mais d’illustrer les capabilités uniques de la plateforme Nexus. Pour répondre à ces questions, des représentations techniques cohérentes d’un large éventail de technologies actuelles et nouvelles d’approvisionnement, de demande et de stockage d’énergie sont nécessaires, ainsi qu’une évaluation économique approfondie des différentes incitations à l’investissement et de l’impact des investissements sur l’économie au sens large. En outre, ces aspects doivent être combinés avec la modélisation des structures du marché de l’électricité et des réseaux d’électricité à long et à court terme.
La plateforme Nexus-e se compose de cinq modules interconnectés:
1. Module d’équilibre général pour l’électricité (GemEl) : un module d’équilibre général calculable (CGE) de l’économie suisse,
2. Module d’investissements centralisés (CentIv) : un module de planification de l’expansion de la production (GEP) soumise aux contraintes du réseau, qui tient compte des exigences de flexibilité du système,
3. Module d’investissements distribués (DistIv) : un module GEP de la production décentralisée d’énergie,
4. Module du marché de l’électricité (eMark) : un module de répartition basé sur le marché pour déterminer les calendriers de production des producteurs et les prix du marché de l’électricité, 5. Module de sécurité et d’expansion du réseau (Cascades) : un module d’évaluation de la sécurité
du système électrique et de planification de l’expansion du système de transmission.
Ce rapport fournit la description et la documentation du module eMark, qui est utilisé dans le cadre de Nexus-e pour fournir une répartition des producteurs basée sur le marché qui reflète mieux les procédures réelles actuellement utilisées pour compenser les marchés de l’énergie et des réserves ainsi que le calendrier des différents produits du marché et le couplage des zones de marché.
Contents
Summary. . . 3
Zusammenfassung . . . 4
Résumé . . . 5
Contents . . . 6
Abbreviations . . . 8
List of Figures. . . 8
List of Tables . . . 8
1 Introduction . . . 9
1.1 Module purpose . . . 9
1.2 Process overview . . . 9
1.3 Attributes . . . 9
1.4 Capabilities . . . 10
1.5 Limitations . . . 10
1.6 Inputs and outputs . . . 10
2 Related work and contributions . . . 12
2.1 European market structure . . . 12
2.2 Literature review . . . 13
3 Detailed module description . . . 14
3.1 Market clearing . . . 14
3.2 Modeling of sequential markets . . . 18
3.3 Coupled market procedure . . . 24
4 Representation of flexibility . . . 28
5 Description of interfaces . . . 29
5.1 Investments-eMark interface . . . 29
5.2 eMark-GemEl interface . . . 30
5.3 eMark-Cascades interface . . . 30
5.4 Cascades-eMark interface . . . 31
6 Demonstration of results . . . 32
7 Publications . . . 37
8 References . . . 38
Abbreviations
AC alternating current
ACER Agency for the Cooperation of Energy Regulators
AT Austria
ATC available transfer capacity BaM balancing market
BSS battery storage system
Cascades Network Security and Expansion Module CentIv Centralized Investments Module
CGE computable general equilibrium
CH Switzerland
CREG Belgian Federal Commission for Electricity and Gas Regulation CWE Central Western Europe
D2CF two-day-ahead congestion forecast DaM day-ahead market
DC direct current
DE Germany
DistIv Distributed Investments Module DSM demand-side management EEX European Energy Exchange eMark Electricity Market Module
EMP-E Energy Modeling Platform for Europe
ENTSO-E European Network of Transmission System Operators for Electricity EPEX European Power Exchange
FB flow-based
FCR frequency containment reserve
FR France
FRM flow reliability margin
FRR frequency restoration reserve FuM future market
GemEl General Equilibrium Module for Electricity GEP generation expansion planning
GSK generation shift keys
IT Italy
LP linear programming LTC long-term transfer capacity MCP market clearing price
MILP mixed-integer linear programming MVA mega-volt ampere
MW megawatt
MWh megawatt hour
NEMO Nominated Electricity Market Operator NTC net transfer capacity
OM operation and maintenance OTC over-the-counter
PV photovoltaic PWA piece-wise affine
RES renewable energy source RoR run of river
TSO transmission system operator
List of Figures
1 Current market structure in Europe . . . 12
2 Modeling of supply offers and demand bids . . . 15
3 Illustration of market clearing during import and export . . . 18
4 Interaction of the considered markets in Nexus-e . . . 19
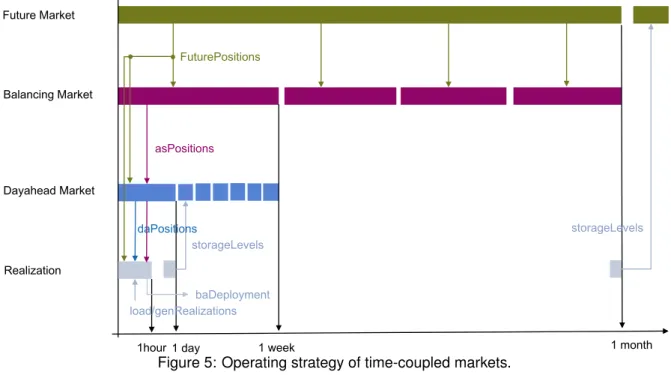
5 Operating strategy of time-coupled markets . . . 24
6 Nexus-e simulation platform flow diagram . . . 29
7 Monthly electricity supply/demand for year in Switzerland . . . 32
8 Hourly electricity supply/demand for one week in Switzerland . . . 33
9 Annual Swiss imports and exports to neighbors . . . 34
10 Annual Swiss NTC utilization to neighbors . . . 34
11 Swiss hydro storage level profile . . . 35
12 Comparing imports/exports with ATC versus FB coupled markets . . . 36
13 Comparing consumer costs and producer surplus with ATC versus FB coupled markets . 36
List of Tables
1 eMark required input data . . . 112 eMark resulting output data . . . 11
3 Hedge ratios for Swiss units . . . 20
4 Hedge ratios for Non-Swiss units . . . 20
5 Hedge ratios for loads . . . 20
6 LTC trade limits . . . 21
7 NTC trade limits pre-2020 . . . 23
8 NTC trade limits post-2020 . . . 23
9 Investments-eMark interface data . . . 30
10 eMark-GemEl interface data . . . 30
11 eMark-Cascades interface data . . . 31
12 Cascades-eMark interface data . . . 31
1 Introduction
1.1 Module purpose
The purpose of the eMark module is to simulate a market-based clearing of electricity and reserve supply offers and demand bids. This module is designed to mimic the actual sequential structures and timing currently employed to clear all electricity market products. Additionally, eMark is setup to apply realistic constraints for intra-zonal trading that reflect the current market coupling mechanisms. In this work, the eMark model is applied to a subset of the European Network of Transmission System Operators for Electricity (ENTSO-E) network consisting of Switzerland (CH), Germany (DE), France (FR), Italy (IT), and Austria (AT) with a specific focus on Switzerland. The module is structured to provide high temporal (hourly) resolution and moderate spatial (zonal) resolution equivalent to those of the existing market processes. eMark has the important role in the Nexus-e framework to provide a market-based perspective and enable assessments of future market structures.
1.2 Process overview
The eMark module simulates the energy and reserve market clearing over a one year period using an hourly resolution. In three sequential steps, the model simulates the clearing of the future market, balancing market, and day-ahead market. First, the future market is cleared for a one month period where a user-defined fraction of the average hourly zonal demand during this month is supplied during all hours (i.e. the demand in the future clearing is constant over all hours of one month). Second, the balancing market is cleared for the first week of the same month where all required reserves are supplied over this week (similarly, each reserve requirement is constant over all hours of one week). Third, the day-ahead market is cleared for each hour of the first day of the same week where all remaining electricity demand not already cleared in the future market is supplied in each hour. The day-ahead clearing is repeated for each day of the week followed by repeating of the balancing and day-ahead market clearing for the next weeks and later the future market clearing for the next month. This sequential process continues until each day, week and month are completed.
1.3 Attributes
The following list characterises some of the main module attributes:
• Hourly resolution spanning one year
• Coded in Matlab, utilizing functions of the MatPower package and Gurobi solver
• Linear optimization problems (uniform auctions) for clearing each market
• Deterministic solution (no uncertainty considered in hourly demand or non-dispatchable injections)
• Zonal-based clearing with inter-zonal trade limits
• Reduction to zonal network using nonlinear optimization
• Flexible/modular structure that can be adapted for different market structures and timings
• Automatic import of input data from MySQL database
• Robust and automated interfaces to other Nexus-e modules and update of associated interface input data in eMark
1.4 Capabilities
The following list describes some of the main capabilities of this module:
• Market-based generator scheduling decisions
• Sequential modeling of future market (FuM), balancing market (BaM), and day-ahead market (DaM) clearings
• Multiple zonal market coupling mechanisms: available transfer capacity (ATC)-based, flow-based (FB), mixed
• Endogenously priced and cleared imports and exports between modeled market zones
1.5 Limitations
The following list provides context on some of the main limitations of eMark:
• Treatment of Hydro Dams and Hydro Pumps is limited because future knowledge is not considered in any individual hourly clearing.
• Modeling of reservoirs does not include the full hydrological network and connections between reservoirs and hydro generators.
• Both frequency restoration reserve (FRR) reserve products (i.e. secondary and tertiary reserves) are modeled as a single product.
• No redispatch process is used to translate the market-based clearing into a dispatch that ensures no intra-zonal transmission network violations.
• Hydro pumps currently are not enabled to participate in the reserve markets.
• No nuclear refueling schedules are accounted for.
• No generator ramp limits are considered during the electricity dispatch or reserve procurements.
• No load shedding is allowed.
1.6 Inputs and outputs
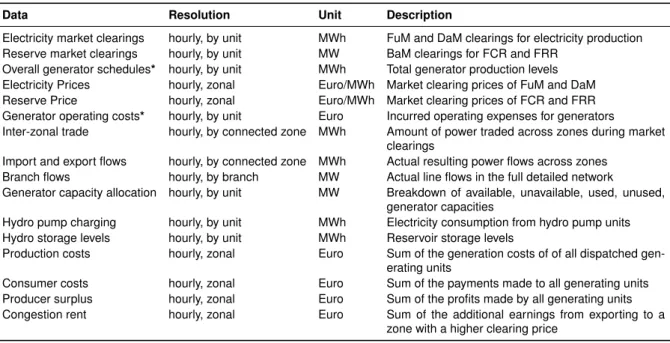
Tables 1 and 2 below list the eMark module’s required input data and resulting output data. Those data that are input from or sent to another module through an interface are noted with an asterisks (*). It is important to note that all input data are pulled from a dedicated MySQL database that is also used by the other Nexus-e modules. This common datasource contributes to increase consistency and transparency among the modules.
Table 1: Listing of required input data for the eMark module.
Data Resolution Unit Description
Generator data* by unit various Location, capacity, costs, operational parameters, etc.
Grid Topology – various Detailed transmission network data (buses, branches, trans- formers)
Demand* hourly, nodal MW Nodal hourly transmission system demand
Renewable power injections hourly, by unit MW Hourly production profiles for hydro-run of river (RoR), wind, and photovoltaic (PV) units
Reserve requirements* hourly, zonal MW Hourly zonal frequency containment reserve (FCR) and FRR requirements
Gen hedge ratios by unit fraction Hedge ratios used to calculate the generator capacities that par- ticipate in the FuM clearing
Load hedge ratios nodal fraction Hedge ratios used to calculate the demand required in the FuM clearing
Hydro generator data by unit various Additional generator data for hydro units: pump capacity, charge/discharge efficiency
Hydro reservoir data by unit MWh Max storage volume, initial storage volume, hourly natural in- flows
Hydro dam monthly levels* monthly MWh Month-ending storage volume levels for hydro dam units Inter-zonal coupling type by connected zones – Defines all zonal connections and the type of market coupling
used for each
NTC limits by connected zones MW Maximum net transfer capacity (NTC) trade limit between each zonal coupling
LTC limits by connected zones MW Maximum long-term transfer capacity (LTC) trade limit between each zonal coupling
Table 2: Listing of resulting output data for the eMark module.
Data Resolution Unit Description
Electricity market clearings hourly, by unit MWh FuM and DaM clearings for electricity production Reserve market clearings hourly, by unit MW BaM clearings for FCR and FRR
Overall generator schedules* hourly, by unit MWh Total generator production levels Electricity Prices hourly, zonal Euro/MWh Market clearing prices of FuM and DaM Reserve Price hourly, zonal Euro/MWh Market clearing prices of FCR and FRR Generator operating costs* hourly, by unit Euro Incurred operating expenses for generators
Inter-zonal trade hourly, by connected zone MWh Amount of power traded across zones during market clearings
Import and export flows hourly, by connected zone MWh Actual resulting power flows across zones Branch flows hourly, by branch MW Actual line flows in the full detailed network
Generator capacity allocation hourly, by unit MW Breakdown of available, unavailable, used, unused, generator capacities
Hydro pump charging hourly, by unit MWh Electricity consumption from hydro pump units Hydro storage levels hourly, by unit MWh Reservoir storage levels
Production costs hourly, zonal Euro Sum of the generation costs of of all dispatched gen- erating units
Consumer costs hourly, zonal Euro Sum of the payments made to all generating units Producer surplus hourly, zonal Euro Sum of the profits made by all generating units Congestion rent hourly, zonal Euro Sum of the additional earnings from exporting to a
zone with a higher clearing price
2 Related work and contributions
2.1 European market structure
By introducing liberalized electricity markets, energy costs on the wholesale level have decreased over the years. This is due to the competition that market players face and the transparency that markets establish. Currently, there are three market types that are active around Europe. For each market type the network codes [1, 2, 3] were specified from ENTSO-E that the European Commission put into force and serve as a legal framework for the European transmission system operators (TSOs)). As depicted in Fig. 1 the following markets1exist in European Countries:
the existing imbalance netting projects to a single coordinated balancing area for im- balance netting in continental Europe and to create a governance structure for imple- menting regional and European integration models to be used for all processes.
In addition, in 2015 ENTSO-E has finalised the general methodology for cost-benefit analysis and the specific methodology for the cost-benefit analysis on the imbalance settlement period. ENTSO-E has also started the cost-benefit analysis on the imbalance settlement period in order to have results ready in time for the European Commission’s impact assessment in March 2016. ENTSO-E has decreased the proposed number of stand- ard products for manual frequency restora- tion reserves and replacement reserves to six, whilst conducting a study on the automatic frequency restoration reserves process.
Implementing Connection Codes In 2015 all three connection codes – require- ments for generators, demand connection and high voltage direct current – were approved by the European Commission in comitology. Their entry into force is expect- ed by mid-2016. From that moment onwards, the leading role in the implementation of the three codes will be at the national lev- el. Implementation must take place within three years, two years being allocated to implementation at the national level and one to allow manufacturers, producers and consumers to comply with the requirements.
ENTSO-E’s role in the implementation pro- cess is the publication of the implementation guidelines, within six months of the entry into force of each code. ENTSO-E interact- ed with all the interested stakeholders as early as December 2015, in order to define the relevant topics for the implementation guidelines.
FORWARD MARKETS ELECTRICITY MARKETS
DAY-AHEAD
MARKET INTRADAY
MARKET BALANCING MARKET
EACH MARKET HAS ITS CODE
FORWARD CAPACITY ALLOCATION
CAPACITY ALLOCATION AND CONGESTION MANAGEMENT
ELECTRICITY BALANCING
2 days 1 day 30 minutes Real-time
1. THE RULES OF THE GAME
22 | ENTSO-E | Electricity without borders
Figure 1: Current market structure in Europe [4].
Forward Markets are markets where consumers or producers can buy or sell long-term contracts. This market is intended to hedge the price risk against decreasing/increasing prices for producers and consumers. Contracts can be traded over-the-counter (OTC) or over clearing houses. To ensure transparency and eliminate the counter party risk, standardized forward contracts (futures) are traded over future exchanges such as the European Energy Exchange (EEX). Futures specify a certain delivery period and the amount of energy to be delivered in this period and their underlying is the spot market price. In Europe, base and peak products are available. Cross-border trading can be realized by yearly or monthly transmission rights auctions.
Day-ahead and Intraday Markets are auction-based spot markets in which buy and sell orders are composed into demand and supply curves. The market is cleared by matching the supply and demand curve. The intersection of the curves determines the market clearing price (MCP). In Europe, the European Power Exchange (EPEX) spot markets are established for different market zones. A three-stage optimization problem is solved [5] to clear the market. This allows the consideration of complex orders. Finally, cross-border trading can be realized by either implicit or explicit transmission rights auctions.
Balancing Markets are run by the TSOs to support the grid security. Each TSO procures balancing capacity to make the power system secure against load and generation forecast errors and contin- gencies by using pay as bid auctions. There is a three-stage operating scheme that protects and restores the system from such events. Each stage represents a service that is put on the market and can also be traded across the border.
1All market types use auction-based clearing techniques that will be described in Section 3.1.
2.2 Literature review
Related to the introduced European market structure, the following sources were instrumental in devel- oping the methodology employed in the eMark module:
• The book by Skantze and Ilic [6] conveys the fundamental differences between electricity and other traded commodities, and the impact these differences have on valuation, hedging and operational decisions made by market participants. The optimization problems associated with these decisions are formulated in the context of the market realities of today’s power industry, including a lack of liquidity on forward and options markets, limited availability of historical data, and constantly changing regulatory structures.
• The report from the Nominated Electricity Market Operator (NEMO) committee [7] provides back- ground details on the difference between ATC and FB market coupling mechanisms along with details of market orders (complex orders, block orders, and merit orders). The welfare maximiza- tion problem is also presented in detail.
• The documentation from a group of European TSOs and power exchanges [5] explains the basics of FB market coupling along with a compiled explanation for how ’intuitive’ FB works.
• The journal paper by Bergh [8] presents a thorough description of the FB market coupling concepts and definitions currently used in the Central Western Europe (CWE) region of Europe. The aim to for this detail to serve as a starting point for further research into the methodology and its market impact.
• The feasibility report from a group of European TSOs and power exchanges [9] is the first report detailing the development, evaluation, and improvements made over an eight year period when the FB market coupling for the CWE region was being created. It includes a feasibility report for the FB operation based on experimentation with the 2011 conditions.
• A report by Belgian Federal Commission for Electricity and Gas Regulation (CREG) [10] provides evidence-based criticism related to concerns raised by national regulators, Agency for the Coop- eration of Energy Regulators (ACER) and numerous other stakeholders. The report assesses the impact of discretionary actions taken by TSOs on the design and the functioning of the CWE DaM FB market coupling.
3 Detailed module description
This Section details the modeling aspects and algorithms that are used within the eMark module for the Nexus-e project. Section 3.1 introduces the basic concepts to describe market clearings and simplifies them to achieve tractable formulations. This is important, since we aim to simulate markets that may consist of a large number of buyers, sellers, buses, lines, and coupled market zones. Next, Section 3.2 presents the optimization framework created to model a sequential set of markets that are connected to other market zones with a similar set of sequential markets. Section 3.3 then describes how these sequential markets are coupled together to mimic the timing of the existing market structure along with the heuristics used to enable modeling of storages that follow seasonal (hydro dams) and daily (hydro pumps) cycles.
3.1 Market clearing
Under the assumption of optimal market operation, we can use the approach of production (cost) based market modeling as introduced in [6]. In principle, this means that the electricity prices are determined by matching marginal cost curves of supply offers with demand bid cost curves.
3.1.1 Modeling of auctions
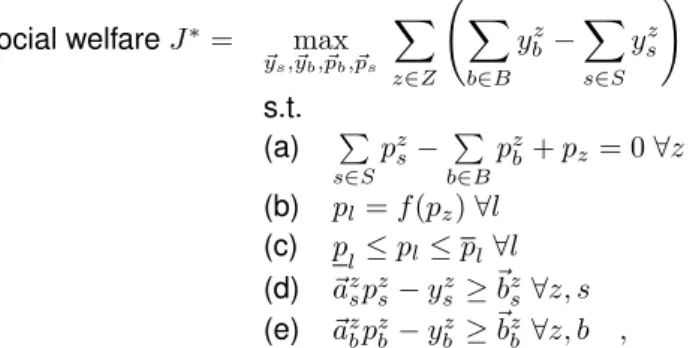
The fundamental goal of an electricity market auction is to maximize social welfare which includes the consumer surplus, supplier surplus, and the congestion rent. For uniform auctions, this is done over power exchanges that collect generation sell offers defined by quantityQzsand price per quantityPszand consumption buy bids defined analogously withQzb, Pszin a given market zonezand clear the market by solving the following optimization problem:
social welfareJ∗= max
~ xs,~xb
X
z∈Z
X
b∈B
xzbQzbPbz−X
s∈S
xzsQzsPsz
!
s.t.
(a) P
s∈S
xzsQzs− P
b∈B
xzbQzb+pznet= 0∀z (b) pl=f(pz)∀l
(c) p
l≤pl≤pl∀l .
(1)
The objective is to maximize the sum of all buy orders and sell orders over all market zonesZ. As dis- cussed in [7] this is equivalent to maximizing the social welfare. The optimization problem (1) is a mixed- integer linear programming (MILP), since the decision variables~xs, ~xb are binary, reflecting the binary status of accepted buy and sell orders [5]. It is also allowed with the equality (1a) to export/import energy indicated bypznet to/from other market zones. The equality (1b) translates the zonal imports/exports to power flowsplbetween the anticipated market zones. The zonal exchanges are limited (1c) and can be constrained in different ways (such as an ATC-based or FB limit).
3.1.2 Continuous offers
In eMark, problem (1) is translated into a less complex linear programming (LP) problem at the cost of loosing the discretized generation set points corresponding to the specific offer quantities and prices of
each generator. Instead, the LP converts the set of offer/price quantities into cost functions. This step is useful to reduce computational complexity. The simplified problem is:
social welfareJ∗= max
~
ys,~yb,~pb,~ps
X
z∈Z
X
b∈B
ybz−X
s∈S
ysz
!
s.t.
(a) P
s∈S
pzs− P
b∈B
pzb+pz= 0∀z (b) pl=f(pz)∀l
(c) p
l≤pl≤pl∀l (d) ~azspzs−ysz≥~bzs∀z, s (e) ~azbpzb−ybz≥~bzb ∀z, b ,
(2)
where ysz, yzb are auxiliary variables that together with constraints (2d,e) represent piece-wise affine (PWA) cost functions. As shown in Fig. 2a, we discretize generator cost functions into discrete offer curves. From these representations, we create their PWA counterparts that can be incorporated into a less complex LP clearing.
Offer Curve Supply Cost
Function
Discretizing into bids
PWA Cost Function Qb
Pb ps
cost price = cost/quantity costys
ps a1s a2s a3s b1s
b2s b3s
(a) Supply offer modeling. Any convex cost function is discretized into offers that are further processed into a PWA cost function.
In this way, the MILP problem can be translated in a less complex LP clearing problem.
Offer Curve Demand Cost
Function
Discretizing into bids
PWA Cost Function
−Qb
Pb
−ps
cost
price = cost/quantity
cost−ys
−ps a3s a2s a1s
b1s b2s b3s
(b) Elastic demand bid modeling. Inclusion of elastic demands, such as charging of storage devices, is modeled in the same way as shown as in Fig. 2a except that the supply offers have a negative cost function.
Figure 2: Modeling of offer curves that are incorporated as PWA cost functions in the clearing problems.
3.1.3 Inelastic demand
If the entire demand has to be supplied under all circumstances, the demand curve is said to be inelastic.
In this case, any associated demand bid has to be executed. This assumption can be viewed as a consumer willing to pay an infinite price to supply its demand. Incorporation of such an inelastic demand can be described as follows:
J∗= min
~ ys,~ps
X
z∈Z
X
s∈S
ysz s.t.
(a) P
s∈S
pzs−pzd+pz= 0∀z (b) pl=f(pz)∀l
(c) p
l≤pl≤pl∀l (d) ~azspzs−yzs≥~bzs∀z, s ,
(3)
in which the demand bids are replaced by the fixed demandpzd. Note under this circumstance maximizing the social welfare corresponds to minimizing the total generation costs.
3.1.4 Elastic demand
Modeling an elastic demand curve is necessary if flexible units such as storage devices are in the system that can control their power demand. In this case, we can include this feature without changing the problem structure in the same clearing problem (3) by modeling these elastic demand bids as supply offers with negative quantities (see Fig. 2b).
3.1.5 Modeling of market zones and power flows
In this section we introduce a common model that maps the power flows from a detailed grid model to a zonal representation. The line flowsp~lof the detailed network withnllines,nbbuses, andnggenerators can be described by:
~
pl=H~(C~g~pg−~pd), (4) whereH~ ∈Rnl×nbis the power transfer distribution factor (PTDF) matrix,C~g∈Rnb×ng is the generator to bus mapping matrix, ~pg ∈ Rng×1 represents the individual active generator power setpoints, and
~
pd∈Rnb×1is the load vector of the detailed power system. While all market clearings will use a reduced zonal representation of the network (as described below), after any such clearing Equation(4) is used to compute the physical power flows within the detailed network.
To reflect certain price zones, the market clearing problem requires a zonal division with respect to the market participants. Consideringnzprice zones, we define:
~
pnetz =~pgz−~pdz (5)
=C~gz~pg−C~bz~pd, (6) where~pnetz ∈Rnz×1represents the zonal netpositions, ~pgz ∈ Rnz×1 is the zonal aggregated generation and~pdz ∈Rnz×1is zonal demand. We couple the disaggregated generation and load with the generator
to zone mapping matrixC~gz ∈ Rnz×ng and the load to zone mapping matrixC~bz ∈ Rnz×nb as shown in (6).
Under a purely ATC coupled market design, the zonal net positions can be expressed as a function ofnccrossborder exchangesp~t∈Rnc×1as follows:
~
pnetz =C~ftz~pt, (7)
whereC~ftz∈Rnz×nc is the contract path to zone mapping matrix.
FB market coupling allows better utilization of the total cross-border transmission capacity, since the flow approximations tend to be less conservative than the ATC values. To enable this coupling, a network reduction method is required that condenses the market zones to a smaller network model [11].
The transmission rights allocation is handled implicitly within the market clearing. The congestion rent is distributed to the TSOs by using the price differences between the market zones. At the moment only the CWE region is FB coupled. However, this might change and therefore we also have the possibility to have mixed configurations of ATC and FB market clearing.
In the FB market design, the generation shift keyss (GSKs) are needed to describe the impact of the individual generation setpoints on the zonal net position. The GSKs are determined by the TSO two days before (two-day-ahead congestion forecast (D2CF) base case [9]) and are estimated based on the predicted market outcome. Here, we map theGSK ∈Rnb×nz matrix directly with the zonal generation as follows:
C~g~pg≈GSK~pgz. (8)
By inserting the definitions (8) and (5) into (4) the expected line flows are:
~
pl≈H GSK ~~ pgz−H ~~pd (9)
≈H GSK~ (~pnetz +~pdz)−H ~~pd (10)
≈H GSK ~~ pnetz + (H GSK ~~ Cbz−H~)~pd. (11) Equation (11) describes the impact of the zonal net position on the line flows and is needed to cor- rectly represent the FBB domain [7, 8]. Note that in this formulation the D2CF base case is inherently considered, such we do not need to explicitly model the D2CF base case.
ENTSO-E is currently composed of numerous market zones with some ATC-based coupling and some FB coupling. eMark is structured to enable simulation of all ATC-based coupled market zones, all FB coupled market zones, and mixed ATC-based and FB coupled market zones. In this way, eMark will be able to reflect the current mixture of market coupling mechanisms as well as possible future enhancements.
3.1.6 Performance indicators
In this section we introduce different performance indicators that allow us to compare market designs.
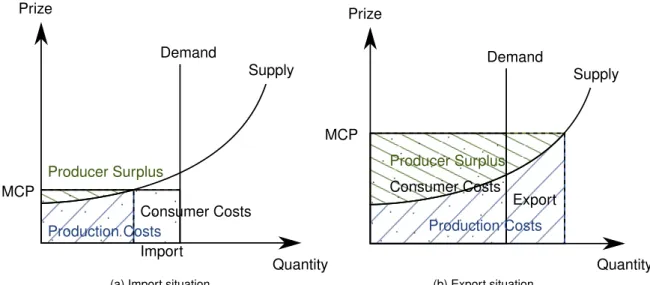
Figure 3 shows typical market clearings for one market zone in an import (a) and export (b) situation.
In the illustrations the MCP is the cross section between the supply curve and the inelastic demand
costs depicted as the blue shaded areas, the consumer costs shown as the black dotted areas and the production surplus illustrated with the green shaded areas. The congestion rent is not shown, but would be illustrated in Figure 3(b) by the total export quantity times the difference in the MCPs between the two zones (congestion rent is only non-zero when the congestion between the two zones results in a price difference between zones). The quantities are defined as follows:
The production costs of a given market zone are defined as the generation costs of all dispatched generation units. Note that the total production costs correspond to the overall social welfare if a) we sum up all generation costs over all market zones and b) we consider inelastic demands.
The consumer costs are defined as the zonal demand multiplied with the MCP and represent the total payments that are made to the operating generators.
The producer surplus corresponds to the profits earned by generators (revenue above operating costs) and is defined as the zonal power generation multiplied with the MCP minus the production costs.
The congestion rent is defined as the amount of export traded multiplied by the price difference be- tween zones. This value represents the additional earnings one zone received from selling power to another zone that has a higher MCP.
Supply
Producer Surplus
Consumer Costs MCP
Demand Prize
Production Costs
Quantity Import
(a) Import situation
Supply
Producer Surplus Consumer Costs MCP
Demand Prize
Production Costs
Quantity Export
(b) Export situation
Figure 3: Market clearing for one market zone in two situations. The MCP is the cross section between the supply curve and the inelastic demand shifted around the zonal net position (import or export).
Combining these metrics with other results from an eMark simulation will provide a range of useful results metrics to evaluate the market-based dispatch and compare various scenarios. Other useful results include the hourly generator schedule (i.e. dispatch), the generator operating costs, the market prices, the curtailment of non-dispatchable generators, the import and export between market zones, and the transmission line flows.
3.2 Modeling of sequential markets
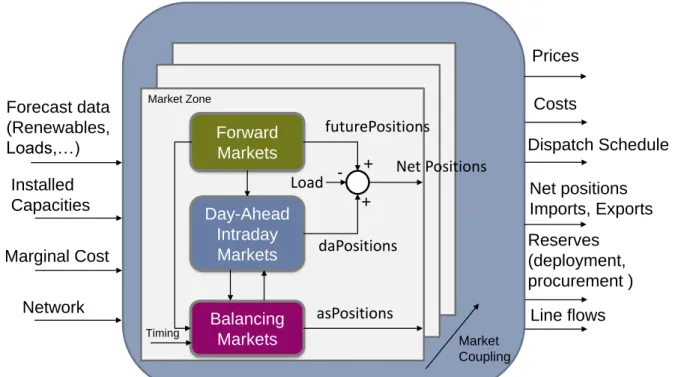
In this section we present a model that is able to describe a sequential electricity market structure.
Figure 4 shows the considered market stages with their interactions. Each market zone has a forward, day-ahead and balancing market stage. The market zones interact with each other (i.e. imports or exports) through coupling mechanisms such as an ATC trade limit.
Market Zone
Forward Markets
Day-Ahead Intraday
Markets
Balancing
Markets Market
Coupling Timing
Costs
Reserves (deployment, procurement )
Net positions
Imports, Exports
Forecast data(Renewables, Loads,…)
Marginal Cost
+ - +
Prices
Dispatch Schedule
Installed Capacities
Network Line flows
Net Positions futurePositions
daPositions Load
asPositions
Figure 4: Interaction of the considered markets in Nexus-e.
3.2.1 Futures market
Since a significant share of electricity is traded over forward contracts, it is necessary to model this stage.
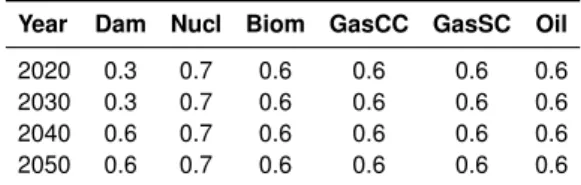
In eMark, a FuM clearing is modeled to capture forward contracts, since it is a good approximation to price forward contracts. The FuM clearing is solved for each month with all FuM generator injections assumed to be constant over all hours of a given month. Prior to running the FuM clearing, a spot market simulation (equivalent to the hourly day-ahead clearing) is run for the full month to initialize some of the expected production levels. For this initialization, the full hourly zonal loads are used along with all available generator capacities. From the results of this spot market clearing, the average hourly production level of each generatorpgsp and the average hourly load for each nodepdspare computed for each month. The average production levels are multiplied by the user-defined generator hedge ratios
~hgfu to compute the generator supply capability~cfu for the FuM clearing (12). Similarly the average load quantities are multiplied by load hedge ratios~hdfu to compute the FuM load positions~pdfu(13). Tables 3, 4 and 5 list the values implemented for the generator and load hedge ratios for the various zones and years simulated.
~cfu=pgsp~hgfu (12)
~
pdfu =pdsp~hdfu (13)
Using the computed FuM generator capabilities and load requirements from the spot market initial- ization, the FuM clearing problem will determine the optimal future generation setpoints~pgfuthat minimize the total generation costs. Only dispatchable generators are allowed to offer capacity in the FuM clear- ing (hydro-RoR, wind and PV generators do not offer any capacity in the FuM clearing). Additionally, all
Table 3: Swiss generator hedge ratios by generator type. These ratios are utilized in the determination of how much capacity generators offer in the FuM clearing. The Dam hedge ratios change over time to help account for the loss of capacity participating in the FuM because of the nuclear phaseout.
Year Dam Nucl Biom GasCC GasSC Oil
2020 0.3 0.7 0.6 0.6 0.6 0.6
2030 0.3 0.7 0.6 0.6 0.6 0.6
2040 0.6 0.7 0.6 0.6 0.6 0.6
2050 0.6 0.7 0.6 0.6 0.6 0.6
Table 4: Non-Swiss generator hedge ratios by generator type. These ratios are constant over all years simulated.
Years Dam Nucl Biom GasCC GasSC Oil Lign Coal
2020-2050 0.3 0.6 0.6 0.6 0.6 0.6 0.6 0.6
charging/discharging operating behavior is not conducive to providing continuous power injections over all hours of a month. The monthly structure of the FuM is modeled such that any generator injecting power is set to inject the same amount of power over all hours of the month cleared. This monthly behavior enables a single optimization to represent the clearing problem for all hours of the month. The FuM clearing problem is given by:
J∗(~cfu, LT Cmin, LT Cmax, ~pdfu) = min
~ yfu,~pgfu,~pt
~1T~yfu s.t.
(a) −C~gz~pgfu+C~ftz~pt=−C~bz~pdfu (b) LT Cmin≤~pt≤LT Cmax
(c)
~a1 ~0 . ..
~0 ~ang
| {z }
A~g
~
pgfu−~yfu ≥
~b1
...
~bng
| {z }
~bg
(d) ~0≤~pgfu≤~cfu ,
(14)
whereLT Cmin andLT Cmax represent the contractual long term transmission rights to be utilized for cross-border trading. These limitations are the equivalent of an ATC-based zonal coupling for the FuM clearing and all zones are coupled in this way during the FuM clearing. Values implemented for the LT Climits can be found in Table 6 for each modeled From-To zone border. The vectors~ai,~bi ∈Rnbi×1 define the PWA marginal cost segments fornbi bids. The equality constraint (14a) represents power balance, where cross-border trades can be included by the cross-border flows~pt between the market zones. Constraint (14b) bounds the cross-border flows and (14c) includes the epigraph formulation for the PWA marginal cost functions. The inequality (14d) bounds the generator setpoints. Note that~aiis a Table 5: Load hedge ratios by market zone. The Swiss load hedge ratio is reduced in the 2040-2050 case to help account for the loss of nuclear capacity participating in the FuM.
Years CH AT DE FR IT 2020-2030 0.3 0.3 0.3 0.3 0.3 2040-2050 0.2 0.3 0.3 0.3 0.3
function of~cfu.
Table 6: LTC trade limitations between market zones in megawatt (MW). These FuM zonal trade limits were based on data from the ENTSO-E Transparency Platform for the explicit transmission allocation of month-ahead transfer capacities [12].
FROM
CH AT DE FR IT
TO CH — 160 300 200 650
AT 450 — 5000 — 70
DE 1200 5000 — 1000 —
FR 200 — 600 — 700
IT 800 110 — 990 —
3.2.2 Balancing market
Until recently, Switzerland operated a pay-as-bid BaM but has now shifted the BaM to be based on a uniform auction. In eMark, the BaM is modeled as a uniform auction even though some of the historical years simulated during the validation phase still operated during the pay-as-bid auction mechanism.
However, modeling these past years as a uniform auction is appropriate since the expected payments in a uniform price procurement auction will be the same as the expected payments in a pay-as-bid auction under the assumption that all bidders have perfect knowledge [13]. Currently, eMark only includes the BaM clearing for the Swiss zone since this is the focus of the analysis, but the same clearing problem can be solved separately to as many zones as desired assuming no zonal trading of reserve products.
Additionally, eMark considers two balancing market products: the FCR and the FRR. FCR is modeled as a symmetric product (meaning the positive and negative requirements are equal) with specified hourly requirements that are constant over each weekly period. FRR is modeled similarly with constant weekly requirements but with a non-symmetric positive and negative requirement (i.e. the positive and negative requirement can be different in a given week). Each product is cleared over a one week period using available generator capacities that were not already allocated in the FuM clearing. Only generators that are allowed to participate in the FuM are allowed to participate in the BaM. While the positive and negative FRR requirement in any single hour can be provided by different generators, any generator providing FCR must provide an equal amount of positive and negative capacity (i.e. symmetric generator procurement). Additionally, the weekly structure of the Swiss BaM is reflected since any generator supplying any of the BaM products must reserve the associated capacity for all hours of the week (i.e.
the same generators provide the reserve products over the full week). This weekly structure enables a single optimization to represent the clearing problem for all hours of the week. The generic clearing problem for the BaM products determines the optimal reserve power setpoints~pgxin a market zone that minimize the total production costs and is given by:
J∗(~cminx , ~cmaxx , rx) = min
~ yx,~pgx
~1T~yx s.t.
(a) ~1T~pgx=rx (b) A~g~pgx−~yx≥~bg
(c) ~cminx ≤~pgx≤~cmaxx ,
(15)
wherexrepresents the reserve product (either FCR or FRR),~cminx , ~cmaxx are the minimum and maximum generator reserve capability that can be offered andrx is the zonal up or down reserve requirement.
formulation for the PWA marginal cost functions and the inequality (15c) bounds the generator reserve power setpoints.
3.2.3 Day-ahead market
The remaining zonal loads that are not supplied in the FuM will be supplied in the DaM clearing. All generator capacities that are not already allocated in the FuM clearing or BaM clearing along with all non-dispatchable generator injections (hydro-RoR, wind, and PV) are available in the DaM to supply the remaining hourly electricity demand. Additionally, all remaining zonal transfer capacity not used by the power flows of the FuM clearing are made available to allow additional zonal trading in the DaM. How- ever, unlike the FuM, the market coupling that limits the trading of electricity between market zones in the DaM can be set as either ATC-based or FB. The corresponding clearing problem determines the optimal generation setpoints~pgda that minimize the total generation costs. All non-dispatchable generators are included in the DaM clearing with assumed hourly injections based on pre-defined profiles. Curtailments of the non-dispatchable injections is allowed but would generally result in a reduced social welfare since a higher priced generator would most likely be used instead of the curtailed non-dispatchable injection.
Pumped hydro and all other forms of storage are also included in the DaM clearing with their genera- tion(consumption) modeled as positive(negative) priced offers. The DaM clearing is solved separately for each hour of the year. The DaM clearing problem is given by:
J∗(~cminda, ~cmaxda , AT Cmin, AT Cmax, ~Hfb, GSK, ~pdfu, ~pgfu, ~pdda) = min
~
yda,~pnet,fbz ,~pgda,~pt
~1T~yda s.t.
(a) −C~gz~pgda+~pnet,fbz +C~ftz~pt=−C~bz~pdda (b) ~1T~pnet,fbz = 0
(c) H~fbGSK ~pnet,fbz ≥ −0.9~smax−H~fb(C~g~pgfu−~pdfu) + (H~fb−H~fbGSK ~Cbz)~pdda (d) H~fbGSK ~pnet,fbz ≤0.9~smax−H~fb(C~g~pgfu−~pdfu) + (H~fb−H~fbGSK ~Cbz)~pdda (e) A~g~pgda−~yda≥~bg
(f) AT Cmin≤~pt≤AT Cmax
(g) ~cminda ≤p~gda≤~cmaxda ,
(16)
where~pnet,fbz represents the zonal net positions in the FB domain,AT Cmin,AT Cmaxare the minimum and maximum available transfer capacities and~cminda ,~cmaxda are the minimum and maximum supply capabilities.
The equality constraint (16a) represents the zonal power balance, where the FB domain with the ATC domain are coupled by including ATC-based cross-border flows with the termC~ftz~ptand constraint (16f) and FB cross-border flows with the term~pznet,fb. The ATC limits imposed were derived from Swissgrid [14]
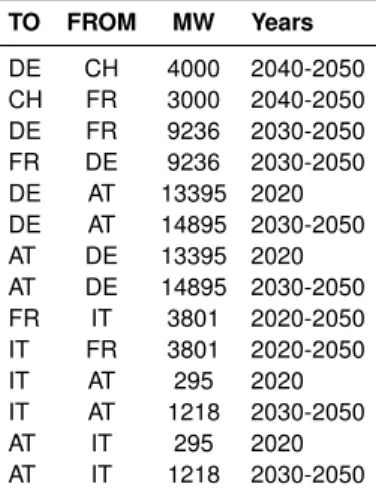
and ENTSO-E [15] data for historical day-ahead NTC values. The ATC will be endogenously calculated by subtracting the FuM cross border flows from the NTC values. Table 7 lists the NTC values utilized in all historical simulations. Some of these NTCs will be increased between 2020-2050 based on already planned cross border transmission expansions [16] and on assumed longer-term enhancements. Table 8 lists all modeled NTC increases and the years these increases occur. Equation (16b) ensures that the power flows in the FB domain are equal and opposite across any two FB coupled market zones (i.e.
FB domain flows going out of one zone are equal to the FB domain flows going into the coupled zone).
Constraints (16c,d) incorporate the FB domain that project the zonal net position with the PTDF matrix H~fb and the GSK matrix to the branch flows. Compared to Equation (11), (16c,d) must additionally account for the impact of the future market positions (~pgfu and ~pdfu) on the line flows as well as set a flow reliability margin (FRM) to 10% of the maximum line capacity~smax. Note that the PTDF matrix H~fb represents the area of all interconnected FB market zones, in which all desired critical branches are specified. Constraint (16e) includes the formulation for the PWA marginal cost functions and the inequality (16g) bounds the generator setpoints.
![Figure 1: Current market structure in Europe [4].](https://thumb-eu.123doks.com/thumbv2/1library_info/4424590.1584396/12.892.197.741.434.658/figure-current-market-structure-in-europe.webp)
![Table 6: LTC trade limitations between market zones in megawatt (MW). These FuM zonal trade limits were based on data from the ENTSO-E Transparency Platform for the explicit transmission allocation of month-ahead transfer capacities [12].](https://thumb-eu.123doks.com/thumbv2/1library_info/4424590.1584396/21.892.344.589.307.434/limitations-megawatt-transparency-platform-explicit-transmission-allocation-capacities.webp)