RECENT RESULTS FROM THE OPTICAL REPLICA SYNTHESIZER EXPERIMENT IN FLASH
G. Angelova-Hamberg, V. Ziemann, Uppsala University, Sweden P. van der Meulen, P. Sal´en, M. Larsson, Stockholm University
H. Schlarb, J. B¨odewadt, A.Winter, F. L¨ohl, E. Saldin, E. Schneidmiller, M. Yurkov, DESY S. Khan, DELTA, TU Dortmund
A. Meseck, Helmholtzzentrum Berlin, Germany Abstract
We present very promising recent results from the op- tical replica synthesizer experiment in FLASH where we manipulate ultrashort electron bunches in FLASH with a laser in order to stimulate them to emit a coherent light pulse from which the temporal structure of the electron bunches can be obtained using laser diagnostic (FROG) methods.
INTRODUCTION
Monitoring and tuning the bunch properties are essen- tial for the reliable operation of linac-based SASE free- electron lasers such as FLASH [1], XFEL [2], or LCLS [3].
This need has triggered the development of new diagnos- tic methods based on a transversely deflecting cavity [4]
or electro-optical sampling [5]. The optical replica synthe- sizer (ORS), a complementary scheme that was introduced in Ref. [6], is similar to an optical klystron FEL seeded by an infrared laser as is shown in Fig. 1. In the modulator the interaction of the laser with the transversely oscillating electrons causes an energy modulation. A dispersive sec- tion turns this energy modulation into a density modulation at the wavelength of the light. In a following radiator undu- lator the micro-bunched beam radiates coherently and the emitted light pulse allows to deduce the longitudinal pro- file of the electron beam. Hence the name optical replica synthesizer.
The optical replica pulse is analyzed in a FROG (fre- quency resolved optical gating) device [7], which is based on recording the spectrally resolved auto-correlation. Sub- sequent application of a pulse retrieval algorithm reveals both amplitude and phase of the incident electric field and thus of the longitudinal profile of the electron bunch.
A very compact second harmonic FROG device called Grenouille [8] is available commercially and the traces are analyzed with the VideoFROG [9] software.
The complete system of seed laser, laser transport line, two undulators, the chicane and two optical stations for timing and FROG analysis was installed in FLASH dur- ing a shutdown period in spring 2007. In the remainder of this report we briefly describe the hardware components and the commissioning progress that culminated in the re- cent observation of FROG traces.
HARDWARE
The laser system is located in a newly erected building next to the FLASH tunnel and connected to the accelera- tor tunnel by a pipe through which the laser beam is trans- ported. The laser itself is based on a Erbium-dopedfiber oscillator [10] operating at 1550 nm that is phase-locked to the radio-frequency (RF) system of the accelerator. The phase-lock is accomplished by comparing the phase of the 24thharmonic of the laser oscillator round-trip frequency at 1.3 GHz with the RF signal and adjusting the length of the opticalfiber that is wound on a piezo-crystal by apply- ing a voltage to the crystal. The timing is thus stabilized to about 50 fs. The relative timing of laser and RF can be adjusted by changing the phase of the RF signal with a vector-modulator. The stabilized pulses are amplified and frequency-doubled in a 1 mm PPLN crystal and sub- sequently passed to a Clark-MXR CPA-2001 regenerative Titanium-Sapphire amplifier that is based on chirped-pulse amplification and pumped by a Nd:YAG laser. This sys- tem delivers pulses with a center wavelength of 772 nm, up to 1 mJ energy per pulse and a full-width at half-maximum (FWHM) pulse length down to 150 fs.
To reach the accelerator, the laser pulse travels through a 12 m long laser transport system with remotely controlled motorized mirrors and a two-lens telescope that provides a narrow laser waist in the laser-electron interaction zone in- side the modulator. For diagnostic purposes the laser beam can be reflected back to the laser building with a mirror where the position and size of the laser waist can be mea- sured. With the mirror retracted the laser pulse is injected into the accelerator beam pipe through a back-tangent win- dow located near the second dipole of a dog-leg chicane.
Inside the accelerator beam pipe the laser pulse co- propagates with the electron beam, passes the modulator undulator and is extracted by a silver-coated silicon OTR screen installed in the middle of the four-magnet chicane on thefirst optical station OS1. The optical station accom- modates a camera, photo diodes with 1.5 GHz bandwidth, and a power meter in order to analyze the laser pulse and to determine the relative timing of the laser pulse and the elec- tron beam by observing the laser pulse and the synchrotron radiation pulse from the electron beam generated in the modulator on a photo diode. The electron beam continues to propagate through the radiator undulator and pass a sec- ond optical station (OS2) where the light created at or re-
, Germany
, Germany , Sweden
WEOB02 Proceedings of DIPAC09, Basel, Switzerland
03 Time Resolved Diagnostics and Synchronization 430
Laser
Radiator Modulator
OS2 OS1
Chicane OTRscreen OTR
screen Chicane
Figure 1: Schematics of the Optical Replica Synthesizer.
flected from a silver-coated silicon OTR screen is guided to an optical table. There it is recorded by a Basler A331 cam- era or analyzed with a power meter or the GRENOUILLE which is used to reconstruct the longitudinal intensity pro- file and the phase of the replica pulse. For the ORS exper- iments the electron beam will be directed around the OTR screen on OS2 by a second chicane, as is shown by the thin line in Fig. 1. Alternatively the electron beam can also be directed onto the OTR screen by switching off the chicane in order to observe the coherent radiation stemming from the micro-bunched beam [11]. Both the modulator and ra- diator undulator have 5 periods + 2 correction periods with 0.2 m period length and a peakfield up to 0.45 T. The mag- net gap is 40 mm in order to accommodate 38 mm beam pipe. The modulator is vertically deflecting and the radi- ator is horizontally deflecting which allows separating the vertically polarized laser pulse from the horizontally polar- ized replica pulse generated in the radiator.
EXPERIMENT PREPARATION
We received normally a few experimental shifts every few months to commission the system and careful prepa- ration of the laser system such that the laser oscillator is mode-locked and that the laser timing is phase-locked to the RF is essential. We then continue to carefully flat- ten the electron orbit to below 0.1 mm in the section be- tween the modulator undulator and OS2 and then record the electron position on OTR screens adjacent the modu- lator. Note that normally the modulator is turned off to avoid its synchrotron radiation reaching the downstream OTR screen because that increases the recorded spot size on the screen and reduces the precision of the overlap- finding procedure. Once the electron beam is aligned we inject the laser pulses and direct them onto the same trans- verse position on the OTR screens with mirrors. Once the transverse overlap is achieved we turn on the modu- lator undulator and thefirst chicane and observe the laser pulse and the synchrotron radiation pulse from the modu- lator on the photo-diode on OS1 while the electron beam passes on further downstream. Observing the signal on a fast oscilloscope and adjusting the relative timing between electron beam and laser pulse with the vector modulator we can match the arrival time of electron beam and laser pulse on the photodiode to better than a few 100 ps. Fine- tuning the temporal overlap is done by passing the electron
beam through the OTR screen on OS2, as indicated by the dotted line on Fig. 1, and observing the OTR light as the timing is varied with the vector modulator on a sub-ps time scale. Once the laser pulse and the electron beam over- lap inside the modulator an energy modulation of the elec- tron beam results which is transformed into a density mod- ulation in the chicane. When the micro-bunched electron beam intercepts the screen on OS2 it causes the emission of coherent transition radiation that is enhanced by several orders of magnitude compared to the ordinary OTR light.
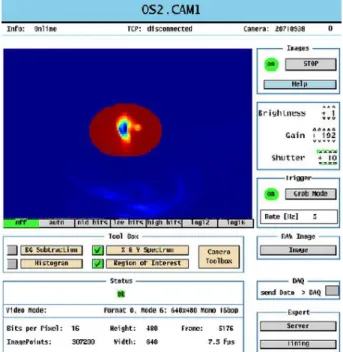
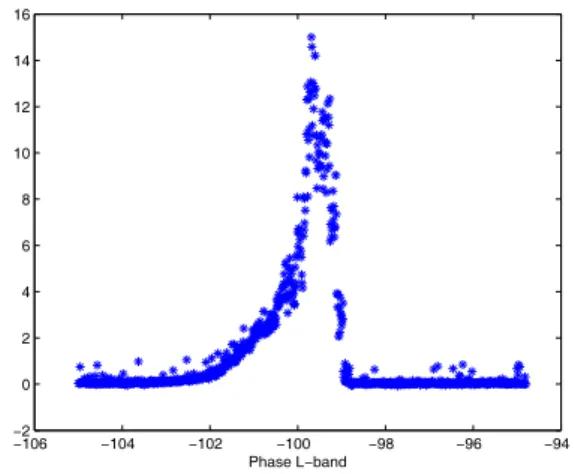
Plotting the average intensity within a ’region of interest’
(the red underlaid spot on Fig. 2) versus the timing clearly indicates the overlap and can actually be used to record the bunch profile and longitudinal-transverse correlations of bunches that are a few pico-seconds long. A typical scan is shown in Fig. 3. Details of the procedure are reported in Refs. [11, 12]. Once the longitudinal overlap is established we turn the radiator undulator on and tune it to resonance.
The electron beam is made to bypass the OTR screen on OS2 by turning on the second four-magnet chicane as is in-
Figure 2: The beam spot on a camera observing the screen on OS2 with the region of interest indicated by the bigger read circle.
Proceedings of DIPAC09, Basel, Switzerland WEOB02
03 Time Resolved Diagnostics and Synchronization
431
−106 −104 −102 −100 −98 −96 −94
−2 0 2 4 6 8 10 12 14 16
Phase L−band
Figure 3: The average intensity within the region of interest as a function of the relative timing between laser pulse and electron beam.
dicated on Fig. 1. In this way the electron bunch propagates further downstream through the SASE undulator and the micro-bunched electron bunches emit a coherent radiation pulse in the radiator undulator that is passed through a set of irises to facilitate the alignment into the GRENOUILLE located on an optical table under the accelerator beam pipe.
RESULTS
During shifts in January and March with 700 and 900 MeV electrons with SASE conditions, i.e. that the bunches are compressed to exhibit a current spike and the SASE undulator lases, we performed the preparatory work elaborated above and after careful alignment of the radiation from the radiator undulator on the input iris of the GRENOUILLE that is controlled by the VideoFROG software [9] we could finally record FROG traces with compressed electron bunch and a laser pulse length of 400 fs (FWHM). The analysis of these traces is under way but incomplete. In particular we were unable record si- multaneous profiles with the transversely deflecting cavity LOLA [4] due to various unfortunate circumstances. More time to do scans of various parameters such as varying the electron bunch length and comparing with simultaneous LOLA measurements or varying the R56 of thefirst chi- cane is definitely needed.
It is noteworthy that during the time the ORS was run- ning and the second chicane around OS2 was turned on such that the electron beam passed through the downstream SASE undulator and also the Far-Infrared undulator [13], which is located downstream of the SASE undulator. We performed initial tests to observe coherent enhancement of the radiation from the FIR undulator when tuned to the bunching wavelength 772 nm of the ORS. This opens up possibilities to mix the coherently enhanced radiation with an external pump-probe laser for timing purposes.
CONCLUSIONS
We have observed and started to analyze thefirst FROG traces from a compressed electron bunch in the optical replica synthesizer experiment in FLASH. Despite gener- ous allotment of beam time we were unable to do care- ful systematic analyses by performing scans with bunches of different lengths because of the rather long experiment preparation time. Fortunately, the promising results have led to the conclusion to relocate the ORS setup with un- dulators and optical tables to the rebuilt sFLASH after the coming shutdown such that there will be further opportuni- ties for experiments.
Support from the FLASH crew during installation and running the experiment is highly appreciated. Extensive financial support from the UU-SU-KTH FEL-center is ac- knowledged.
REFERENCES
[1] J. Rossbach, Observation of self-amplified spontaneous emission in the wavelength range from 80 to 180 nm at the TESLA test facility FEL at DESY,Nucl. Inst. Meth. A475 (2001) 13.
[2] P. Audebert, et.al.,TESLA XFEL: Thefirst stage of the X-ray laser laboratory - Technical Design Report,DESY 2002- 167.
[3] The LCLS Design Study Group,LCLS Design Study Report, SLAC-R-593, 2002.
[4] O. Grimm et al.,Longitudinal bunch shape diagnostics with coherent radiation an a transverse deflecting cavity in TTF2, Proceedings of FEL04, p. 395.
[5] G. Berden, et al.,Electro-Optic Technique with Improved Time Resolution for Real-Time, Nondestructive, Single-Shot Measurements of Femtosecond Electron Bunch Profiles, Phys. Rev. Lett. 93 (2004) 114802.
[6] E. Saldin, E. Schneidmiller, M. Yurkov, A simple method for the determination of the structure of ultrashort relativis- tic electron bunches,Nucl. Inst. and MethodsA 539(2005) 499.
[7] R. Trebino, Frequency Resolved Optical Gating, Kluwer Academic, Boston, 2000.
[8] www.swampoptics.com [9] www.mesaphotonics.com
[10] A. Winter, P. Schm¨user, F. Loehl, H. Schlarb, W. Jalmuzna, Status of the Laser Master Oscillator System at FLASH,Pro- ceedings of PAC07, p. 191.
[11] G. Angelova, et al., Observation of two-dimensional longitudinal-transverse correlations in an electron beam by laser-electron interactions,Physical Review Special Topics - Accelerators and Beams 11 (2008) 070702.
[12] G. Angelova, et.al.,Results from the optical replica experi- ment in FLASH,Proceedings of EPAC08, p. 1332.
[13] M. Gensch et al., New infrared undulator beamline at FLASH,Infrared physics and Technology 51 (2008) 423.
WEOB02 Proceedings of DIPAC09, Basel, Switzerland
03 Time Resolved Diagnostics and Synchronization 432