INVESTIGATION OF BEAM INSTABILITIES AT DELTA USING BUNCH-BY-BUNCH FEEDBACK SYSTEMS
∗M. Höner
†, S. Hilbrich, H. Huck, M. Huck, S. Khan, C. Mai, A. Meyer auf der Heide, R. Molo, H. Rast, M. Sommer, P. Ungelenk, Center for Synchrotron Radiation (DELTA), Dortmund, Germany
Abstract
At the 1.5-GeV electron storage ring DELTA operated by the TU Dortmund University as a synchrotron radiation user facility, bunch-by-bunch feedback systems are in use for electron beam diagnostics and for the suppression of multibunch instabilities. An automatic readout of bunch po- sition data allows a real-time modal analysis during machine operation. An excitation of particular multibunch modes enables the determination of growth and damping times for all modes independently. Further investigations of beam sta- bility and natural damping times of all modes even below the instability threshold have been performed. In addition, first bunch-by-bunch data taken from the booster synchrotron are shown.
INTRODUCTION
In 2011, digital bunch-by-bunch feedback units [1] and their corresponding kicker structures have been installed at the1.5-GeV electron storage ring DELTA (Fig. 1, Table 1) for beam diagnostics purposes [2,3] and to suppress longitudinal coupled-bunch instabilities.
Figure 1: Overview of the DELTA facility including the storage ring and its booster synchrotron (BoDo).
Table 1: Storage Ring Parameters
parameter value
revolution frequency 2.6 MHz
RF frequency 500 MHz
nominal RF power 25 kW
maximum beam current (multibunch) 130 mA maximum beam current (single bunch) 15 mA
synchrotron frequency 15.7 kHz
fractional horizontal tune 0.10
fractional vertical tune 0.28
∗Work supported by the BMBF (05K13PEC).
†markus.hoener@tu-dortmund.de
MULTIBUNCH MODE DIAGNOSTICS
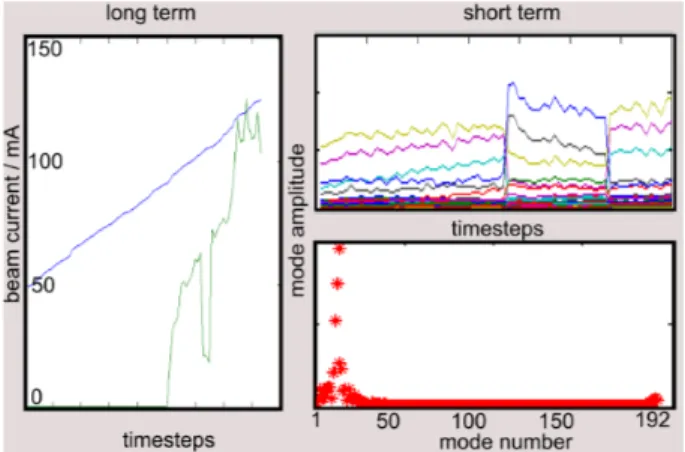
The data acquisition of the feedback units yields the bunch positions of all bunches for several 10 thousand turns in the machine. An FFT allows to calculate the coupled-bunch mode spectrum with a repetition rate of about 0.3 Hz. The longitudinal mode spectrum was made available continu- ously for the machine operator during the injection. Fig. 2 shows the control room interface which consists of a long term visualization of a chosen mode (left), a short-term visu- alization of all modes (right top) and a live mode spectrum (right bottom). In this particular example, the injection pro- cess from a beam current of 50 mA to 120 mA (blue curve) is shown. The data shows a longitudinal instability threshold at about 80 mA. Furthermore, there is a sudden decrease of the mode shown in the left figure during which the am- plitudes of adjacent modes are increased. This might be explained by temperature-dependent detuning of the respon- sible impedance in the machine due to the increasing beam current.
Figure 2: Visualization of the relative amplitudes of longitu- dinal multibunch modes and of the mode spectrum during the injection of the beam into the storage ring.
In standard user operation, the observed longitudinal coupled-bunch oscillation is not suppressed by the bunch- by-bunch feedback system, but by an RF-phase modulation, to increase the lifetime of the electron beam. The bunch- by-bunch feedback systems are used for dedicated machine- characterization measurements and for beam stabilization in dedicated machine shifts, e.g. for laser-induced short-pulse generation [4] which will become a user operation mode in the future.
Preexcitation of Multibunch Modes
A standard example of multibunch mode characterization is a (here longitudinal) grow-damp measurement. Here, the
5th International Particle Accelerator Conference IPAC2014, Dresden, Germany JACoW Publishing
ISBN:978-3-95450-132-8 doi:10.18429/JACoW-IPAC2014-THPME104
THPME104 3486
ContentfromthisworkmaybeusedunderthetermsoftheCCBY3.0licence(©2014).Anydistributionofthisworkmustmaintainattributiontotheauthor(s),titleofthework,publisher,andDOI.
06 Instrumentation, Controls, Feedback & Operational Aspects T03 Beam Diagnostics and Instrumentation
longitudinal FIR-filter coefficients of the feedback controller are phase-shifted by 180◦from damping any oscillations to exciting them. In a standard grow-damp measurement, only the mode with the highest growth rate can be observed since it dominates the entire motion of the beam. To observe the growth rate of all other modes, it is useful to preexcite one of them by coupling in a radiofrequency wave with the desired mode frequency while damping of the feedback is active. This preexcitation is switched off when the FIR-Filter coefficients are phase-shifted. It is switched on again when the FIR-Filter coefficients are back to their normal settings.
Fig. 3 shows grow-damp measurements for two arbitrarily chosen modes. One major disadvantage of this measure-
Figure 3: Grow-damp measurements with a preexcitation of one particular mode in time domain (left) and frequency domain (right).
ment is saturation of the oscillation which may prevent the exponential growth rate to be extracted from this data. Figure
Figure 4: Saturation values of all longitudinal modes in grow-damp measurements after preexciting the respective mode.
Damping Times
In the measurement described here, which was performed below the instability threshold, the FIR filter has a zero gain.
A radiofrequency field with a particular mode frequency ini- tially excites the entire bunch train which is then oscillating in the chosen mode. By switching off the excitation, the beam stabilizes again and the damping times for the excited modes can be determined from an exponential fit . Figure domain and the corresponding mode analysis.
Figure 5: Measurement of the damping time of mode no. 30 in time domain (a) and frequency domain (b) and a corre- sponding exponential fit (c).
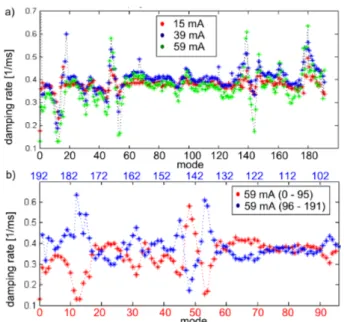
The measurement was performed for all 192 modes and for three different beam currents. The corresponding damp- ing rates are shown in Fig. 6a. As expected from a machine with narrow-band impedance contributions, two correspond- ing modes µandh−µwithhbeing the harmonic number have opposite behavior. While mode µhas a higher damp- ing rate than the average over all modes, modeh−µhas a lower damping rate and vice versa (see Fig. 6b). The residual difference of the damping rates results from the frequency difference∆f =2· fsof these two modes, where fsis the synchrotron frequency. As expected from previous measure- ments, mode 12 has the lowest damping rate, meaning that the beam tends to oscillate in this mode at currents above the instability threshold. A comparison with Fig. 4 in the previous section shows that the saturation values in that measurement reflect the growth rate of the coupled-bunch modes.
Figure 6: Damping rates of all modes for three different beam currents (a). To visualize the opposite behavior of respective pairs of modes the growth rates of modes 0-95 (red) and modes 96-191 (blue) are plotted on a common scale (b).
4 shows the saturation values of every multibunch mode.
5 shows this measurement for multibunch mode 30 in time
5th International Particle Accelerator Conference IPAC2014, Dresden, Germany JACoW Publishing
ISBN:978-3-95450-132-8 doi:10.18429/JACoW-IPAC2014-THPME104
06 Instrumentation, Controls, Feedback & Operational Aspects T03 Beam Diagnostics and Instrumentation
THPME104 3487
ContentfromthisworkmaybeusedunderthetermsoftheCCBY3.0licence(©2014).Anydistributionofthisworkmustmaintainattributiontotheauthor(s),titleofthework,publisher,andDOI.
Inter-bunch Coupling
By reducing the fraction of bunches with which the feed- back system interacts, the coupling of excited bunches to not-excited bunches can be studied. First examples were shown in [3]. Figure 7 shows two example measurements. In case (a), a large fraction of the bunch train is under feedback control and while performing a grow-damp measurement, the other bunches oscillate only for a short period of time. A smaller fraction of bunches is under feedback control in case (b), while the other bunches oscillate permanently. In both cases the oscillation maxima of the other bunches, which were not affected by the feedback, are delayed by several milliseconds compared to the oscillation maxima of the in- tentionally excited bunches.
Figure 7: Longitudinal grow-damp measurements, at which the feedback system excites and damps only the indicated buckets of the multibunch train.
To understand the coupling mechanism, simulations in- cluding the longitudinal phase-space oscillation, beam- cavity interaction and beamloading compensation through slow cavity feedback loops have been performed. Similar simulations are described in detail e.g. in [5, 6]. Figure 8 shows simulated data, corresponding to the measurements above. Since the higher-order mode (HOM) spectrum of the DELTA cavity is not sufficently known, HOM data for a DORIS-type cavity from [7] were used. The simulations can reproduce the delayed oscillation of the other bunches only when the HOMs of the cavity are included in the calculation.
However, the delay values of the oscillation maxima in the simulation differ from the measurements, which might be explained by the used HOM spectrum.
Figure 8: Simulations of a grow-damp measurement, where the feedback system interacts only with the indicated buckets of the multibunch train (a,b).
BUNCH-BY-BUNCH DATA FROM THE SYNCHROTRON
Since the bunch-by-bunch feedback system is an excellent tool for fast acquisition of bunch position data, it was con- nected to a beam position monitor of the booster synchrotron (BoDo). For this purpose, the internal FPGA configuration was changed to run with the BoDo harmonic number of 84.
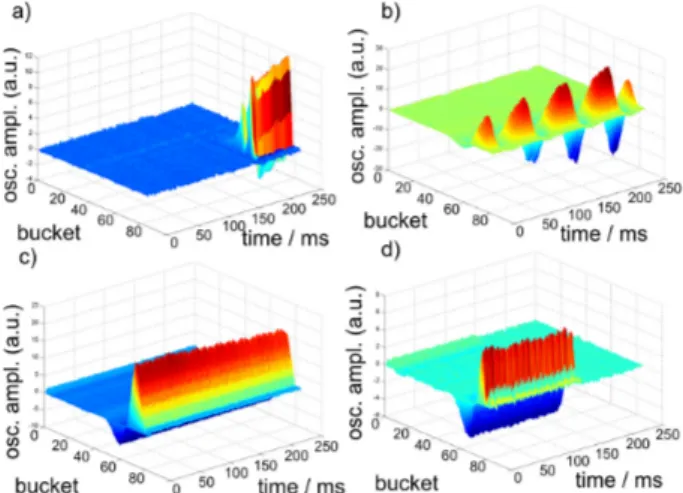
To acquire bunch oscillation data over the entire ramping process, which is about 7.2 s (including ramp-down time), the feedback units were triggered by the extraction trigger of the synchrotron and this trigger was delayed to scan the entire ramping process with turn-by-turn precision. Figure 9 shows the beam position over 250 ms for four different delays during the ramping cycle, which correspond to the injection into the synchrotron from the linac (a), the actual synchrotron ramping process (b), circulation of the beam af- ter ramping (c) and extraction to the DELTA storage ring (d).
During the ramping of the booster, strong phase oscillations are observed.
Figure 9: Beam position data during one ramping cycle of the booster Synchrotron (BoDo) at the injection (a), during the ramp (b), after the ramp (c) and at extraction (d).
ACKNOWLEDGMENT
It is a pleasure to thank our colleagues at ANKA, BESSY, ELSA, DELTA and the Faculty of Physics of the TU Dort- mund University for their continuous support. The project has profited strongly from the expertise of D. Teytelman (Dimtel Inc.).
REFERENCES
[1] Dimtel Inc. http://www.dimtel.com.
[2] M. Höner et al., Proc. of IPAC 2012, p. 807, New Orleans.
[3] M. Höner et al., Proc. of IPAC 2013, p. 485, Shanghai.
[4] M. Huck et al., these proceedings, WEOAA03, IPAC 2014.
[5] J. Byrd, Proc. of PAC 1993, p. 2349, Washington DC.
[6] S. Khan, Proc. of EPAC 1998, p. 966, Stockholm.
[7] R. Heine, Diploma Thesis, TU Dortmund 2000.
5th International Particle Accelerator Conference IPAC2014, Dresden, Germany JACoW Publishing
ISBN:978-3-95450-132-8 doi:10.18429/JACoW-IPAC2014-THPME104
THPME104 3488
ContentfromthisworkmaybeusedunderthetermsoftheCCBY3.0licence(©2014).Anydistributionofthisworkmustmaintainattributiontotheauthor(s),titleofthework,publisher,andDOI.
06 Instrumentation, Controls, Feedback & Operational Aspects T03 Beam Diagnostics and Instrumentation