ATLAS-CONF-2012-008 02March2012
ATLAS NOTE
ATLAS-CONF-2012-008
March 1, 2012
Search for excited electrons and muons with 5 fb
−1of proton–proton collisions at √
s = 7 TeV with the ATLAS detector
The ATLAS collaboration
Abstract
The ATLAS detector is used to search for excited leptons in the electromagnetic radiative
decay channel `
∗ →`γ. Results are presented based on the analysis of
ppcollisions at a
center-of-mass energy of 7 TeV corresponding to an integrated luminosity of
∼5 fb
−1. No
evidence for excited leptons is found, and limits are set on the compositeness scale
Λas a
function of the excited lepton mass
m`∗. In the special case where
Λ =m`∗, excited electron
and muon masses below 2.0 TeV and 1.9 TeV are excluded at 95% C.L., respectively.
1 Introduction
The Standard Model (SM) of particle physics is an extremely successful theory which has been exten- sively tested over the past forty years. However, a number of fundamental questions are left unanswered.
In particular, the SM does not provide an explanation for the source of the mass hierarchy and the gener- ational structure of quarks and leptons. Compositeness models address these questions by proposing that quarks and leptons are composed of hypothetical constituents named preons [1]. In these models, quarks and leptons are the lowest-energy bound states of these hypothetical particles. New interactions among quarks and leptons should then be visible at the scale of the constituents’ binding energies and give rise to excited states. At the Large Hadron Collider (LHC), excited lepton `
∗production via four-fermion contact interactions can be described by the effective Lagrangian [2]
Lcontact=
g
2∗2Λ
2jµjµ,
where g
2∗is the coupling constant,
Λis the compositeness scale, and
jµis the fermion current
jµ=η
LfLγ
µfL+η
0Lf∗Lγ
µfL∗+η
00Lf∗Lγ
µfL+h.c.+(L
→R),where
fL(
fL∗) is the left-handed (excited) fermion field. For simplicity and consistency with recent searches, the following prescription is used: g
2∗ =4π, η
L =η
0L =η
00L =1, and η
R =η
0R =η
00R =0 such that chiral symmetry is conserved [3][4]. The above ansatz ignores underlying preon dynamics and is valid as long as the mass of the excited leptons is below the scale
Λ. In the well-studied case of thehomodoublet-type `
∗[2, 5, 6], the relevant gauge-mediated Lagrangian describing transitions between excited and ground-state leptons is
LGM=
1 2Λ `
∗Rσ
µν"
g
fτ
a2
Wµνa +g
0f0Y2
Bµν#
`
L+h.c.,where `
Lis the lepton field,
Wµνand
Bµνare the
S U(2)Land
U(1)Yfield strength tensors, g and g
0are the respective electroweak couplings, and
fand
f0are phenomenological constants chosen to be equal to 1.
The
LGMterm allows the decay of excited leptons via the electromagnetic radiative mode `
∗± →`
±γ, a very clean signature which is exploited in this search. For a fixed value of
Λ, the branching ratio B(`∗± →`
±γ) decreases rapidly with increasing `
∗mass. For
Λ =2 TeV,
B(`∗± →`
±γ) is 30% for
m`∗ =0.2 TeV and decreases rapidly to about 2.3% for
m`∗ =2 TeV as the competing decay via contact interaction, `
∗±→`
±ff¯ , dominates the branching ratio in this regime.
Previous searches at LEP [7], HERA [8], and the Tevatron [9] have found no evidence for such excited leptons. For the case where
Λ =m`∗, the CMS experiment has excluded masses below 1.07 TeV (1.09 TeV) for
e∗(µ
∗) at the 95% credibility level (C.L.) based on the study of 36 fb
−1of data [10], whereas masses below 1.87 TeV (1.75 TeV) have already been excluded by ATLAS based on 2 fb
−1of data [11].
2 Analysis strategy
This note reports on searches for excited electrons and muons in the `
∗→`γ channel based on
∼5 fb
−1of 7 TeV
ppcollision data recorded in 2011 with the ATLAS detector [12]. The benchmark signal model
considered is based upon theoretical calculations from Ref. [2]. In this model, excited leptons may be
produced singly via
qq→`
∗` or in pairs via
qq→`
∗`
∗, due to contact interactions. As the cross section
for pair production is much less than for single production, excited leptons are searched for based on
events with ``γ in the final state. All three particles are very energetic, isolated and well separated from one another.
For both the
e∗and µ
∗searches, the dominant background arises from Drell-Yan processes accom- panied by either a prompt photon from initial or final state radiation (Z
+γ) or by a jet misidentified as a photon (Z
+jets). Hence,Z+γrefers to the process giving a high-mass ``γ final state. The dominant
Z+γ background results in the same final state as the signal, whereas
Z+jets background can be suppressed by imposing stringent requirements on the quality of the reconstructed photon candidate. Small contri- butions from
tt¯ and diboson (WW ,
WZand
ZZ) production are also present in both channels. W+jets events, as well as semileptonic decays of heavy flavor hadrons, and multijet events can be suppressed by requiring the leptons and photons to be isolated and thus have a negligible contribution to the total background.
The signature for excited leptons could present itself as a narrow peak in the invariant mass of the
`+ γ system as the width of the `
∗is predicted to be narrower than the detector mass resolution for excited lepton masses
m`∗ .0.5Λ. This peak could be easily resolved from the
Z+γ background. However, it is difficult to identify which of the two leading leptons in the event comes from the `
∗decay. To avoid this ambiguity and improve sensitivity as well, one can search for an excess in the `
+`
−γ invariant mass (m
``γ) spectrum. This approach is effective for the whole
m`∗ −Λparameter space probed as one can search for an excess of events with
m``γ> 350 GeV, which defines a nearly background-free signal region.
A significant change in the analysis strategy with respect to the 2 fb
−1paper [11] is the increase on the requirement for the minimum photon transverse energy from 20 GeV to 40 GeV. The increase of this threshold reduces experimental uncertainties associated with the photon without reducing the sensitivity to high mass excited leptons significantly.
3 ATLAS detector
ATLAS is a multi-purpose detector with a forward-backward symmetric cylindrical geometry and nearly 4π coverage in solid angle. It consists of an inner tracking detector immersed in a 2 T solenoidal field, electromagnetic and hadronic calorimeters, and a muon spectrometer. Charged particle tracks and ver- tices are reconstructed in silicon-based pixel and microstrip tracking detectors that cover
|η|< 2.5 and transition radiation detectors extending to
|η|< 2.0 [13]. A hermetic calorimetry system, which covers
|η|
< 4.9, surrounds the superconducting solenoid. The liquid-argon electromagnetic calorimeter, which plays an important role in electron and photon identification and measurement, is finely segmented. It has a readout granularity varying by layer and cells as small as 0.025
×0.025 in η
×φ, and extends to
|η|< 2.5 to provide excellent energy and position resolution. Hadron calorimetry is provided by an iron-scintillator tile calorimeter in the central rapidity range
|η|< 1.7 and a liquid-argon calorimeter with copper and tungsten as absorber material in the rapidity range 1.5 <
|η|< 4.9. Outside the calorimeter, there is a muon spectrometer which is designed to identify muons and measure their momenta with high precision. The muon spectrometer comprises three toroidal air-core magnet systems: one for the barrel and one per endcap, each composed of eight coils. Three layers of drift tube chambers and/or cathode strip chambers provide precision (η) coordinates for momentum measurement in the region
|η|< 2.7. A muon trigger system consisting of resistive plate chambers in the barrel and thin-gap chambers for
|η|> 1 provides triggering capability up to
|η|=2.4 and measurements of the φ coordinate.
4 Simulated samples
The generation of excited lepton signal samples is based on calculations from Ref. [2] at leading order
(LO) with CHEP 4.5.1 [14] interfaced with P 6.421 to handle parton showers and hadronization
[15, 16], using modified MRST2007 LO [17] parton distribution functions (PDFs). Only single produc- tion of excited leptons is simulated, with the `
∗decaying exclusively via the electromagnetic channel.
The
Z +γ sample is generated with S 1.2.3 [18] using CTEQ6L1 [19] LO PDFs, requiring the dilepton mass to be above 40 GeV. To avoid phase-space regions where matrix elements diverge, the angular separation between the photon and leptons is required to be
R(`, γ) = p(∆η)
2+(∆φ)
2> 0.5 and the transverse momentum (
pT) of the photon is required to be
pγT> 10 GeV. To ensure adequate statistics at large
m``γ, an additional
Z+γ sample is generated with
pγT> 40 GeV, and is equivalent to
∼
300 fb
−1of data. The
Z+jets background is generated with A 2.13 [20], while the
tt¯ background is produced with MC@NLO 3.41 [21]. In both cases, J 4.31 [22] is used to describe multiple parton interactions and H 6.510 [23] is used to simulate the remaining underlying event, parton showers and hadronization. CTEQ6.6 PDFs are used for both backgrounds. To remove overlaps between the
Z+jets and the
Z+γ samples,
Z+jets events with prompt energetic photons are rejected if the photon- lepton separation is such that
R(`, γ)> 0.5. The diboson processes are generated with H using modified MRST2007 LO PDFs. For all samples, final-state photon radiation is handled via
[24].
The generated samples are then processed through a detailed detector simulation [25] based on G4 [26] to propagate the particles and account for the detector response. A large sample of MC minimum bias events is mixed with the signal and background MC events to simulate pile-up from additional
ppcollisions. Simulated events are scaled so that the distribution of the expected number of interactions per event agrees with data.
Although S includes higher-order QCD contributions beyond the
Z+γ Born amplitude, such as the real emission of partons in the initial state, it omits virtual corrections. For this reason, the
Z+γ cross section is calculated at next-to-leading order (σ
NLO) using MCFM [27] with MSTW 2008 NLO PDFs [28]. The theoretical precision of the σ
NLOestimate is
∼6%, and the ratio σ
NLO/σ
SHERPAis used to determine a correction factor as a function of
m``γ. These factors vary from 0.81 to 1.16 for 70 <
m``γ< 1600 GeV. The
Z+jets cross section is initially normalized to predictions calculated at next-to-next-to-leading order (NNLO) in perturbative QCD as determined by the FEWZ [29] program using MSTW 2008 NNLO PDFs. Since the misidentification of jets as photons is not well modeled, the
Z+jets prediction is adjusted at the analysis level using data-driven techniques described below. Cross sections for diboson processes are known at NLO with an uncertainty of 5%, while the
t¯tcross section is predicted at approximate-NNLO, with about 10% uncertainty [30, 31].
5 Data and preselection
The data were collected in 2011 during stable beam periods of 7 TeV
ppcollisions, and correspond to a total integrated luminosity of 4.9 fb
−1(4.8 fb
−1) in the
e∗(µ
∗) channel. For the
e∗search, a calorimeter- only trigger requiring two electromagnetic clusters of energy with
peT> 20 GeV is used to select events.
For the µ
∗search, a single muon trigger with matching tracks in the muon spectrometer and inner detector and
pµT> 22 GeV is used to select events. In addition, events with a muon with
pµT> 40 GeV in the muon spectrometer are also kept. Collision candidates are then identified by requiring a primary vertex with a
zposition along the beam line of
|z|< 200 mm and at least three associated charged particle tracks with
pT
> 0.4 GeV.
The lepton selection consists of the same requirements used in the 2 fb
−1paper [11]. Electron can- didates are formed from clusters of cells in the electromagnetic calorimeter associated with a charged particle track in the inner detector. For the
e∗search, two electron candidates with
peT> 25 GeV and
|η|
< 2.47 are required. Electrons within the transition region 1.37 <
|η|< 1.52 between the barrel
and the endcap calorimeters are rejected. The
mediumelectron identification criteria [32] on the trans-
verse shower shape, the longitudinal leakage into the hadronic calorimeter, and the association with an
inner detector track are applied to the cluster. The electron’s reconstructed energy is obtained from the
calorimeter measurement and its direction from the associated track. A hit in the first active pixel layer is required to suppress background from photon conversions. To further suppress background from jets, the highest
peTelectron is required to be isolated by demanding that the sum of the transverse energies in the cells around the electron direction in a cone of radius
R< 0.2 be less than 7 GeV. The core of the electron energy deposition is excluded and the sum is corrected for transverse shower leakage and pile-up from additional
ppcollisions to make the isolation variable essentially independent of
peT[33]. In cases where more than two electrons are found to satisfy the above requirements, the pair with the largest invariant mass is chosen. To minimize the impact of possible charge misidentification, the electrons are not required to have opposite electric charges.
Muon tracks are reconstructed independently in both the inner detector and muon spectrometer, and their momenta are determined from a combined fit to these two measurements. For the µ
∗search, two muons with
pµT> 25 GeV are required. To optimize the momentum resolution, each muon candidate is required to have a minimum number of hits in the inner detector and to have at least three hits in each of the inner, middle, and outer layers of the muon spectrometer. This requirement results in a muon fiducial acceptance of
|η|< 2.5. Muons with hits in the barrel-endcap overlap regions of the muon spectrometer are discarded because of large residual misalignments. The effects of misalignments and intrinsic position resolution are otherwise included in the simulation. The
pµTresolution at 1 TeV ranges from 10% to 25%. To suppress background from cosmic rays, the muon tracks are required to have transverse and longitudinal impact parameters
|d0|< 0.2 mm and
|z0|< 1 mm with respect to the primary vertex. To reduce background from heavy flavor hadrons, each muon is required to be isolated such that
ΣpT(R < 0.3)/
pµT< 0.05, where only inner detector tracks with
pT> 1 GeV enter the sum. Muons are required to have opposite electric charges. In cases where more than two muons are found to satisfy the above requirements, the pair of muons with the largest invariant mass is considered.
The presence of at least one photon candidate with
pγT> 40 GeV and pseudorapidity
|η|< 2.37 is required. Photons within the transition region between the barrel and the endcap calorimeters are ex- cluded. Photon candidates are formed from clusters of cells in the electromagnetic calorimeter. They include unconverted photons, with no associated track, and photons that converted to electron-positron pairs, associated with one or two tracks. All photon candidates are required to satisfy the
tightphoton definition [34]. This selection includes constraints on the energy leakage into the hadronic calorimeter as well as stringent requirements on the energy distribution in the first sampling layer of the electromag- netic calorimeter, and on the shower width in the second sampling layer. The
tightphoton definition is designed to increase the purity of the photon selection sample by rejecting most of the jet background, including jets with a leading neutral hadron (usually a π
0) that decays to a pair of collimated photons.
To further reduce background from misidentified jets, photon candidates are required to be isolated by demanding that the sum of the transverse energies of the cells within a cone
R< 0.4 of the photon be less than 10 GeV. As for the electron isolation, the core of the photon energy deposition is excluded and the sum is corrected for transverse shower leakage and pile-up. Because the excited lepton simulation predicts that photons are well separated from leptons, we require
R(`, γ)> 0.7. This requirement is effec- tive at suppressing Drell-Yan events with final-state radiation photons which tend to have photons highly collimated with the leptons. Finally, if more than one photon in an event satisfies the above requirements, the one with the largest
pTis used in the search.
The signal search region consists of a sliding lower threshold
m``γ>
m`∗+150 GeV as used in the pre-vious 2 fb
−1search [11]. Additionally, to improve the sensitivity particularly at low
m`∗, background con- tributions from Drell-Yan processes are suppressed further by requiring events to satisfy
m``> 110 GeV.
The relative signal efficiency for these two additional requirements is above 98% for
m`∗ ≥200 GeV.
For the above selection criteria, the total signal acceptance times efficiency (A
×) is
∼55% in the
e∗channel for masses
me∗> 800 GeV. This value includes the acceptance of all selection cuts and the
reconstruction efficiencies, and reflects the lepton and photon angular distributions. In comparison,
A×is
∼30% for
mµ∗> 800 GeV. The lower acceptance in the µ
∗channel is due to the stringent selection of hits in the muon spectrometer aimed at maximizing the
pµTresolution. In particular, the requirements of hits in three layers of the precision chambers reduces the geometrical acceptance.
6 Background determination
All background predictions are evaluated with simulated samples. These include the dominant
Z +γ background, as well as
Z+jets events where a jet is misidentified as a photon. The rate of jet misiden- tification is overestimated in the simulation so the
Z+jets predictions are adjusted to data as described below. Small contributions from
tt¯ and diboson production are also present at low
m``γ. Background from multijet events and semileptonic decays of heavy flavor hadrons are heavily suppressed by the isolation requirements and are negligible in the signal region.
The
Z+jets estimates are adjusted to data in the signal depleted region
m``< 110 GeV. This region represents no more than a few percent of the signal parameter-space for
m`∗ ≥200 GeV. The strategy consists of counting the number of events in data in this control region and comparing it to the MC background predictions. The excess of background events found in the simulation is attributed to the mis-modeling of the rate of jets misidentified as photons, and the number of
Z +jets events is scaled down accordingly. The correction factor for the
Z +jets simulation is determined to be 0.67
±0.07 (0.60
±0.06) for the
e∗(µ
∗) search, where the uncertainty is from the
Z+jets simulation statistics only.
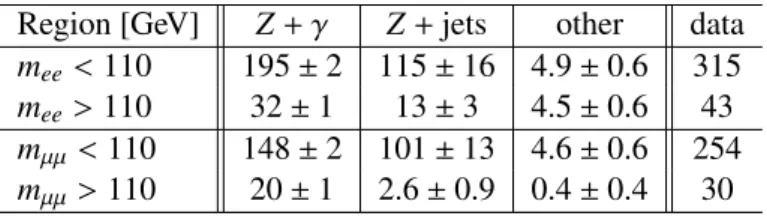
As a result, the number of events in the control region by construction is the same in the MC simulations as in data as shown in Table 1.
Table 1: Data yields and background expectations inside the signal depleted (m
``< 110 GeV) and signal enriched (m
``> 110 GeV) regions after adjusting the
Z+jets background. The uncertainties shown are purely from Monte Carlo statistics.
Region [GeV]
Z+γ
Z+jets other data
mee< 110 195
±2 115
±16 4.9
±0.6 315
mee> 110 32
±1 13
±3 4.5
±0.6 43
mµµ< 110 148
±2 101
±13 4.6
±0.6 254
mµµ> 110 20
±1 2.6
±0.9 0.4
±0.4 30
Comparisons between data and background expectations in the
m``< 110 GeV control region for the
p`T,
pγT,
m`γand
m``γdistributions show a good agreement. No significant discrepancies are observed between data and the simulations. In particular, the background prediction for the photon
pTshape matches the data for both the
e∗and µ
∗searches, which suggests that the tuning of the jet misidentification rate for the
Z+jets background is adequate.
Because a small fraction of the simulated background events survive the
m``> 110 GeV requirement,
the shape of the
Z +γ and
Z +jets backgrounds are individually fitted using an exponential function
exp(P
0+P1×m``γ) over the mass range 150 GeV <
m``γ< 950 GeV. The sum of these two distributions
is used to obtain the total background prediction for
m``γ> 350 GeV. The resulting background estimates
and data yields are shown in Table 2 for the
e∗and µ
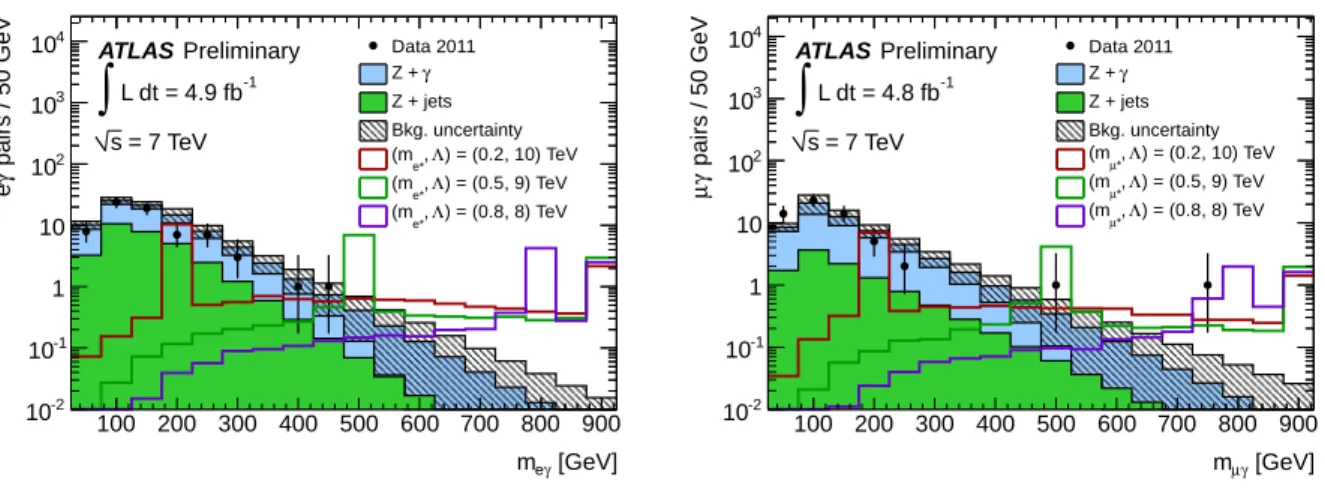
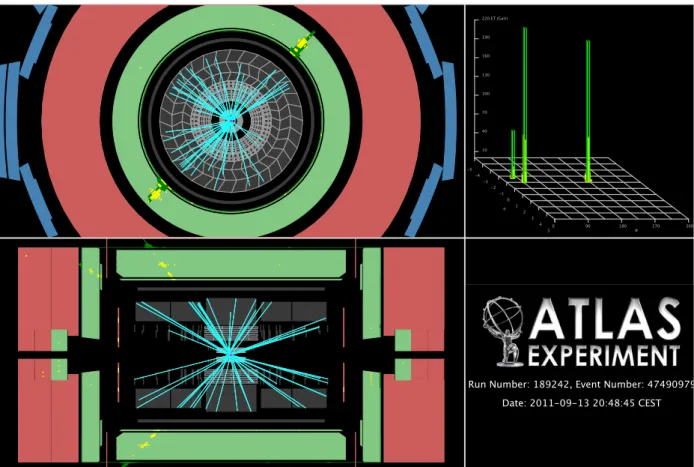
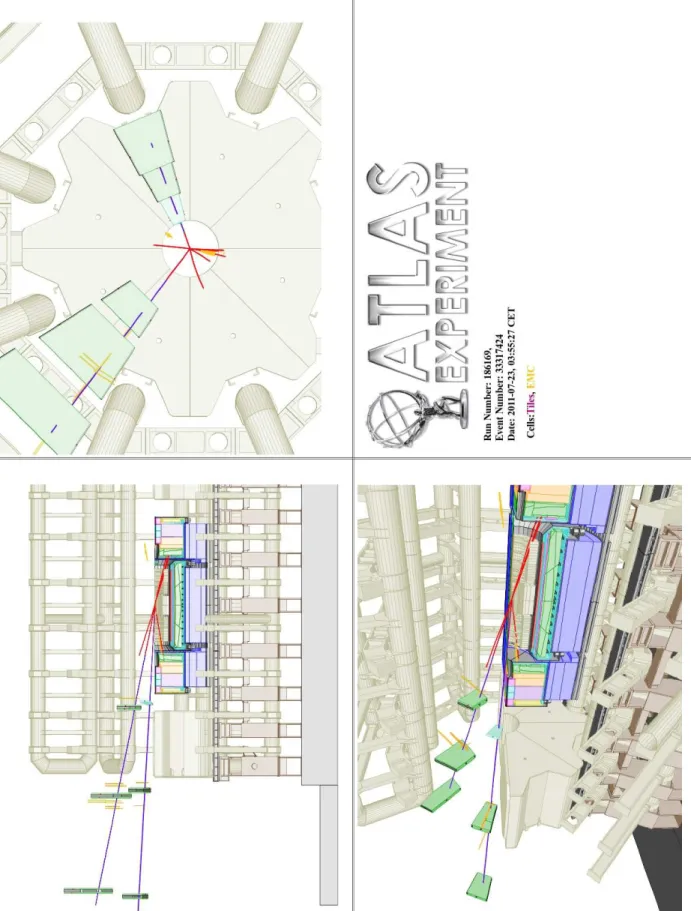
∗searches, as well as in Figs. 1 and 2. Finally,
displays of the events with the highest
m``γinvariant mass are shown in Figs. 3 and 4 for the
e∗and µ
∗search, respectively.
[GeV]
γ
me
100 200 300 400 500 600 700 800 900
pairs / 50 GeVγe
10-2
10-1
1 10 102
103
104 Data 2011
γ Z + Z + jets Bkg. uncertainty
) = (0.2, 10) TeV Λ
,
e*
(m
) = (0.5, 9) TeV Λ
,
e*
(m
) = (0.8, 8) TeV Λ
e*, (m Preliminary
ATLAS
= 7 TeV s
L dt = 4.9 fb-1
∫
[GeV]
γ
mµ
100 200 300 400 500 600 700 800 900
pairs / 50 GeVγµ
10-2
10-1
1 10 102
103
104 Data 2011
γ Z + Z + jets Bkg. uncertainty
) = (0.2, 10) TeV Λ
,
µ*
(m
) = (0.5, 9) TeV Λ
*, (mµ
) = (0.8, 8) TeV Λ
*, (mµ
Preliminary ATLAS
= 7 TeV s
L dt = 4.8 fb-1
∫
Figure 1: Distributions of the invariant mass of the `γ systems for the
e∗(left) and µ
∗(right) channels after requiring
m``> 110 GeV. Combinations with both the leading and subleading leptons are shown.
The expected background uncertainties shown correspond to the sum in quadrature of the statistical uncertainties as well as the uncertainty in the
Z+jets normalization measured in the control region. Note that the last bin contains the sum of all entries with
m`γ> 875 GeV.
[GeV]
γ
mee
200 400 600 800 1000 1200 1400
Events / 100 GeV
10-2
10-1
1 10 102
103 Data 2011γ
Z + Z + jets Bkg. uncertainty
) = (0.2, 10) TeV Λ
e*, (m
) = (0.5, 9) TeV Λ
e*, (m
) = (0.8, 8) TeV Λ
,
e*
(m Preliminary
ATLAS
= 7 TeV s
L dt = 4.9 fb-1
∫
[GeV]
γ µ
mµ
200 400 600 800 1000 1200 1400
Events / 100 GeV
10-2
10-1
1 10 102
103 Data 2011
γ Z + Z + jets Bkg. uncertainty
) = (0.2, 10) TeV Λ
*, (mµ
) = (0.5, 9) TeV Λ
*, (mµ
) = (0.8, 8) TeV Λ
,
µ*
(m Preliminary
ATLAS
= 7 TeV s
L dt = 4.8 fb-1
∫
Figure 2: Distributions of the invariant mass for the ``γ system for the
e∗(left) and µ
∗(right) searches
after requiring
m``> 110 GeV. The
Z+jets and
Z+γ backgrounds were fitted, and the total uncertainties
from the fit as well as the uncertainty in the
Z+jets normalization measured in the control region are
displayed as the hatched area. Note that the last bin contains the sum of all events with
m``γ> 1350 GeV.
Figure 3: Display of the event containing the highest
eeγinvariant mass: 550 GeV. The
pTof the
electrons and photon are: 246, 223 and 74 GeV, respectively. The dielectron mass is 470 GeV,
me1γ =101 GeV, and
me2γ =264 GeV.
Figure 4: Display of the event containing the highest µ
+µ
−γ invariant mass: 890 GeV. The
pTof the
muons and photon are: 91, 84 and 165 GeV, respectively. The dimuon mass is 165 GeV,
mµ1γ =721 GeV,
and
mµ2γ =491 GeV.
7 Systematic uncertainties
In this section, the dominant systematic uncertainties in the
Z+γ and
Z+jets background predictions are first described, followed by a description of the experimental systematic uncertainties that affect both the background and signal yields, and by a discussion of the theoretical uncertainties which affect both the
e∗and µ
∗acceptance.
The dominant systematic uncertainty in the
Z+γbackground comes from the fit of its shape due to the limited number of simulated events with
m``> 110 GeV. This uncertainty increases with
m`∗from about 20% at 200 GeV to 80% for
m`∗> 800 GeV. The second largest uncertainty in the
Z+γ background is of theoretical nature and arises from the NLO computations. This uncertainty includes the renormalization and factorization uncertainties obtained by varying their values by a factor of two around their nominal values as well as uncertainties arising from the PDFs and values of the strong coupling constant α
s. For
m`∗ =200 GeV (m
`∗> 800 GeV), the resulting theoretical uncertainty in the number of
Z+γ background events in our signal region is 7% (10%) for both channels.
The uncertainty in the
Z+jets normalization determined in the
m``< 110 GeV control region is 10%
for both the
e∗and µ
∗channels. This uncertainty includes the uncertainties from luminosity and
Z+γ cross section, as well as statistical uncertainties. Uncertainties in the
Z+jets prediction from the shape of the fitted distribution are added in quadrature to the normalization uncertainty.
Experimental systematic uncertainties that affect both signal and background yields include the un- certainty from the luminosity measurement of 3.9% [35], and uncertainties in particle reconstruction and identification as described below.
The photon identification efficiency and shower shapes in the electromagnetic calorimeter are studied in data using
Z +γ decays with loose lepton-photon separation requirements, such that most of the photons come from FSR. Shower shapes in Monte Carlo simulations are then adjusted such that the resulting photon identification efficiency in the simulation matches the efficiency in data. As a result of this procedure, a 5% (10%) systematic uncertainty is obtained in the photon efficiency for photons with
|η|
< 1.8 (|η| > 1.8). Uncertainties from the mis-modeling of the amount of material inside the inner detector and from pile-up effects are negligible in comparison.
The electron trigger and reconstruction efficiency is evaluated using tag-and-probe techniques with
Z → eeevents. Correction factors are extracted in several η
×φ bins and applied to the simulation. A 1% systematic uncertainty in the electron efficiency at high
pTis assigned. This uncertainty is estimated by studying the electron reconstruction efficiency as a function of the calorimeter isolation criteria.
The calorimeter energy resolution is dominated at high
pTby a constant term which is 1.1% in the barrel and 1.8% in the endcaps. The simulation is adjusted to reproduce this resolution at high energy, and the uncertainty in this correction has a negligible effect on
peTand
pγT. The calorimeter energy scale is corrected by studying
J/ψ →eeand
Z →eeevents. Calibration constants are obtained for several η regions and deviate at most by 1.5% of unity, and have small uncertainties. Thus, uncertainties on the calorimeter energy scale and resolution result in negligible uncertainties in the background and signal yields.
The combined uncertainty in yields arising from the trigger and reconstruction efficiency for muons is estimated to increase linearly as a function of
pµTto about 1.5% at 1 TeV. This uncertainty is dominated by a conservative estimate of the impact of large energy loss from muon bremsstrahlung in the calorimeter which can affect reconstruction in the muon spectrometer. The uncertainty from the resolution due to residual misalignments in the muon spectrometer propagates to a change in the number of events passing the
mµµγcut, and affects the sensitivity of the search. The muon momentum scale is calibrated with a statistical precision of 0.1% using the
Z →µµ mass peak. Thus, uncertainties on the muon momentum scale and resolution result in negligible uncertainties in the background and signal yields.
Finally an additional 1% systematic uncertainty is assigned to the signal efficiency for the case where
m∗` = Λ. This is the scenario where the excited leptons have the largest decay width, about 0.1m`∗
. This uncertainty was obtained by studying the efficiency of the
m``γrequirement at the generator level, by comparing results for various masses and scales
Λ.8 Results
A summary of the data yields and background expectations as a function of a lower bound on
m``γis shown in Table 2 for the
e∗and µ
∗searches. The uncertainties displayed correspond to the sum in quadrature of the statistical and systematic uncertainties. The data appears to be consistent with background only predictions, with minimum observed
p-values of 16% and 5% in thee∗and µ
∗channels, respectively.
Given the absence of a significant exces of events, an upper limit on the `
∗cross section times branching ratio σB is determined at the 95% C.L. using a Bayesian approach [36] with a flat, positive prior on σB. Systematic uncertainties are incorporated in the limit calculation as nuisance parameters.
The limits are translated into bounds on the compositeness scale as a function of the mass of the excited leptons by comparing them with theoretical predictions of σB for various values of
Λ.The expected exclusion limits are determined using simulated pseudo-experiments (PE) containing only SM processes, by evaluating the 95% C.L. upper limits for each PE for each fixed value of
m`∗. The median of the distribution of limits represents the expected limit. The ensemble of limits is used to find the 1σ and 2σ envelopes of the expected limits as a function of
m`∗.
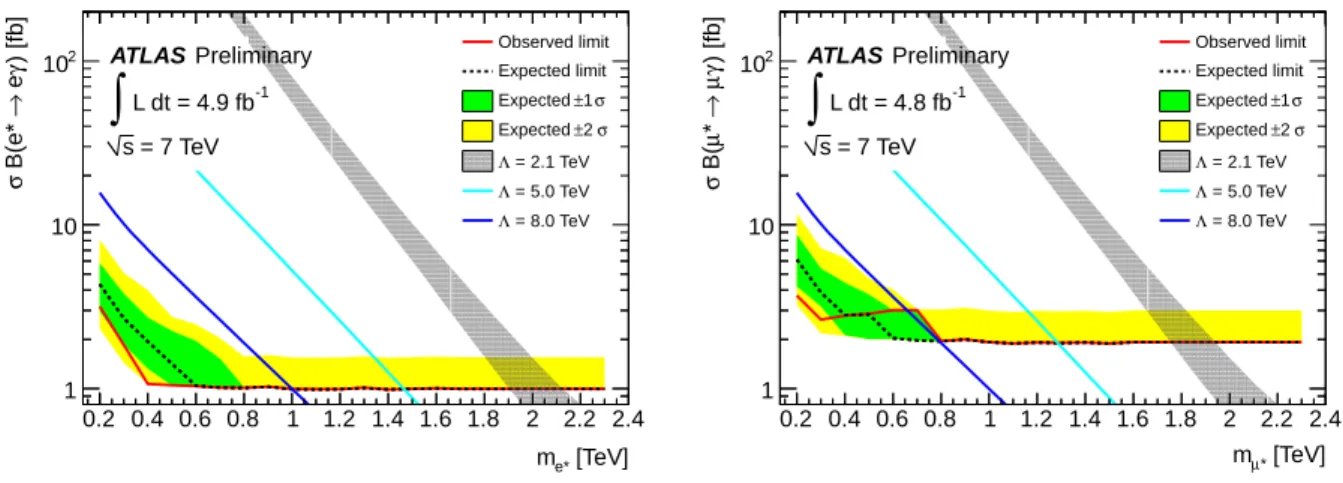
Figure 5 shows the 95% C.L. expected and observed limits on σB(`
∗→`γ) for the
e∗and µ
∗searches.
For
m`∗> 0.9 TeV, the observed limits on σB are 1.0 fb and 1.9 fb for the
e∗and µ
∗, respectively. The green and yellow bands show the expected 1σ and 2σ contours of the expected limits. When the expected number of background events is close to zero, there is a discrete behavior in the the expected limits obtained from the PE, and no downward fluctuation of the background is possible. These effects explain the behavior of the 1σ and 2σ contours of the expected limits for large `
∗masses. Theoretical predictions of σB for three different values of
Λare also displayed in Fig. 5, as well as the theoretical uncertainties from renormalization and factorization scales and PDFs for
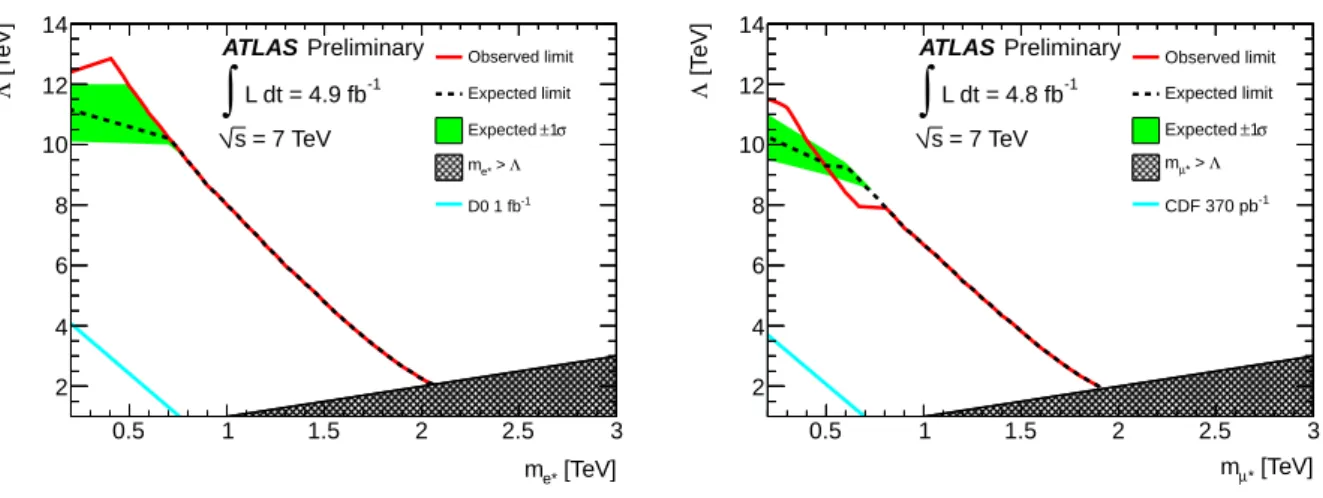
Λ =2.1 TeV. These uncertainties are shown for illustrative purposes only and are not included in determining mass limits. The mass limits obtained for various
Λvalues are used to produce exclusion limits on the
m`∗−Λplane as shown in Fig. 6. In the special case where
Λ =m`∗, masses below 2.0 TeV and 1.9 TeV are excluded for excited electrons and muons, respectively.
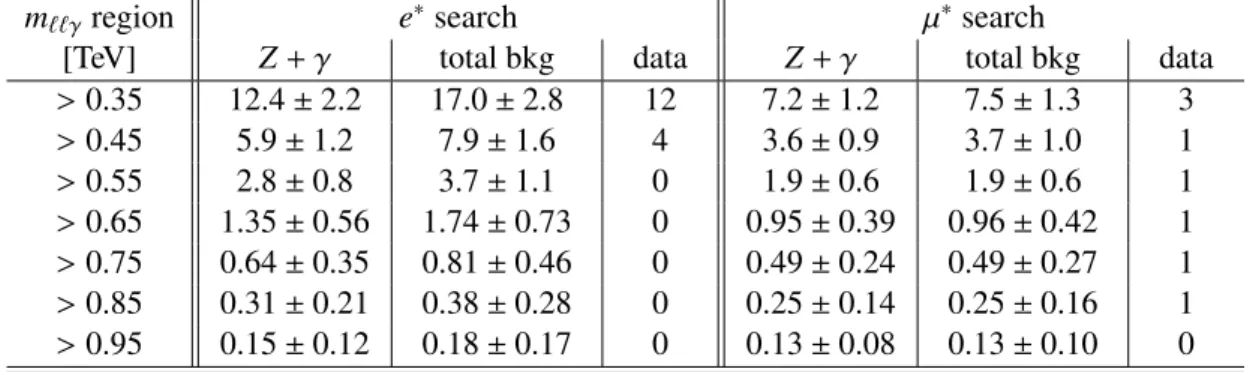
Table 2: Data yields and background expectation as a function of a lower bound on
m``γ=m`∗+150 GeV.The uncertainties represent the sum in quadrature of the statistical and systematic uncertainties.
m``γ
region
e∗search µ
∗search
[TeV]
Z+γ total bkg data
Z+γ total bkg data
> 0.35 12.4
±2.2 17.0
±2.8 12 7.2
±1.2 7.5
±1.3 3
> 0.45 5.9
±1.2 7.9
±1.6 4 3.6
±0.9 3.7
±1.0 1
> 0.55 2.8
±0.8 3.7
±1.1 0 1.9
±0.6 1.9
±0.6 1
> 0.65 1.35
±0.56 1.74
±0.73 0 0.95
±0.39 0.96
±0.42 1
> 0.75 0.64
±0.35 0.81
±0.46 0 0.49
±0.24 0.49
±0.27 1
> 0.85 0.31
±0.21 0.38
±0.28 0 0.25
±0.14 0.25
±0.16 1
> 0.95 0.15
±0.12 0.18
±0.17 0 0.13
±0.08 0.13
±0.10 0
[TeV]
me*
0.2 0.4 0.6 0.8 1 1.2 1.4 1.6 1.8 2 2.2 2.4
) [fb] γ e→ B(e* σ
1 10 102
Observed limit Expected limit σ
±1 Expected
σ
±2 Expected
= 2.1 TeV Λ
= 5.0 TeV Λ
= 8.0 TeV Λ
Preliminary ATLAS
= 7 TeV s
L dt = 4.9 fb-1
∫
[TeV]
µ*
m 0.2 0.4 0.6 0.8 1 1.2 1.4 1.6 1.8 2 2.2 2.4
) [fb] γµ→* µ B(σ
1 10 102
Observed limit Expected limit σ
±1 Expected
σ
±2 Expected
= 2.1 TeV Λ
= 5.0 TeV Λ
= 8.0 TeV Λ
Preliminary ATLAS
= 7 TeV s
L dt = 4.8 fb-1
∫
Figure 5: Cross section
×branching ratio limits at 95% C.L. as a function of
e∗(left) and of µ
∗(right) mass. Theoretical predictions for excited leptons produced for three different compositeness scales are shown, as well as the theoretical uncertainties from renormalization and factorization scales and PDFs for
Λ =2.1 TeV.
9 Conclusions
The results of a search for excited electrons and muons with the ATLAS detector are reported, using a sample of
√s =
7 TeV
ppcollisions corresponding to an integrated luminosity of
∼5 fb
−1. The observed invariant mass spectra are consistent with SM background expectations. Limits are set on the cross section times branching ratio σB(`
∗ →`γ) at 95% C.L. For
m`∗> 0.9 TeV, the observed upper limits on σB are 1.0 fb and 1.9 fb for the
e∗and µ
∗channels, respectively. The limits are translated into bounds on the compositeness scale
Λas a function of the mass of the excited leptons. In the special case where
Λ = m`∗, masses below 2.0 TeV and 1.9 TeV are excluded for
e∗and µ
∗, respectively.
These limits are the most stringent bounds to date on excited leptons for the parameter-space region with
m`∗ ≥200 GeV.
References
[1] J. Pati and A. Salam Phys. Rev.
D10(1974) 275–289.
[2] U. Baur, M. Spira and P.M. Zerwas Phys. Rev.
D42(1990) no. 3, 815.
[3] E.J. Eichten, K.D. Lane and M.E. Peskin Phys. Rev. Lett.
50(1983) 811–814.
[4] Searches for contact interactions with dileptons have been performed at ATLAS and use a similar Lagrangian and choice of parameters, see ATLAS Collab., Phys. Rev.
D84, 011101 (2011); andATLAS Collab., arXiv:1112.4462, submitted to Phys. Lett. B (2012).
[5] K. Hagiwara, D. Zeppenfeld and S. Komamiya Z. Phys.
C29(1985) 115.
[6] N. Cabibbo, L. Maiani and Y. Srivastava Phys. Lett.
B139(1984) 459.
[7] ALEPH Collab., Phys. Lett.
B385, 445 (1996); OPAL Collab., Eur. Phys. J.C14, 73 (2000); L3Collab., Phys. Lett.
B568, 23 (2003); DELPHI Collab., Eur. Phys. J.C46, 277 (2006).[8] Zeus Collab., Phys. Lett.
B549, 32 (2002); H1 Collab., Phys. Lett.B666, 131 (2008).[TeV]
me*
0.5 1 1.5 2 2.5 3
[TeV]Λ
2 4 6 8 10 12 14
Observed limit Expected limit σ
±1 Expected
Λ >
me*
D0 1 fb-1
Preliminary ATLAS
= 7 TeV s
L dt = 4.9 fb-1
∫
[TeV]
µ*
m
0.5 1 1.5 2 2.5 3
[TeV]Λ
2 4 6 8 10 12 14
Observed limit Expected limit σ
±1 Expected
Λ >
µ* m CDF 370 pb-1
Preliminary ATLAS
= 7 TeV s
L dt = 4.8 fb-1