Gerd Sielfeld1,2 , Dietrich Lange3 , and José Cembrano1,2
1Department of Structural and Geotechnical Engineering, Pontificia Universidad Católica de Chile, Santiago, Chile,
2Andean Geothermal Center of Excellence (CEGA‐FONDAP 15090013), Santiago, Chile,3GEOMAR Helmholtz Centre for Ocean Research, Kiel, Germany
Abstract
We examine the intra‐arc crustal seismicity of the Andean Southern Volcanic Zone. Our aim is to resolve interseismic deformation in an active magmatic arc dominated by both margin‐parallel(Liquiñe‐Ofqui fault system, LOFS) and Andean transverse faults. Crustal seismicity provides information about the schizosphere tectonic state, delineating the geometry and kinematics of high strain domains driven by oblique‐subduction. Here, we present local seismicity based on 16‐month data collected from 34 seismometers monitoring a ~200‐km‐long section of the Southern Volcanic Zone, including the Lonquimay and Villarrica volcanoes. We located 356 crustal events with magnitudes betweenMw0.6 and Mw3.6. Local seismicity occurs at depths down to 40 km in the forearc and consistently shallower than 12 km beneath the volcanic chain, suggesting a convex shape of the crustal seismogenic layer bottom. Focal mechanisms indicate strike‐slip faulting consistent with ENE‐WSW shortening in line with the long‐term deformation history revealed by structural geology studies. However, wefind regional to local‐scale variations in the shortening axes orientation as revealed by the nature and spatial distribution of microseismicity, within three distinctive latitudinal domains. In the northernmost domain, seismicity is consistent with splay faulting at the northern termination of the LOFS; in the central domain, seismicity distributes along ENE‐and WNW‐striking discrete faults, spatially associated with, hitherto seismic Andean transverse faults. The southernmost domain, in turn, is characterized by activity focused along a N15°E striking master branch of the LOFS. These observations indicate a complex strain compartmentalization pattern within the intra‐arc crust, where variable strike‐slip faulting dominates over dip‐slip movements.
Plain Language Summary
In active volcanic chains, there is a strong interplay between deformation and volcanism. In this research, we take the“pulse”of active tectonics in a volcanic arc setting by measuring natural seismicity. We installed a network of 34 seismometers over 200 km along the volcanic arc in Southcentral Chile. Our results indicate active faulting in coherence with long‐lived faults and the overall regional‐scale stress regime. In fact, crustal regions in which faults are more active are spatially associated with inherited faults and with higher temperature gradient domains, as inferred from volcanic and geothermal activity. The maximum depth of seismicity is shallow (<12 km) in the central part of the volcanic arc, whereas is much deeper (~40 km) toward the forearc and back‐arc regions. This observation suggests that elevated geothermal gradients lead to a thinner brittle portion of crust, which is then mechanically easier to (re‐)break up. Our results can be used for understanding the way by which faulting interacts with crustal fluids, which in turn may help improving geothermal exploration strategies and seismic hazard assessment.Furthermore, seismicity reveals detailed information on how ongoing deformation accommodates within complex fault systems characterized by different orientations and kinematics.
1. Introduction
Crustal faulting is an end‐member effect of large‐scale tectonic loading. At active magmatic arcs in an obli- que convergence setting, permanent heatflow enhances margin‐parallel rock weakening and consequential transpressional partitioning (De Saint Blanquat et al., 1998; Tikoff & Teyssier, 1994). Upper crust seismic faulting represents a snapshot of instantaneous strain, regarded as stick‐slip frictional instability of preexist- ing faults (Scholz, 1998). This mechanism refers to sudden“slippage”(earthquake) after an interseismic per- iod of elastic strain accumulation or“stick”(Brace & Byerlee, 1966; Byerlee & Brace, 1968), commonly occurring below the critical temperature of Quartz plasticity (~300 °C; Stesky, 1975). Furthermore, crustal earthquakes within magmatic arcs are either purely tectonic, spatially associated with major intra‐arc
©2019. American Geophysical Union.
All Rights Reserved.
Key Points:
• Crustal seismicity in the SVZ of the Andes reveals the nature of active upper crustal faulting consistent with long‐term arc tectonics
• Strain partitioning is
compartmentalized into arc‐parallel (LOFS) and Andean transverse faults (ATF)
• Crustal seismicity occurs at all depths down to 40 km depth in the forearc, but shallower than 12 km along the volcanic chain Supporting Information:
•Supporting Information S1
•Movie S1
•Movie S2
Correspondence to:
G. Sielfeld, ggsielfeld@uc.cl;
gsielfeld@gmail.com
Citation:
Sielfeld, G., Lange, D., & Cembrano, J.
(2019). Intra‐arc crustal seismicity:
Seismotectonic implications for the southern Andes volcanic zone, Chile.
Tectonics,38, 552–578. https://doi.org/
10.1029/2018TC004985 Received 25 JAN 2018 Accepted 14 JAN 2019
Accepted article online 18 JAN 2019 Published online 12 FEB 2019 Corrected 20 MAR 2019
This article was corrected on 20 MAR 2019. See the end of the full text for details.
strike‐slip faults (e.g., La Femina et al., 2002; Weller et al., 2012; White, 1991; White & Harlow, 1993), or have a volcanic component, associated with magmaflux, degassing, and volcanic processes (e.g., Jay et al., 2011;
Manga & Brodsky, 2006; Mora‐Stock et al., 2012; Patanè et al., 2011). Therefore, intra‐arc seismicity may reflect the geometry and kinematics of faults and delimit the crustal seismogenic zone, contributing to the understanding of the tectonic and thermo‐mechanical state of orogenic belts with active magmatism.
In most subduction settings, long‐term oblique convergence slip vectors are partitioned into margin‐parallel and margin‐orthogonal components (e.g., McCaffrey, 1992). A significant portion of bulk transpressional deformation is commonly accommodated in intra‐arc regions, as margin‐parallel shear zones (e.g., Beck, 1983, 1991; Fitch, 1972; Jarrard, 1986; Kimura, 1986; McCaffrey, 1996). In the upper fractured intra‐arc crust, deformation is accommodated as strike‐slip fault systems for about 50% of active oblique convergence set- tings (e.g., Bommer et al., 2002; Jarrard, 1986; White, 1991). Resulting high strain domains are time‐ dependent of the interplay among inherited geological anisotropies, fault growth, and frictional wear of country rock (Cowie & Scholz, 1992; Joussineau & Aydin, 2009; Mitchell & Faulkner, 2009; Scholz, 1987).
Simultaneously, crustalfluid ascent, differentiation, emplacement, and crystallization mechanisms are lar- gely controlled by the geometry, permeability, and kinematics of high strain domains (Acocella & Funiciello, 2010; Cembrano & Lara, 2009; Clemens & Petford, 1999; Cox, 1999; Rowland & Sibson, 2004; Yamaguchi et al., 2011), such as demonstrated for the Sunda, Central‐American, and Andean magmatic arcs (Corti et al., 2005; Iturrieta et al., 2017; La Femina et al., 2002; Sieh & Natawidjaja, 2000; Sielfeld et al., 2017).
Driven by the crustal stress‐field and thermal state, fluid migration within such regions (e.g., Delaney et al., 1986; Nakamura, 1977) may be enhanced by rock‐dilatancy/fluid‐transport mechanisms triggered by shallow seismicity (e.g., Rowland & Sibson, 2004; Scholz, 2002; Sibson et al., 1975).
In the Andean Southern Volcanic Zone (SVZ), in particular along the margin‐parallel Liquiñe‐Ofqui Fault System (LOFS), stratovolcanoes, minor eruptive centers, and geothermal features, are spatially related to the geometry and kinematics of long‐lived faults (Cembrano & Lara, 2009; Sánchez‐Alfaro et al., 2013).
Additionally, for the long‐term geological record, margin‐parallel faults (i.e., LOFS) coexist with second order transverse‐to‐the‐arc oriented faults (Andean Transverse Faults, ATF; Aron et al., 2014; Kaizuka, 1968; Katz, 1971; Melnick et al., 2009; Yáñez et al., 1998; among others), developing a causal relationship with crustalfluid‐flow (Cembrano & Lara, 2009; Pérez‐Flores et al., 2016, 2017; Sánchez‐Alfaro et al., 2013; Tardani et al., 2016; Wrage et al., 2017). Based on kinematic and dynamic analysis of fault‐slip data, Pérez‐Flores et al. (2016) suggest that bulk transpressional deformation is partially partitioned into variable orientations and scales within the Southern Volcanic Zone (SVZ) of the Andean magmatic arc.
Although the present‐day instantaneous crustal stress state and slip partitioning effect in the SVZ remains obscure, no dense, regional‐scale seismic study has been carried out in the SVZ; consequently, only local deployments associated with specific, moderate to large magnitude events, focused on the forearc region, have been undertaken in the LOFS (e.g., Dzierma, Rabbel, et al., 2012; Dzierma, Thorwart, et al., 2012;
Lange et al., 2008; Legrand et al., 2010). In this work, we seek to understand the interaction between crustal faulting, strain partitioning, and compartmentalization in the upper crust of the intra‐arc region of Southern Andes. This will shed light on how a fraction of plate boundary deformation is accommodated in the intra‐
arc region, during one interseismic stage of the subduction earthquake cycle. Therefore, we installed a dense seismic network of 34 stations between Callaqui (38°S) and Mocho‐Choshuenco (~40°S) volcanoes in south- ern Chile in order to obtain a high‐resolution seismicity catalog occurring within an observation time‐
window of ~16 months (i.e., between 6th of March 2014 and 16th of June 2015).
The study region lies in a transitional zone influenced by two overlapping tectonic loading conditions, asso- ciated with two, apparently independent, megathrust seismic cycles. As stated by Sánchez and Drewes (2016), regarding the 2010 MauleMw8.8 earthquake post‐seismic effects, the region encompassed between 37 and 40°S would have undergone compressional surface deformation from March 2010 to April 2015, with the maximum horizontal stress trending N30°E (period of GNSS measurements). Conversely, the region south of 38°S has been undergoing interseismic reloading related to the locking of the 1960 ValdiviaMw
9.5 earthquake rupture zone (Moreno et al., 2009, 2011). The main target of this experiment is to resolve, for a brief tectonic‐time window, the nature and interaction of seismic faulting within (1) long‐lived margin‐parallel strike‐slip fault systems (i.e., LOFS) and (2) long‐lived orogeny‐oblique faults (ATF). Our results contribute to understand the overall link among intra‐arc strain compartmentalization, long‐lived
fault geometries, and seismically active fault kinematics in the framework of an active (Quaternary) volcanic arc.
2. Tectonic Setting of Southern Andes
The Southern Andes are characterized by long‐term partial partitioning of an overall transpressional defor- mation regime arising during interseismic phases of the subduction earthquake cycle (e.g., Arancibia et al., 1999; Cembrano et al., 1996; Lavenu & Cembrano, 1999; Pérez‐Flores et al., 2016). Dextral‐oblique conver- gence between the Nazca and South American plates trends N80°, with an average velocity of ca.
66 mm/year, and mean obliquity of 20° (current convergence vector estimated by Angermann et al., 1999;
Figure 1). The convergence vector direction has been relatively constant over the last 10 Ma (Pardo‐Casas
& Molnar, 1987). Late Miocene‐Pliocene transpressional deformation is well documented byfield structural geology combined with geochronological data (Arancibia et al., 1999; Cembrano et al., 2000, 2002; Lavenu &
Cembrano, 1999; Pérez‐Flores et al., 2016; Rosenau et al., 2006), as well as by geodetic and seismological stu- dies (e.g., Agurto et al., 2012; Haberland et al., 2009; Lange et al., 2008; Legrand et al., 2010; Moreno et al., 2008; Wang et al., 2007).
The study area has been affected by two interplate megathrust earthquakes in the last 60 years. The 22 May 1960 ValdiviaMw9.5 earthquake ruptured >900 km of the Nazca‐South American plates interphase, from Arauco Peninsula (37.5°) to the Taitao (46.5°S; Moreno et al., 2009). It is the largest instrumentally recorded seismic event (Engdahl & Villasenõr, 2002). The epicenter took place beneath the Arauco Peninsula, spa- tially related with forearc strike‐slip crustal faulting (Lanalhue fault System, LFZ) that has been documented in the past decade (Haberland et al., 2006; Moreno et al., 2009; Figure 1). In turn, the 2010 MauleMw8.8 earthquake broke a ~500 km‐long portion of the subduction interphase, extending from 38.2 to 34°S (Moreno et al., 2012). The epicenter locates tens of kilometers north from the Arauco Peninsula (Figure 1), however the coseismic slip is distributed in two main patches, reaching a maximum slip in the northern part of 15.7 m (from GPS measurements; Moreno et al., 2012). Both epicenters locate ~200 and
~300 km to the WNW and NW of the center of our study area, respectively.
2.1. LOFS and ATF
The LOFS is a 1,200 km‐long intra‐arc dextral strike‐slip structure, characterized by master NNE‐striking dextral strike‐slip fault segments and subsidiary synthetic NE‐ to ENE‐striking transtensional faults (Cembrano & Hervé, 1993; Cembrano et al., 1996, 2000; Melnick, Folguera, et al., 2006,Melnick, Rosenau, et al., 2006). Regional to local‐scale transtensional domains, such as duplexes, releasing bends and horsetail geometries have been described (Pérez‐Flores et al., 2016; Potent, 2003; Rosenau et al., 2006; Figure 1) and evidenced by local transtensional seismic faulting (Legrand et al., 2010). In spatial association with these domains, subparallel diking, ENE‐striking volcanism, and hydrothermal activity is a common feature (Cembrano & Lara, 2009; Lara et al., 2008; Melnick, Folguera, et al., 2006; Rosenau et al., 2006; Sielfeld et al., 2017). Furthermore, tensional stress magnitudes can be larger where NE‐striking faults are close to, or intersect, master fault segments, which enhances long‐term crustalfluid pathways during interseismic tectonic loading conditions (Iturrieta et al., 2017). A significant portion of the bulk transpressional deforma- tion is accommodated by slip on the intra‐arc LOFS displaying markedly slip‐rates differences from north to south along different fault segments (Iturrieta et al., 2017; Rosenau et al., 2006; Stanton‐Yonge et al., 2016).
Calculated slip magnitudes from numerical models may be larger along pure strike‐slip fault segments, ran- ging from ~18 mm/year, close to southern LOFS termination (Iturrieta et al., 2017), down to 0.5 mm/year in the northern termination (Stanton‐Yonge et al., 2016; Figure 1). Thus, as a result of highly coupled plate interfaces, the forearc sliver motion, and thermal weakness at the intra‐arc region (Cembrano et al., 2002;
Wang et al., 2007), the overriding plate shows a variable degree of deformation partitioning along and across the Southern Andes (Arancibia et al., 1999; Lavenu & Cembrano, 1999; Pérez‐Flores et al., 2016; Rosenau et al., 2006). The LOFS records long‐term right‐lateral ductile deformation between 6 and 3 Ma (Cembrano et al., 2000) that is overprinted by dextral brittle deformation since 1.6 Ma (Lavenu &
Cembrano, 1999). Present‐day activity of this fault system is consistent with northward motion (6.5 mm/
year) of the forearc sliver (Wang et al., 2007) and available crustal seismic faulting (Figure 1). A compilation of focal mechanisms between −33 and −44°S shown in Figure 1, clearly document dextral strike‐slip
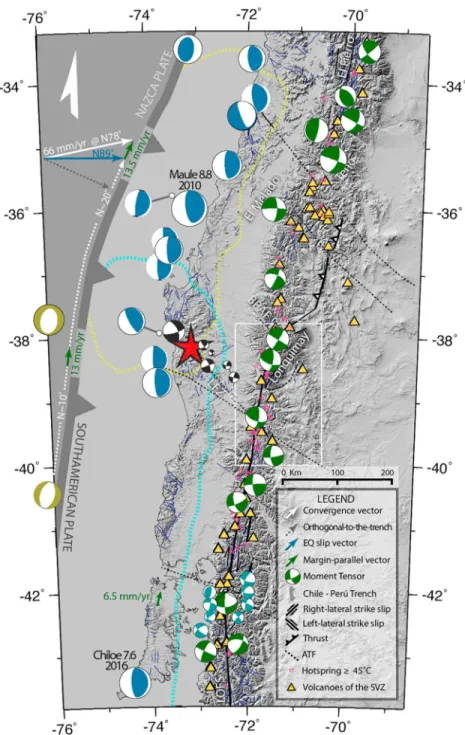
Figure 1.Seismotectonic map of the southern Andes. Convergence rate and direction is shown by the solid white vector (Angermann et al., 1999). Approximate coseismic rupture zones (slip>1 m) of the 1960 ValdiviaMw9.5 (epicenter in red star) and 2010 Maule (moment tensor in red‐white) megathrust earthquakes are outlined by cyan and yellow dashed lines, respectively (Moreno et al., 2009, 2012). Moment tensors of the gCMT catalog (www.globalcmt.org, 1976–2017) include (i) 13 subduction‐type earthquakes (blue‐white beach‐ballsMw> 6.5) ratifying the average slip accommodated in the subduction interphase; (ii) outer‐rise seismicityMw> 6.5 (beige‐white beach‐balls); (iii) crustal eventsMw≥5 and depth <20 km in green‐white beach‐balls. Crustal focal mechanisms from local deployments are shown in black‐white (Haberland et al., 2006) and light blue‐white (Lange et al., 2008). Focal mechanisms are scaled proportional to their moment magnitude (factor 0.4). Location of geothermal springs and stratovolcanoes taken from Hauser (1997), Risacher and Hauser (2008), and Siebert et al. (2010).
Crustal faults systems (LOFS, ATF) and morphotectonic lineaments from Melnick and Echtler (2006), Cembrano and Lara (2009), Lira et al. (2015) and Pérez‐Flores et al. (2016). Margin orthogonal and margin‐parallel components are schematized in dashed arrows. Average slip vector of subduction thrust earthquakes are indicated in blue. The expected residual margin‐parallel slip component is shown by green vectors (Stanton‐Yonge et al., 2016). The rectangle in white lines represent the area shown in Figures 6 and S1. Shaded relief image generated with 1 arc‐second (~30 m) resolution data from the Shuttle Radar Topography Mission.
AFT = Andean transverse faults; LOFS = Liquiñe‐Ofqui fault system; SVZ = Southern Volcanic Zone.
partitioning accommodated in the intra‐arc (Barrientos & Acevedo‐Aránguiz, 1992; Chinn & Isacks, 1983;
Lange et al., 2008; gCMT, http://www.gcmt.org).
ATF are WNW‐striking, long‐lived structures recognized as conspicuous morphotectonic lineaments and fault zones striking obliquely with respect to the overall Andean orogeny strike (~N10°E). ATFs are sug- gested to be older or coeval to the LOFS (e.g., Moreno et al., 2011; Pankhurst et al., 2006; Rivera &
Cembrano, 2000) and have been suggested to play a first‐order role in SW Gondwana Carboniferous‐ Permian basin evolution and the Carboniferous accretion of the Patagonian terrain (Breitkreuz, 1991;
Pankhurst et al., 2006; Rapela et al., 2003; Tankard et al., 1995). ATFs also have been thought to control the Neogene forearc basin architecture and megathrust rupture segmentation associated with the seismic subduction cycle (Glodny et al., 2008; Melnick et al., 2009). Furthermore, deformation of the ATFs might be activated from megathrust earthquakes (Aron et al., 2014; Arriagada et al., 2011; Farías et al., 2011;
Stanton‐Yonge et al., 2016), and may control crustal fluid migration within the intra‐arc region (Cembrano & Lara, 2009; Katz, 1971; Pérez‐Flores et al., 2016; Rivera & Cembrano, 2000; Roquer et al., 2017; Sánchez‐Alfaro et al., 2013; Sielfeld et al., 2017; Wrage et al., 2017).
2.2. Nature and Historical Record of Intra‐Arc Seismicity
In general, intra‐arc upper crustal seismicity sources are either pure tectonic or related to subvolcanic and volcanic processes (Zobin, 2003). Tectonic wave forms, in which this paper is focused, are characterized byPandSbody‐wave onsets; the largest reported magnitudes are of ~7.5(Mw)associated with the activation of long segments of arc‐parallel strike‐slip faults such as in Central America or in Sumatra (Reid, 1913;
White & Harlow, 1993). Intra‐arc volcanic seismicity, in turn, involves a wide spectra of low‐frequency (long‐period) quakes associated with subsurface to surface magmatic processes, that is, shear and tensile fail- ures within volcanic edifices, fluid pressurization, diking, volume changes, degassing, among others (Chouet, 2003; Manga & Brodsky, 2006; Zobin, 2003). For instance, the biggest recorded volcanic events are ~5.7Ml(e.g., in 1981 Mt. St. Helens eruptive cycle, and 1991 Mt. Pinatubo eruption; Mori et al., 1991).
Nonetheless, strong to mega tectonic earthquakes cause small static stress changes in the crust, which may perturb and potentially trigger eruptions at primed volcanoes (e.g., Mt Fuji's 1707 eruption, linked to M 8.7 Hoei earthquake at the Nankai megathrust; Chelsey et al., 2012).
Few and sparse local seismic networks in Southern Andes have reported shallow crustal seismicity (depth
<20 km) along several domains of the SVZ (e.g., Barrientos & Acevedo‐Aránguiz, 1992; Cardona et al., 2015; Farías et al., 2010; Mora‐Stock et al., 2012) and the LOFS (Agurto et al., 2012; Bohm et al., 2002;
Lange et al., 2008; Legrand et al., 2010). Several of the observed events are of magnitude 5 or greater, includ- ing twoMw6.1 andMw6.2 Aysen Fjord earthquakes in April 2007, associated with a strike‐slip duplex at the southern termination of the LOFS (e.g., Agurto et al., 2012; Legrand et al., 2010; Mora‐Stock et al., 2010); the strike‐slip El Melado 6.0(Mw)earthquake in the Maule region in June 2012 (indicated in Figure 1), spatially associated with the NS trending El Melado River Lineament (Cardona et al., 2015); and theMw6.5 Teno earthquake in August 2004, associated with dextral strike‐slip on El Fierro Fault (gCMT; Farías et al., 2010;
Figure 1). At Lonquimay volcano (38°22′S), one 5.3(Mw)earthquake on the 24th of February (1989) was recorded at 15 km depth 2 months after aflank cone eruption, (Strombolian“Navidad crater”eruption on 25 December 1988; Barrientos & Acevedo‐Aránguiz, 1992; Figure 1). Volcano‐tectonic events distribution and moment tensor of theMw5.3 quake (gCMT; Dziewonski et al., 1990) indicate right lateral strike‐slip faulting along the NNE‐striking Lolco Fault of the LOFS (Barrientos & Acevedo‐Aránguiz, 1992).
In contrast, sparse and small magnitude crustal earthquakes have been recorded along the ATFs. For instance, left‐lateral strike‐slip to compressive focal mechanisms (Haberland et al., 2006) were reported for the NW‐striking Lanalhue Fault Zone in the forearc region of southcentral Chile (LFZ; Figure 1;
Haberland et al., 2006; Melnick & Echtler, 2006). Further, south in the main Andes (41.5–43.5°S), Lange et al. (2008) observed seismic clusters associated with secondary NW left‐lateral strike slip faulting cross‐
cutting the LOFS close to stratovolcanoes, with focal mechanisms in line with the long‐term stressfields esti- mated from faults‐slip data inversions along the volcanic arc (Iturrieta et al., 2017; Lavenu &
Cembrano, 1999).
Similarly, at the northern termination of the LOFS, the strike‐slip Callaqui‐Alto Biobio earthquake (Mw=5.5) occurred on December 2006, close to a fault intersection. Tele‐seismically detected (Figure 1,
NEIC‐gCMT), the epicenter is located in between the NW‐striking Biobio‐Aluminé Fault and the NNE‐
striking Lolco‐Lomin Fault segment of the LOFS (Figure 1). Hypocenter uncertainty does not allow to cor- relate this event to either the LOFS or the Biobio‐Aluminé Fault. More importantly, all above‐mentioned events are compatible with overall ENE‐trending shortening, and NNW‐trending extension axes.
3. Data Processing and Methods
We deployed a passive seismic network of 34 stations between 2014 March and 2015 June (~16 months;
Figures 3 and S1). The local network consisted of eight broadband (Trilium 120) and 25 Mark L4‐3D 1 Hz three‐component sensors registering ground motion in continuous mode at a 100 Hz sample rate. All instru- ments were equipped with EarthDataLoggers (Text S1, Figures S2 and S3). Horizontal separation among the closest stations varies from 6 to 18 km, covering an area of ca. 200 by 100 km along the magmatic arc (38–40°S; Figure 3b, Table S1, and Figure S1). Homogenous and dense station‐separation allow detection localization of microseismicity for the entire zone. In order to assure constant operation in the high mountainous region, including through wintertime, stations were equipped with 90 W solar panels and 65 Ah deep‐cycle battery (Text S1 and Figures S2 and S3). Most stations ran continuously, other than two high‐altitude stations (>2,000 m above sea level) that shut down for approximately 3 weeks after heavy snowfall. To further densify the network, we incorporated continuous vertical seismograms of 16 permanent broadband stations of the Andes Volcanological Observatory (OVDAS), installed on main stratovolcanoes (Figure S1 and Table S1).
Crustal seismicity level in the region is very low; in fact, no event at all has been listed in the CSN (Centro Sismológico Nacional de Chile) catalog for that period. Therefore, we manually inspected the vertical records of the complete data set (16 months) using overlapping windows of 9 min with the Passcal Quick Look software. Then,PandSwaves onsets of local events with S‐P‐phase time differences of less than 10 s were manually picked. Overall, the detection and localization were optimized on the creation of a seis- micity catalog down to the smallest possible magnitude events. On averageS‐P‐phase time difference smal- ler than 3 s is characteristic for shallow quakes occurring within the study area (see waveform example in Figure 2). A small number of low and very low period events were detected, but not located; these are then not considered for further analysis. For a total of 652 detected events,PandSonsets were carefully identified using the software package SEISAN (Ottemöller et al., 2014). For each arrival we manually picked thefirst possible, the best and last possible arrival times. The error inPandSdetermination was then estimated by the differences between the first and last possible arrival time and was then converted into weights.
Furthermore, we pickedP‐phase polarities for the stronger events. After phase picking, we used the HYP program, SEISAN modified version of HYPOCENTER location program (Lienert et al., 1986; Lienert &
Havskov, 1995), as afirst and linear hypocenter determination approach. Thefinal catalog was selected upon the basis of epicentral distance smaller than 100 km from the network border and hypocentral misfits (RMS, root mean square) smaller than 1 s, from which the 96.9% has RMS smaller than 0.5 [s]. Thefinal catalog consists of 356 crustal events with 2,716P‐and 2,323S‐phase arrivals. The residual events, not considered here, belong mostly to interplate seismicity.
3.1. Construction and Validation of a Minimum One‐Dimensional Velocity Model
Travel times were used to compute one‐dimensional (1‐D) layered velocity models using VELEST program (Kissling et al., 1995). VELEST inverts 1‐D velocity models from phase arrival times, using an initial start‐up model (Kissling, 1988; Kissling et al., 1995). Generated results are 1‐DVpandVsvelocity models, station cor- rections (all delays are <|0.5|s), origin‐time and hypocentral coordinates (to,x,y,z). The following criteria were used for selecting 95 well‐constrained earthquakes as inversion input:
1. minimum of 8P‐and 4S‐phase arrivals;
2. observations within the network (greatest azimuthal gap (GAP)≤180°);
3. event residuals (RMS) smaller than 0.3 s.
We implemented a brute‐force search with a large number of plausibleVpinput models (124.000) and a con- stantVp/Vsratio of 1.78, in order tofind the minimum 1‐D velocity model with the smallest RMS (e.g., Lange et al., 2007, 2012). Then, we followed a staggered approach (Husen et al., 1999) using the bestVp model (i.e., with the smallest RMS) and 60 initial Vp/Vs ratios (inverting each 0.1 steps in the range
1.5 <Vp/Vs< 2.1) to determine a minimum 1‐DVsmodel. The best 1,000P‐and all (60)S‐velocity models are plotted in Figure 3, and compared to the minimum 1‐D Vpand Vs known for the entire forearc (Haberland et al., 2006). The minimum 1‐D Vp and Vp/Vs models are used to determine the final probabilistic hypocenter origin time, coordinates, and uncertainty (Lomax et al., 2000; http://alomax.free.
fr/nlloc/).
3.2. Hypocenter Determination and Moment Magnitudes
For thefinal hypocenter determination, we relocalized the seismicity with theNonLinLocprogram (Lomax et al., 2000). The program locates seismicity using a nonlinear Oct‐tree grid‐search approach, based on a probabilistic density function (PDF) for the inverse problem of spatial (x,y,z) and origin‐time (t) hypocenter localization (Moser et al., 1992; Tarantola, 1987; Tarantola & Valette, 1982; Wittlinger et al., 1993; for a com- plete description of the method refer to Text S2). The technic provides comprehensive uncertainty and reso- lution information. The errors in the observations (phase time picks) and in the forward problem (travel‐time calculation) are assumed to be Gaussian. This assumption allows the direct analytic calculation of a maxi- mum likelihood origin‐time given the observed arrival times and the calculated travel times between the observing stations and a point in thexyzspace. Thus, the 4‐D problem of hypocenter location reduces to a 3‐D search overx,y,zspace (Lomax et al., 2000). The Gaussian estimators and resulting confidence ellipsoid provide location uncertainties, in case the complete nonlinear PDF has a single maximum and has an ellip- soidal form. The maximum likelihood location is chosen as the preferred location. For each event, we esti- mated the three‐dimensional spatial confidence (68%) from 3‐D ellipsoidsfitted to 3‐D PDF scatter clouds.
Seismic moment(M0)as well as moment magnitude(Mw)were estimated for all events with more than four amplitude readings (265 events). The SEISAN AUTOMAG routine (Ottemöller et al., 2014; Ottemöller &
Havskov, 2003) use spectral analysis for making the attenuation and instrument corrected displacement spectrum. This analysis determines theflat spectral level and corner frequency for each record, from which the events seismic moment is calculated.
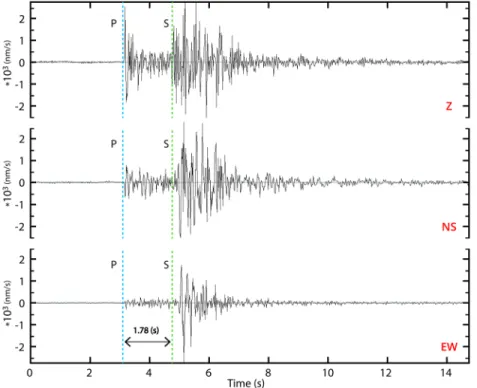
Figure 2.Raw waveform example of a typical crustal event (8.8 km depth,Mw= 1.4 on 18 June 2014, 20:04 UTC) recorded by station LS2S (Figure 3) at an 11.7 km epicentral distance. Vertical (Z) and horizontal components (NS and EW) are showing impulsivePandSphase arrivals. AS‐Ptime difference of 1.78 [s] indicates a short distance to the source (14.5 km with our velocity model).
3.3. Focal Mechanisms
Focal mechanisms yield information about the faulting style. The initial motion of thePwave depends on whether the ray left the source from a compressional (i.e., upwardfirst motion at the receiver), or dilatational quadrant (downwardfirst motion at the receiver), easier observed and picked in the vertical component of the receiver. Local events with high quality record, located inside the network (GAP≤180°) and with at least eightPand fourSwave onsets, and a maximum location misfit (RMS) of 0.3 s were considered. These events had depths ranging from 4 to 15 km and moment magnitudes between 1.5 and 3.4 (Table S2). Selected events were first analyzed with FPFIT program (Reasenberg &
Oppenheimer, 1985) which use take‐off angles (obtained from maximum likelihood hypocenters) to esti- mate the azimuth and take‐off angles at the hypocenter, and determines, from the Pwavefirst arrival polarities, the double coupled force equilibria of the source. In addition to Pwave polarities,S‐ toP‐ amplitude ratios provide constraints to the inversion of the source radiation pattern (Kisslinger, 1980).
Vertical maximumPandS wave (Pv and Sv) amplitudes were picked in the vertical channel. For each station, horizontalSwave maximum amplitude (Sh) were also picked in the synthetic rotated transverse‐ to‐the‐ray‐path channel. Take‐off angles,Pwave polarities, and the Sv/Pv, Sv/Sh and Sh/Pv amplitude ratios were used to compute double couple focal mechanisms using the FOCMEC program (Snoke et al., 1984). Finally, we compared solutions obtained from FPFIT and FOCMEC. We only accepted focal mechanism obtained with the FOCMEC approach, which do not differ significantly from the FPFIT solu- tions (less than 20° of difference in primary and auxiliary fault planes). A total of 36 events remained after the selection criteria.
Figure 3.(a) Computed 1‐DVpandVsvelocity models. Thick lines represent the minimum misfit 1‐DVpandVsmodels. The input range of theVpvelocity models is indicated by gray dashed lines. Dashed‐green lines indicate the minimumVpandVsvelocity model obtained for the forearc in this latitudinal range (Haberland et al., 2006). The right panel shows theVp/Vsratio. (b) Stations distribution andPandSwave station corrections corresponding to the minimum 1‐DVpandVs models. Station names are labeled. Reference station (Vpdelay = 0 s) is indicated with a black star (LS4S). Stratovolcanoes are indicated with pink triangles.
Villarrica volcano (Vi) is shown as reference for Figure 5.
4. Results
4.1. Nature, Magnitudes, and Temporal Distribution of Intra‐Arc Seismicity
Because of the dense station spacing and long‐time deployment, we mon- itored the volcanic arc crustal (micro)seismicity on a regional scale with very high resolution, for both detection and hypocentral coordinates.
Detection and location quality of the 356 crustal events is homogeneous throughout the study area with a magnitude completeness (Mc) ofMw
1.4. Events range fromMw0.6 toMw3.6. Figure 4 shows our datafitting the Gutenberg‐Richter (G‐T) relation for magnitudes equal or bigger than Mc. The estimatedbvalue for our experiment is of 1.11 with a maximum magnitude of 3.6 (Mw) in the forearc at 39 km of depth and 3.4 (Mw) in the intra‐arc at 9.4 km of depth.
The shallow intra‐arc 1‐D velocity structure (<9 km) is characterized by relatively lowPwave velocities (4.9 km/s in average) compared toVpesti- mations for the whole forearc from Haberland et al. (2006) (Figure 3).
However, below 9 km depth, P wave velocity increases rapidly to 6.2 km/s, demarking a high velocity transition depicted by a seismogenic zone (82% of localized seismicity lies between−1 and 14 km). From that depth down to 35 km, a steadily velocity increment up to 7.3 km/s is estimated. At 40 km depthVpreach 8.3 km/s andVp/Vsdrops from 1.82 to 1.59, demarking anotherfirst‐order velocity discontinuity. Deeper than 40 km velocities are poorly resolved because of limited ray coverage.
Altogether, our ~16‐month‐long (467 days) experiment recorded 356 crustal events covering an Earth sur- face area of 14,071 km2. The SAIAS catalog (Southern Andes Intra‐Arc Seismicity) is listed in Data Set S1.
Activity rate is of 0.762 events per day with an average magnitude of 1.25(Mw), as is shown in Figures 5a and 5b. Background level seismicity is characterized by scattered individual events or minor sequences (<4 events per day) commonly organized in clusters or alignments. Temporal distribution of seismicity (Figure 5a) depictsfive Andean transverse seismic sequences with more than 5 events per day, which are described later on this section. A total of 293 shallow crustal events are located within the intra‐arc region, completing the 82.3% of registered quakes. Our results yield to a total seismic moment of 9.7 × 10¹⁴[Nm] for the 16 months of continuous measurement (Figure 5c). This is equivalent to a daily seismic moment of 1.476 × 10⁸[Nm/km2] which equals a daily moment magnitude ofMw−0.62 units per square kilometer.
4.2. Spatial Distribution and Kinematics of Intra‐Arc Seismicity
Most reported intra‐arc events (78.8%) are spatially associated with morphostructural alignments, surface mapped faults, and/or ellipsoidal clusters (Figure 6a and Video S1). Seismicity follows the overall N10°E strike of the LOFS and volcanic front and is clustered as NE‐or NW‐striking ellipsoid domains or planes (Figures 6a–6c). The latter, which are hitherto unreported, reveal active deformation in unexpected, and some of them, populated areas. The remaining 21.2% localizes at shallow depth, spatially associated with stratovolcanoes and/or to geothermal features (e.g., 62 events occurred within Villarrica volcanic edifice).
Hypocenters beneath the main arc‐axis locate between−1 and 16 km. Depths are characterized by a bimodal distribution, defining two levels of relative higher activity: one at 9 ± 2 km and the other at 1 ± 1 km of depth (see histogram in Figure 6d). Within these depth ranges, relative large‐magnitude events tend to occur in the deeper level, whereas very shallow seismicity moment is weaker.
In contrast, within the forearc between latitudes 38.5 and 39.5°S, crustal hypocenters locate at significantly deeper‐crustal levels, reaching depths of up to 40 km (e.g., epicenters to the west of the Villarrica Lake in Figures 6a and 6c). In general, these events have larger uncertainties and locate outside of the network in areas of predominate 2‐D structure (such as a magmatic arc). However, local earthquake tomography studies in the forearc and intra‐arc regions between 39 and 40°S do not resolve significant lateral velocity changes for the upper crust (Dzierma, Rabbel, et al., 2012), so the minimum 1‐D velocity model with station correc- tions (Figure 2) is a good approximation of the 3‐D structure (Kissling, 1988). Therefore, we used maximal hypocenter depths from events close to our network (GAP<200) together with the more regional catalog Figure 4.Magnitude‐frequency histogram for the 265 events with calcu-
lated magnitudes of our catalog. Columns indicate number of events for each 0.2 units‐of‐magnitude bin. Crosses represent cumulative number of events per bin. Datafits the Gutenberg‐Richter distribution up to the mag- nitude of completeness (Mco), withbvalues close to 1.1.
from Dzierma, Thorwart, et al. (2012) to define the seismogenic layer bottom (SLB). Dzierma, Thorwart, et al. (2012) and Dzierma, Rabbel, et al. (2012; see for instance cross sections P1 and P2 in Figure 6 in Dzierma, Thorwart, et al., 2012) show how crustal seismicity observed in forearc locates much deeper than in the intra‐arc, describing a convex‐like distribution of events. On latitudinal cross‐section view (Figure 6c), hypocenters delineate a ~120‐km‐long convex geometry for the crustal SLB, which is shallower near the arc‐axis, where the LOFS and ATFs are found.
Moreover, intra‐arc seismicity can be organized into three geographic domains with distinctive geometrical patterns, as shown in Figures 7–9 and Video S1:
1. Northern domain (Figure 7, 37.9–38.8°S). This region contains 51 crustal events with small hypocenter uncertainties (±0.2, ±0.5, and ±0.4 km) in the NS, EW, and vertical components, respectively. From south to north, eight hypocenters locate on the north‐easternflank of Llaima Volcano and surrounding the Sierra Nevada (labeled Ll and SN in Figure 7), on a plausible NNW‐oriented cluster. Two focal mechanisms, including the 31 July 2014 (Mw= 3.4) event—the largest intra‐arc event recorded during the experiment—are coherent with a dominant strike‐slip setting with a NE‐trending maximum subhor- izontal shortening. TheMw3.4 event occurred at the eastern tip off an ENE‐oriented volcanicfissure in Figure 5.Temporal properties of the seismicity catalog. (a) Number of events per day. (b) Total daily moment magnitudes (Mw); events without magnitude are plotted in gray at 0.3 units. The experiment averageMwis indicated by a dashed blue line. (c) Cumulative seismic moment. Green line represents the eruption of Villarrica on 3rd of March 2015. Seismic sequences above the background natural seismicity level are highlighted with gray dashed lines and labeled in panel (a).
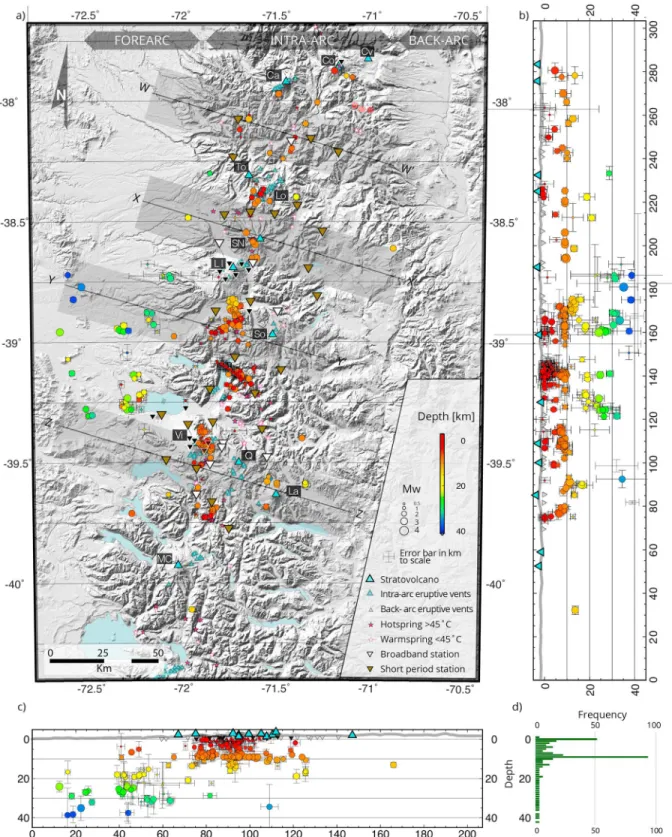
Figure 6.Southern Andes crustal seismicity. (a) Mapview of local seismicity. Hypocenter location uncertainties for each event are indicated with error bars. Main volcanic and geothermal features (Hauser, 1997; Sernageomin 2002) are plotted. Holocene stratovolcanoes: Callaqui (Ca), Copahue (Co), Caviahue Caldera (Cv), Tolhuaca (To), Lonquimay (Lo), Llaima (Ll), Sierra Nevada (SN), Sollipulli (So), Villarrica (Vi), Quetrupillán (Q), Lanín (La), and Mocho‐Choshuenco (MC).
Quaternary minor eruptive vents are tele‐detected and compiled in this study. Digital elevation model from STRM30 (https://lta.cr.usgs.gov/SRTM1Arc). Central traces of N74°W‐striking swath cross‐sections [W‐W′to Z‐Z'] presented in Figure 10 are indicated with black lines. Swath width to scale (gray bands).
(b) Longitudinal cross section along 71.5°W. Only events with distances of less than 120 km to the profile are shown. The gray line is the average topographic elevation from the DEM. (c) Like (b) but on a latitudinal cross section at 39°S. (d) Histogram (1 km bins) showing hypocenter depths.
the northeasternflank of Llaima Volcano. A single extensional focal mechanism is observed beneath the Sierra Nevada volcano summit. This solution indicates ENE‐oriented, steeply dipping normal fault planes, whose geometry is similar to that of the ENE‐striking dike swarm in Sierra Nevada western ridge (indicated as a narrow volcanicfissure in Figure 7). At Lonquimay Volcano (Lo in Figure 7), seismicity splits into two ~N20°E and N30°E striking bands, consistent with the northernmost branches of the LOFS (dashed blue lines in Figure 7; modified from Pérez‐Flores et al., 2016). These features occur along strike of prominent morphologic structures, as river incisions and aligned Holocene scoria cones (minor eruptive vents in Figure 7). Two computed focal mechanisms indicate strike‐slip and reverse faulting consistent with NE‐ to ENE‐striking horizontal compression axes, respectively. By integrating surface mapped fault traces and the distribution of hypocenters, ENE‐to NE‐oriented fault surfaces might dip steeply east, shaping a splay fault array at the northern termination of the LOFS.
2. Central domain (Figure 8, 38.8–39.3°S). In this segment, wefind oblique‐to‐the‐arc striking seismicity clusters, which we describe from south to north:
a NW‐oriented cluster alignment involving the Villarrica Lake (VL), the Villarrica Volcano (Vi), and the Lanin Volcano (La) individual ~NW oriented clusters (Figure 8a) is consistent with the trend of the LFZ (e.g., Haberland et al., 2006). Along this alignment, seismicity progressively deepens westward and east- ward away from the arc‐axis, dipping with an angle of ~30° in line with a rise of the SLB beneath the Figure 7.Crustal seismicity in the northern domain. The four events with centered black dots and absent uncertainty bars are from the seismicity catalog of Dzierma, Thorwart, et al. (2012). Events align along N~30°E oriented fault branches of the LOFS and long‐lived ATF (dashed when inferred; modified from Pérez‐Flores et al., 2016). The N30°W ATF Biobio‐ Aluminé fault is indicated with purple lines. MEV frequently are organized on ENE‐to NE‐oriented alignments.
ATF = Andean transverse faults; LOFS = Liquiñe‐Ofqui fault system; MEV = Multiple minor eruptive vents.
volcanic arc (latitudinal cross section of Figure 8b). Toward the west, the forearc hypocenters reach depths of up to ~40 km, whereas beneath stratovolcanoes, depths are less than 13 km. Toward the east, seismicity is sparser, but clearly deepens down to ~17 km, with the exception of one event at 35 (±12) km depth beneath the Lanin volcano. This observation (convex SLB in sectional view) is supported by 107 crustal events located by Dzierma, Thorwart, et al. (2012; events with centered black dots in Figures 8a and 8b). Crustal activity clearly splits from interplate seismicity constrained by Dzierma, Thorwart, et al. (2012) and Dzierma, Rabbel, et al. (2012) who describe a ~30° east‐dipping and ~20 km thick subducting slab geometry (Figure 8). In this overall NW‐striking cluster alignment, intense activity (46 events with Mw between 1.1 and 2.5) took place at ~9 km depth underneath the Villarrica Volcano (Figure 8c) from the 18th to the 23th of April—that is, 45 days after the 3rd of March 2015 Villarrica's strombolian eruption, represented as the green dashed line in Figures 5a and 5b. The NW‐oriented seismicity cluster and accompanying computed focal mechanism indicate a dominant sinistral strike‐slip regime with E‐W ± 20° oriented maximal horizontal shortening axis (Figure 8c).
b A N60°W‐striking microseismic sequence in the Caburgua Lake (Figure 9 and Video S2) reveals a subver- tical faulting process that took place within 03 successive marked steps. This is documented by peak activ- ity occurring on 13 to 15 November (~68 hr), 9 and 16 December 2014 (see temporal distribution in Figure 8.(a) Seismicity distribution of SAIAS catalog (with uncertainty bars) together with the regional catalog from Dzierma, Thorwart, et al. (2012; shown with- out uncertainty bars and centered‐black dots). Hypocenters in red denote crustal events, showing NW‐SE aligned clusters, for example, the Villarrica Lake [VL]‐Villarrica Volcano [Vi]‐Lanin Volcano [La] cluster alignment and Caburgua Lake sequence [Cb]. Geological and seismic features follow the same symbol criteria than Figure 7. (b) Latitudinal cross section with 25 km swath width to both sides. Vertical exaggeration is 0.5. Our data (events in colored dots with uncertainty bars) is confronted to the SFB‐Kiel project data from 2009 for the fore‐arc (events in colored dots and black centered dots). Crustal seismicity depicts an upwelling shape for the bottom of the crustal seismogenic layer (red dots) at a theoretical 300 °C isotherm (e.g., Scholz, 2002; Stesky, 1975). For reference, deeper events of Dzierma, Thorwart, et al. (2012) are plotted delimiting the interplate seismogenic zone (Wadati‐Benioff zone). A referential Mohorovicic discontinuity is outlined based on receiver functions (Yuan et al., 2006) and our local velocity model (white dashed line). (c) Inlet indicated in (a). Hypocenter distribution and computed focal mechanism for shallow events occurred within the Villarrica volcanic edifice—that is, a NW oriented cluster southeast of the summit and another sparse cluster north of the summit—and along major N10°E oriented fault branches of the LOFS. Note different depth color coding for panels (a) and (c).
Inlet of southernmost portion of Figure 9 is indicated. LOFS = Liquiñe‐Ofqui fault system.
Figure 5a). Hypocenters distribute at all depth between 9.9 and−1 km depth (i.e., hundreds of meters below the surface in the mountainous sector), being the two more frequent depths ranges: 9.2 to 8.6 km (n= 16) and 0.3 to −0.1 km (n= 28). Similar to the Villarrica Sequence, narrow seismic alignment and computed focal mechanism delineate a 20‐km‐long transpressional N60°W left‐lateral strike‐slip fault with E‐W ± 20° oriented maximum horizontal shortening axis (Figure 9).
c A N50°E‐striking elongated cluster at the north‐westernflank and basement of Sollipulli Volcano (here called“Sollipulli cluster”) occurs in close spatial relationship to main fumaroles and surface geothermal activity (Figure 9). A brief sequence, consisting of 11 NE‐aligned events, occurred from the 12th to the 15th of October 2014, with the greatest magnitude event of 1.9(Mw)on the 14th of November 2014 09:09:36.7 UTC. A single focal mechanism indicates strike‐slip faulting with N‐S oriented maximum hor- izontal shortening axis. In combination with the overall cluster geometry, this would indicate left‐lateral strike‐slip faulting in a N50E‐striking fault. Toward the north, deeper activity is clustered between 12 and 18 km in a NNW plunging cylinder‐like cluster. In this subdomain, cluster orientation can be associated with the LOFS. The latter activity occurring 13 km south from Llaima, and 14 km northwest from Sollipulli stratovolcano summits, has been also reported by OVDAS and analyzed by Mora‐Stock et al.
(2012). This cluster occurs beneath the town of Melipeuco, in the Allipén valley (indicated with pink dia- mond in Figure 9). Our computed focal mechanisms (n= 04) in this secondary cluster reveal predomi- nant strike‐slip, but also reverse (01 event) faulting with NE‐SW (03 events) to NW‐SE (01 event) shortening axes (Figure 9).
d In the Southern domain, between 39.5 and 40°S, events distribute along two ~20‐km‐long subparallel N10°E‐trending bands (Figure 8c). Hypocenters often coincide spatially with surface mapped master branches of the LOFS. A small N‐striking elongated cluster can be observed at Liquiñe (Figure 8c).
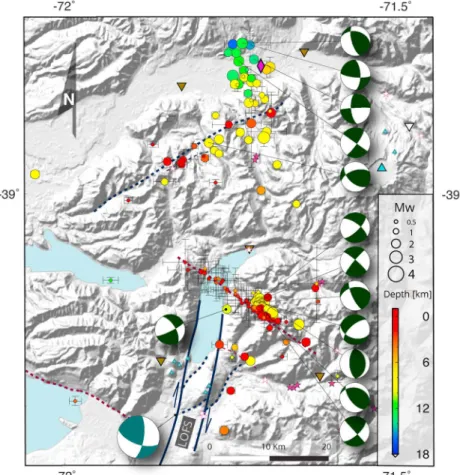
Figure 9.Close‐up map view with seismicity of the central domain (location of this map is shown in Figure 8a). Computed focal mechanisms are indicated in dark‐green and white, whereas moment tensors for theMw5.2 on 24 February 1989 at 15 km of depth (gCMT) is plotted in light‐green and white. The Melipeuco town is indicated with a pink diamond. Other symbols follow the same criteria as previousfigures. LOFS = Liquiñe‐Ofqui fault system.
Two focal mechanisms reported here suggest normal faulting, with NS striking fault planes solutions, or strike‐slip with north‐south oriented maximum subhorizontal shortening axis.
5. Discussion
In the south‐central Andes, along the LOFS northern termination, intra‐arc seismicity is a physical phenom- enon enabling the identification of current deformation/stress states and associated faulting. Intra‐arc seis- micity can clearly be discriminated from crustal forearc seismicity based on the following observations: (i) its shallowest typical hypocentral depth, ranging from approximately−0.2 to ~12 km (Figures 6b–6d, 8b, and 10); (ii) its predominant strike slip kinematics; and (iii) its geographical occurrence on or close‐to long‐term crustal faults (LOFS and ATF) and/or Quaternary eruptive centers and geothermal areas (see Figure 6 for regional context and Figures 7–9 for local spatial relations). In turn, forearc crustal seismicity is mostly loca- lized on ATF (e.g., Pichilemu Fault, Lanalhue Fault Zone) and might be continuous to the intra‐arc, as the LFZ follows the Vl‐Vi‐La NW‐striking seismic cluster alignment. This point will be further addressed later.
As it is widely accepted, thebvalue is a constant for the Gutenberg‐Richter (G‐T) relation that measures the ratio of large earthquakes over small ones. Therefore, thebvalue is related to the fractal dimension of fault- ing (e.g., Aki, 1981; Turcotte, 1997). Globally, thebvalue is frequently found between 0.8 and 1.2 for a wide variety of active tectonic regions (e.g., Utsu, 2002). Our estimates yield to abvalue of 1.11 (datafits the G‐T relation upMco; Figure 4), which is coherent with a tectonic origin of the intra‐arc seismicity. Additionally, the tectonic nature is confirmed by the dominant stick slip behavior of active intra‐arc faulting, deduced from clear and distinctive P and S wave onsets for most recorded events (Byerlee & Brace, 1968).
Recently, similarbvalues and faulting mechanism behavior have been documented for crustal seismicity in the pre‐cordillera of northern Chile (Salazar et al., 2017). Although, crustal composition, fluid presence/absence and crustal thickness might differ from northern to southern Chile, we can support that thefirst order control for crustal seismicity derives from tectonic forces associated with the overall oblique convergence setting.
5.1. The Frictional‐Plastic Transition in the Intra‐Arc Region
Based upon our observations, the thinner and shallower intra‐arc seismogenic zone of the SVZ may be the most favorable crustal domain to accommodate frictional strain in the overriding South American plate.
This is consistent with an earlier observation made by Barrientos et al. (2004) for Central Chile (33–35°S) indicating a higher rate of crustal seismicity within the arc, in comparison to the observed activity in the forearc and back‐arc regions. This idea may also be in harmony with an enhanced thermo‐mechanical weak- ness of a heated crust, as originally proposed (De Saint Blanquat et al., 1998; Fitch, 1972; Tikoff & Teyssier, 1994). Furthermore, because seismic velocities decrease with increasing temperature and deformation (Griffn & O'Reilly, 1987; Sibson, 1984, 2002), a heated and fractured crust might explain the relatively low velocity structure in the upper intra‐arc crust (Figure 3a) when it is compared to other 1‐D crustal velocity models calculated for Southcentral and Central Chile (Haberland et al., 2006; Lange et al., 2007). Thus, arc‐orthogonal geothermal gradients may significantly influence the brittle architecture of the overriding plate, enhancing faulting where the crustal seismogenic layer is thinner.
In quartzofeldespatic crust, greenschist metamorphism or quartz plasticity onsets at around ~300 °C (Stesky, 1975). This subsolidus crustal boundary marks an inflection point of crustal strength (Scholz, 1988; Sibson, 2002). Thus, in continental margins with an active volcanic arc, the vertical transition from a frictional faulting domain to quasi‐plastic shearing may be significantly deeper in regions tens of kilometers away from the arc axis. Moreover, in situ studies in northern Japan combining local seismicity and direct temperature measurements of geothermal‐boreholes in granitic crust indicate that the SLB in this region corresponds to the 380 °C isotherm (Suzuki et al., 2014). They correlate this temperature with depths for the thermal conduction/convection transition. Whereas the maximum strength zone would be consistent with the 340 °C isotherm, where the brittle‐ductile transition is defined (Suzuki et al., 2014). Based on our data, quasi‐plastic mechanical behavior of the crust would be expected for depths below the convex envelope of the crustal SLB, as seen in section (data in Figures 8b and 10 and schematized in Figure 11). This feature is conspicuous between latitudes 38.5 and 39.5°S where crustal seismicity is organized within a NW‐oriented seismic volume, consistent with the NW‐striking Lanalhue Fault (e.g., Haberland et al., 2006), NW‐aligned clusters (VL‐Vi‐La) and with the NW oriented Caburgua crustal seismic sequence (Figures 8a, 8b, and
Video S1). A similar shape of the SLB can be observed to the kilometric‐scale in active geothermalfields of northern Japan, where high resolution passive seismic mapping define local and abrupt shallowing of the SLB at very high geothermal gradients (Suzuki et al., 2014).
Similar crustal geometries have been observed for the Central Andes. For example, Farías et al. (2010) asso- ciated the west‐dipping hypocenter distribution in Central Chile (33–35°S) with the shape of the continental margin ~400 °C isotherm, which was earlier defined at a more regional scale by Yáñez and Cembrano (2004).
Farías et al. (2010) interpreted this structure as an east‐vergent, low angle thrust that would play a major role in the Andean mountain building. If this constitutes the main crustal architecture of the Chilean Southern Andes, the forearc seismicity should be decoupled from the intra‐arc seismicity and most of the hypocenters Figure 10.Cross‐sections (perpendicular to the Liquiñe‐Ofqui fault system and Southern Andes Volcanic Zone) showing the local seismicity, together with the regional earthquake catalog from Dzierma, Thorwart, et al. (2012). Location and swath of the profiles are shown in Figure 6. Local events are shown with uncertainties. Events close to the network (GAP≤200°) are indicated with color circles. Seismicity far outside the network (GAP > 200°, poor constraint depths) are shown in white circles, and are not used for interpretation. Events from the earthquake catalog from Dzierma, Thorwart, et al. (2012), and Dzierma, Rabbel, et al. (2012) are plotted as black circles. Stratovolcanoes are indicated with light‐blue triangles and seismic stations are shown with inverted triangles
(black = broadband, white = short‐period). Note that vertical and horizontal scales are equivalent. Slab geometry (gray line) inferred from interplate seismicity (Dzierma, Thorwart, et al., 2012) is dashed where no data is available and is projected from southernmost cross‐sections. Topographic relief is projected from SRTM 30 data. Northernmost swath cross‐section (W‐W′) is 20 km wide, whereas the other three (X‐X', Y‐Y′and Z‐Z') are 24 km wide.
should be distributed close to the base of the SLB. The observed seismicity should then define a low angle, west‐dipping seismogenic plane and dip‐slip focal mechanism would be expected. Nonetheless, activity in the forearc between 38.5 and 39.5°S (ATF) occur in a wide depth range (0–40 km; Figure 8b) and focal mechanisms are mostly strike‐slip (Haberland et al., 2006), indicating a prominent NW‐oriented Andean transverse deformation system. The latter could be defined as a NW‐oriented crustal volume that includes the Lanalhue Fault (Glodny et al., 2008; Haberland et al., 2006; Melnick et al., 2009), the VL‐Vi‐La seismic cluster alingment, and the Caburgua seismic sequence. If the upper crust is detached by a subhorizontal convex layer (e.g., SLB), then the partitioning would not show predominantly in the magmatic arc because the tectonic forces in the forearc would be accommodated close to the SLB and not in the whole brittle‐crust section, as it is revealed by ours and others seismic experiments (Dzierma, Thorwart, et al., 2012; Dzierma, Rabbel, et al., 2012; Haberland et al., 2006). So, what is the source, then, to the conspicuous observed strike‐slip faulting? We consider that the partitioning of convergence between subduction and strike‐slip movement of the forearc slivers constitute a simple and more straight‐ forward explanation to the observables and that the low angle detachment alternative is at least equivocal in this segment of the Andes (38–40°S).
Recent local seismicity studies in northern Chile forearc (Bloch et al., 2014; Salazar et al., 2017) demon- strated an analogue and marked convex shape of the SLB boundary around the West Fissure Fault System and Northern Chile volcanic arc. By contrasting hypocenters to heat‐flow density models, Salazar et al.
(2017) observed that crustal seismicity is clearly organized above the 350 °C isotherm (Springer, 1999).
The latter, down to ~60 km depth in the forearc‐slab boundary, progressively shallows up to ~15 km beneath the active volcanic front, describing a convex geometry in line with the maximum depth of crustal events. In turn, in the southern Central Andes (32–33.4°S), Nacif et al. (2017) show similar hypocentral depths beneath the volcanic front (<12 km). Integrating EHB Bulletin Catalog data, this author indicates also how foreland/back‐arc seismic activity locates progressively deeper to the east, down to reach the continental Figure 11.Conceptual model of crustal seismogenic layers along a magmatic arc. The cartoon includes high frictional strain domains (LOFS and ATF; olive‐gray volumes), where expected fault geometries and kinematics respond to the regional shortening axis (black vectors). Stratovolcanoes are represented with the red triangles. LOFS = Liquiñe‐Ofqui fault system; AFT = Andean transverse faults; SLB = seismogenic layer bottom.
Moho (~ 50 km depth), about ~550 km away from the trench. In contrast with Farías et al. (2010) interpreta- tion of an east‐vergence major crustal thrust, and in agreement with Salazar et al. (2017), we suggest that a first‐order control of the convexity and thinning of the SLB in Northern and Southern Chile volcanic arcs is related to a critical isothermal envelope limiting the frictional deformationfield in depth. The geometry of this rheological transition might be caused by thermal diffusion of active magmatic heat sources along the arc, independent of inherited fault geometries, but probably from fluid content and availability.
Additionally, reflection seismic studies in Northern Chile define two subparallel west‐dipping bright spots between 15 and 40 km of depth (Yoon et al., 2003, 2009). These structures are consistent in geometry and position with the SLB defined by Bloch et al. (2014) and Salazar et al. (2017), as well as with the 350 °C iso- therm (Springer, 1999). Toward the arc front, where activity is shallower (15–20 km depth) these structures have been correlated to the Altiplano low‐velocity zone, the one has been proposed to demark the brittle‐ plastic transition in this region (Wigger et al., 1994; Yuan et al., 2000). In summary, for the Southern Andes, the SLB might delineate a major rheological boundary between upper and midcrustal levels, simi- larly as was proposed by Koulakov et al. (2006) and Bloch et al. (2014) for the Andes orogeny in northern Chile. For this segment of the Andes, we assume that the SLB temperature should be within the temperature range of 300–380 °C, considering a quartzofeldespatic crust mainly formed by Tertiary granitoids and volcano‐sedimentary rock successions (refer to Figure S1).
However, the SLB shape might not only be controlled by the geothermal gradient, but by the strain rate and the presence of crustalfluids, diminishing rock strength to failure. Long‐term geologic data show that con- tinental margin high‐strain domains are mostly localized along the Miocene‐Present day volcanic arc and/or at long‐lived ATF (e.g., Cembrano & Lara, 2009; Glodny et al., 2008; Pérez‐Flores et al., 2016; Rosenau et al., 2006; among others). If the current strain rate is indeed higher in the volcanic arc domain, the SLB should be deeper than that of the forearc and foreland regions given a constant geothermal gradient, which is some- thing not supported by our data and that of previous work (e.g., Nacif et al., 2017; Salazar et al., 2017).
Therefore, although strain rate in the volcanic arc is higher, the effect of heatflux and associated higher geothermal gradient largely overcomes that of strain rate. ATF can provide key evidence in favor of the role of differential geothermal gradient on the depth of seismicity because they run across the forearc and arc regions. For instance, the maximum seismicity depth recorded along the strike of the LFZ goes from
~40 km in the forearc to ~12 km within the arc (Dzierma, Thorwart, et al., 2012; Haberland et al., 2006; in addition to our data). This strongly supports the hypothesis that differential geothermal gradient is onefirst order control on the maximum depth for seismicity on Andean crustal faults.
Regarding the influence of crustalfluids, it is well known their effect on reducing effective stresses and pro- moting failure. Regions with enhancedfluid pressure at all crustal levels will tend to have a deeper SLB. If fluid pressure is not evenly distributed with depth, the effects are difficult to generalize, because they will depend on local conditions. In the SVZ, there is widespread evidence for upper crustalfluidflow in the form of magma and/or hydrothermalfluids/hot springs (i.e., NE‐oriented electrical conductor; Brasse et al., 2008).
This would probably have an effect on enhancing faulting and seismic activity in the uppermost crust (~0– 2 km); effects at higher depths are difficult to constrain at regional scales. A local example of this, however, will be discussed when addressing crustalfluid‐related seismicity below.
5.2. Strain Partitioning and Compartmentalization
Intra‐arc seismicity provides fundamental insights on how transpressional deformation partitions, transfers, and compartmentalizes within the overriding plate. The results of our brief time‐window (~16 months) experiment, however, is reasonably consistent with most of the main tectonic features already documented through different approaches/methodologies (i.e., structural geology, numerical modeling, and geodetic stu- dies) on the long‐term pattern of crustal strain within intra‐arc regions. Tikoff and de Saint Blanquat (1997) have stated that syn‐magmatic strike‐slip partitioning may accommodate within margin‐parallel strike‐slip mylonitic and cataclastic domains. In turn, a combination of strike‐slip and reverse faulting in the forearc and foreland/back‐arc regions may accommodate both margin‐parallel and margin‐orthogonal components during one interseismic stage of the subduction earthquake cycle. However, few studies (La Femina et al., 2002; Lange et al., 2008; Pérez‐Flores et al., 2016; Salazar et al., 2017; Stanton‐Yonge et al., 2016), which include detailed observations, yield a more complex picture regarding the way by which the margin‐parallel component accommodates within the intra‐arc. In fact, it might be entirely accommodated by margin‐