Robert M. Graham1 , Stephen R. Hudson1 , and Marion Maturilli2
1Norwegian Polar Institute, Fram Centre, Tromsø, Norway,2Alfred Wegener Institute, Helmholtz Centre for Polar and Marine Research, Potsdam, Germany
Abstract
Here we evaluatefive atmospheric reanalyses in an Arctic gateway during late summer. The reanalyses include ERA5, ERA‐Interim, Japanese 55 year Re‐Analysis (JRA‐55), Climate Forecasting System Reanalysis‐version 2 (CFSv2), and Modern Era Retrospective analysis for Research andApplications‐version 2 (MERRA‐2). We use observations from 50 radiosondes launched in the Fram Strait around 79‐80°N, between 25 August and 11 September 2017. Crucially, data from 27 radiosondes were not transmitted to the Global Telecommunications System and therefore not assimilated into any reanalysis. In most reanalyses, the magnitude of wind speed and humidity errors is similar for profiles with and without data assimilation. In cases without data assimilation, correlation coefficients (R) exceed 0.88 for
temperature, wind speed, and specific humidity, in all reanalyses. Overall, the newly released ERA5 has higher correlation coefficients than any other reanalyses as well as smaller biases and root‐mean‐square errors, for all three variables. The largest improvements identified in ERA5 are in its representation of the windfield, and temperature profiles over warm water.
Plain Language Summary
The Arctic is undergoing rapid and ongoing changes. However, due to the harsh environment, there are relatively few observations from this region. To understand the drivers of these changes, we rely heavily on atmospheric reanalyses. Reanalyses are our best guess at the state of the atmosphere at a given time. Reanalyses are generated by assimilating all available atmospheric observations into a weather forecast model. A key question within the scientific community is how accurate reanalyses are in the Arctic. One problem with answering this question is that most observations used to test the performance of reanalyses were ingested in to the model and are therefore not an independent data set. Here we present a new set of balloon‐borne atmospheric observations from the Fram Strait, between Svalbard and Greenland. Many of these data were not assimilated in to any reanalyses, providing a rare opportunity to evaluate their performance in this important Arctic gateway. We testfive products, including the newly released ERA5 from the European Centre for Medium Ranged Weather Forecasting. All products simulate the temperature, humidity, and windfields well, even without data assimilation. Overall, the newly released ERA5 performs best, with the largest improvements in the wind and temperaturefields.1. Introduction
Atmospheric reanalyses are widely used for documenting and interpreting ongoing changes within the Arctic system (Stroeve & Notz, 2018). For example, recent studies have used atmospheric reanalyses to show that an increased number of winter storms, and associated moisture intrusions, is contributing to the rapid warming of the Arctic (Graham et al., 2017; Moore, 2016; Rinke et al., 2017; Woods & Caballero, 2016).
Moisture intrusions transport pulses of warm and moist air from the midlatitudes into the Arctic, resulting in an enhanced downward longwave radiativeflux (Graham et al., 2017; Johansson et al., 2017; Messori et al., 2018; Woods et al., 2013; Woods & Caballero, 2016). It has been suggested that this enhanced down- ward longwaveflux could explain up to 50% of the reduced winter sea ice concentration in the Barents and Kara Seas (Park et al., 2015). However, the relationship between warmer winter temperatures, increased radiativefluxes, and sea ice growth is complex (Stroeve et al., 2018).
Our understanding of both the causes and magnitude of ongoing changes in the Arctic is crucially dependent on the quality of atmospheric reanalyses. Several studies have evaluated the performance of various reana- lyses in the Arctic, comparing simulated variables to observations fromfield campaigns and meteorological stations (Boisvert et al., 2018; Bromwich et al., 2016; Engström et al., 2014; Graham, Rinke, et al., 2017;
©2019. The Authors.
This is an open access article under the terms of the Creative Commons Attribution‐NonCommercial‐NoDerivs License, which permits use and distri- bution in any medium, provided the original work is properly cited, the use is non‐commercial and no modifica- tions or adaptations are made.
Key Points:
• In situ Arctic observations: 27 atmospheric profiles from radiosondes in Fram Strait (August–Septmber 2017) were not transmitted to GTS
• ERA5 simulates observed atmospheric profiles more accurately than ERA‐Interim, JRA‐55, CFSv2, and MERRA‐2
• Largest improvements are found in ERA5 for wind and temperature profiles over warmer eastern Fram Strait
Correspondence to:
S. R. Hudson,
stephen.hudson@npolar.no
Citation:
Graham, R. M., Hudson, S. R., &
Maturilli, M. (2019). Improved performance of ERA5 in Arctic gateway relative to four global atmospheric reanalyses.Geophysical Research Letters,46. https://doi.org/10.1029/
2019GL082781
Received 11 MAR 2019 Accepted 17 MAY 2019
Accepted article online 23 MAY 2019
Jakobson et al., 2012; Lindsay et al., 2014; Naakka et al., 2018; Tjernstöm & Graversen, 2009; Walsh et al., 2009; Wesslén et al., 2014). A key limitation of these studies is that data from thefield campaigns or stations were often assimilated into the reanalysis, which the observations are then used to evaluate (Jakobson et al., 2012; Wesslén et al., 2014). Hence, the observations are not truly independent, even if the observed para- meters (e.g., precipitation, clouds, or radiativefluxes) were not themselves assimilated.
Jakobson et al. (2012) evaluatedfive reanalyses in the Arctic using measurements from the Tara drifting ice station (25 April to 31 August 2007), where no observations were transmitted to the Global Telecommunications System (GTS). Without any data assimilation, correlation coefficients between the Tara data and several reanalyses were found to be low over sea ice (Jakobson et al., 2012). Tjernstöm and Graversen (2009) also evaluated reanalyses with observations from the 1998 Surface Heat Budget of the Arctic (SHEBA) experiment. In this case, data were transmitted to GTS and assimilated. However, by using the analysis increment they were able to determine the impact of data assimilation and concluded that this reduces the near surface warm bias in the earlier European Centre for Medium Range Weather Forecasting (ECMWF) reanalysis, ERA40, by 50% (Tjernstöm & Graversen, 2009).
In this study, we use radiosonde observations from two cruises in the Arctic to evaluatefive global atmo- spheric reanalyses, including the newly released ECMWF reanalysis, ERA5. The cruises took place in the eastern and western Fram Strait during August–September 2017 (Figure 1). Interestingly, data from the radiosondes launched during one cruise, primarily in the western Fram Strait, were not transmitted to GTS and therefore not assimilated into any reanalysis. In contrast, observations from the second cruise in the eastern Fram Strait were assimilated. We use these two data sets to provide insights on how well atmo- spheric reanalyses perform in this important Arctic gateway, with and without data assimilation.
2. Methods
2.1. Observations
From 25 August to 11 September 2017, the Norwegian Polar Institute's Research Vessel, R/V Lance, con- ducted a hydrographic transect from Svalbard to Greenland along approximately 79°N (Figure 1). The cruise serviced several ocean moorings in the western Fram Strait, across the cold southward flowing East Greenland Current (de Steur et al., 2009). Radiosondes were launched from the ship daily at 11 UTC, or twice daily at 11 UTC and 23 UTC. Twenty seven radiosondes were launched in total (Graham et al., 2019). No data from the radiosondes or ship were transmitted to GTS.
During the same period, from 25 August to 6 September 2017, Alfred Wegener Institute's icebreaker Polarstern conducted a cruise in the eastern Fram Strait. This region is influenced by the warm northward flowing West Spitsbergen Current (Figure 1). During the cruise, 23 radiosondes were launched from the ship either daily at 11 UTC, or twice daily at 04:30 UTC and 11 UTC (Schmithüsen, 2017b). The average distance separating Polarstern and Lance was approximately 330 km.
Data from the radiosondes launched on Polarstern were transferred without delay to GTS to contribute to global weather forecasts and for assimilation into reanalyses (Schmithüsen, 2017b). Importantly, one may expect reanalyses to perform less well for the radiosondes launched from R/V Lance, regardless of whether observations were assimilated, due to the influence of Greenland's complex topography as well as the colder ocean temperatures and occasional ice cover in the western Fram Strait (Figure 1).
Vaisala RS92‐SGPL radiosondes were used on both cruises. These measured temperature and relative humidity directly. Specific humidity was retrieved using the formula of Hyland and Wexler (1983). Wind speed and direction were determined from the radiosondes GPS position. The data were logged and pro- cessed using the DigiCora program from Vaisala.
2.2. Reanalyses
We use the radiosonde observations from Lance and Polarstern to evaluatefive global atmospheric reana- lyses. These include ERA5, ERA‐Interim (ERA‐I), the Japanese 55 year Re‐Analysis (JRA‐55), the Modern Era Retrospective analysis for Research and Applications‐version 2 (MERRA‐2), and the National Center for Environmental Prediction's Climate Forecasting System Reanalysis‐version 2 (CFSv2).
10.1029/2019GL082781
Geophysical Research Letters
ERA‐I has a horizontal resolution of approximately 79 km. There are 60 vertical model levels, from the sur- face to 0.1 hPa. The data assimilation system is based on the 2006 release (Cy31r2) of the ECMWF Integrated Forecasting System (IFS), which includes a four‐dimensional variational analysis (4D‐Var; Dee et al., 2011).
ERA5 was released in 2017 and will soon replace ERA‐I. The horizontal resolution of ERA5 is approximately 31 km, and there are 137 model levels up to 0.01 hPa. The assimilation system used is the IFS Cy41r2 4D‐
Var (https://confluence.ecmwf.int//pages/viewpage.action?pageId=74764925).
JRA‐55 is produced with the TL319 version of Japan Meteorological Agency's operational data assimilation system and includes 4D‐Var (Harada et al., 2016; Kobayashi et al., 2015). JRA‐55 has a horizontal resolution of approximately 55 km and 60 model levels up to 0.1 hPa.
MERRA‐2 is produced with version 5.12.4 of the Goddard Earth Observing System (GEOS5.12.4) atmo- spheric data assimilation system, which uses GSI and 3D‐Var (Bosilovich et al., 2015). The model has a hor- izontal resolution of 0.5° latitude × 0.625° longitude, and 72 model levels up to 0.01 hPa.
CFSv2 is produced using the National Centers for Environmental Prediction Global Forecasting System (GFS) atmospheric model and the Grid point Statistical Interpolation (GSI) analysis system with 3D‐Var.
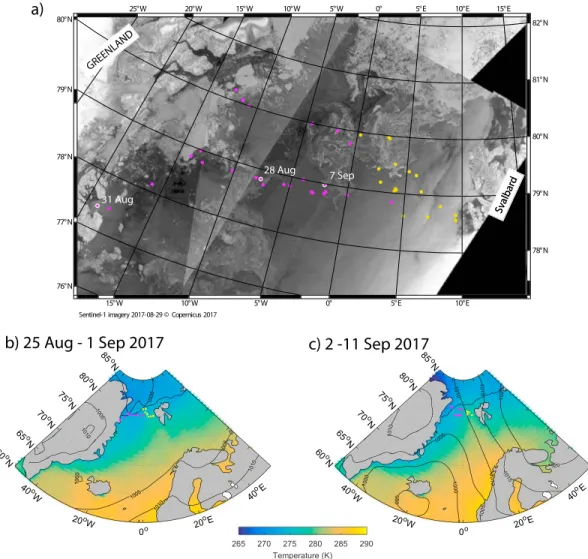
Figure 1.Overview map of the observations. (a) Copernicus Sentinel‐1 image of the Fram Strait on 29 August 2017 (Torres et al., 2012). (b) Synoptic map for thefirst half of the observation period (25 August to 1 September), based on ERA‐I. Mean sea level pressurefield (hPa) is given by the black contours and 2‐m air temperature (K) is shown in color. Sea ice edge (15% concentration) from ERA‐I is shown by the black line. (c) Same as (b) but for the second half of the observation period (2–11 September 2017). Locations of radiodondes launched from R/V Lance (no Global Telecommunications System) and Polarstern (transmitted to Global Telecommunications System) are shown in magenta and yellow, respec- tively. The date and location of the three case studies from Figure 4 are highlighted in white in panel (a).
CFSv2 has a horizontal resolution of approximately 38 km (T382) and 64 vertical levels, up to 0.2 hPa (Saha et al., 2010, 2014).
We compare the reanalyses with the observed profiles by selecting the 00 UTC, 06 UTC, or 12 UTC analysis that corresponds with the approximate time each radiosonde completed its ascent through the troposphere.
For each profile, we use the nearest reanalysis grid point to the location of the ship at the radiosonde launch time, on the original reanalysis grid. We evaluate the reanalyses to a height of 500 hPa. While the number of model levels differs in each reanalyses, all products provide output interpolated on to standard pressure levels. These levels have 25 hPa spacing at the surface (1,000 hPa), rising to 50 hPa at 700 hPa. There are 16 levels below 500 hPa. We average the radiosonde observations on to these pressure levels using a ±10‐ hPa window.
3. Results
3.1. Synoptic Overview
Thefirst half of the observation period (25 August to 1 September 2017) was characterized by relatively stable and settled weather conditions in the Western Fram Strait (Figure 1b). R/V Lance observed low wind speeds (typically < 5 m/s) at the surface, and temperatures between +1°C and‐5°C. Cold and calm condi- tions prevailed between 28 August and 2 September, and we observed new ice forming around Lance at the time radiosondes were launched (not shown). In the eastern Fram Strait, near‐surface air temperatures at Polarstern ranged from +6 to‐5°C, and the mean wind speed was 8 m/s (Schmithüsen, 2017a). Winds at Polarstern were typically directed from the south. However, from 28 August to 31 August, winds were direc- ted from the north bringing subzero temperatures and occasional sea ice from 30 August to 31 August (3%
concentration; Schmithüsen, 2017a).
The latter part of the observation period (2–11 September) was characterized by strong south‐easterly winds (typically >7 m/s). This was due to an area of high pressure that built in the Barents Sea, east of Svalbard, and a deepening low pressure to the south of Iceland (Figure 1c). Over this time period, two storm systems passed northward through the Fram Strait. The peak wind speed observed by Polarstern was 19 m/s (130°) on 7 September, and air temperatures ranged from‐2 to 11°C (Schmithüsen, 2017a).
The ice concentration remained low in the Fram Strait during August–September 2017 (Figure 1). Some sea ice was present in the vicinity of R/V Lance for several of the radiosondes launched between 28 August and 7 September (Figures 1b and 1c). However, the ice concentration was typically below 20%. Sea ice was occa- sionally present around Polarstern in the eastern Fram Strait, between 30 August and 6 September, with a maximum ice concentration of 6% (Schmithüsen, 2017a).
3.2. Performance of Reanalyses
Overall, thefive reanalyses simulate the mean radiosonde profiles well in the eastern and western Fram Strait (Figures 2 and 3). Mean correlation coefficients (R) between the observations and reanalyses range from 0.93 to 0.98 for temperature, 0.77 to 0.94 for wind speed, and 0.88 to 0.94 for specific humidity (Table 1). In each reanalysis, the variable with the lowest correlation coefficient is the relative humidity, which range from 0.76 to 0.87 (Table 1). The poorer performance of relative humidity is to be expected.
While temperature and specific humidity are assimilated into reanalyses directly from global meteorological observations, relative humidity is not assimilated but calculated from the simulated temperature and specific humidity at each grid point in the reanalysis. Small errors in the simulated temperature and specific humid- ity can therefore contribute to larger errors for the relative humidity.
ERA5 simulates the mean radiosonde profiles launched from R/V Lance and Polarstern more accurately than any other reanalysis (Table 1 and Figures 2 and 3). Specifically, for both cruises, ERA5 has the highest correlation coefficient and smallest root‐mean‐square error (RMSE) for all four variables. The vertically averaged absolute biases in ERA5 are also the lowest for every variable, except relative humidity. JRA‐55 has the smallest relative humidity biases (Table 1). The largest RMSEs are typically found in CFSv2 or MERRA‐2 (Table 1), both of which use 3D‐Var rather than 4D‐Var data assimilation.
Reanalyses are known to simulate temperature inversions poorly in the Arctic (Cullather et al., 2016;
Graham, Rinke, et al., 2017; Naakka et al., 2018; Tjernstöm & Graversen, 2009; Wesslén et al., 2014).
10.1029/2019GL082781
Geophysical Research Letters
During summertime, temperature inversions below 800 hPa most frequently form over the Arctic Ocean in response to the advection of warm and moist air above the cold ocean surface (Naakka et al., 2018). Hence, we would expect tofind stronger and more frequent temperature inversions in the western Fram Strait, where the sea surface is colder, compared with warmer waters in the east. In all reanalyses, the largest RMSEs for temperature are found below 800 hPa, and RMSEs are larger in the western Fram Strait compared with the east (Figures 2a and 3a). Most reanalyses suffer from a small cold bias or warm bias at the surface, and larger cold bias between 975 to 850 hPa, (Figures 2a and 3a). This pattern is consistent with reanalyses underestimating the strength of temperature inversions. The smaller RMSEs in the eastern Fram Strait likely reflect the less frequent occurrence of temperature inversions here and thus cannot be attributed solely to the effects of data assimilation. Interestingly, the performance of ERA5 and ERA‐I below 800 hPa in the colder western Fram Strait is similar (Figure 2a), suggesting that there is limited improvement in the representation of temperature inversions in ERA5. The largest cold biases are found in JRA‐55, at 950 hPa, for both R/V Lance and Polarstern (Figures 2a and 3a).
While thefive reanalyses capture the shape of the mean wind profile in the eastern and western Fram Strait, RMSEs are relatively large (Figures 2b and 3b). ERA5 has the smallest wind speed biases and RMSEs among all reanalyses (Table 1). Above 700 hPa, all reanalyses suffer from negative wind speed biases for both cruises, and RMSEs range from 1.2 to 3.2 m/s (Figures 2b and 3b). The RMSE in ERA5 is approximately 0.6 m/s lower than ERA‐I, at these levels. In the cold western Fram Strait, ERA‐I and CFSv2 have difficulties simulating low level wind jets (Figure 2b). CFSv2 substantially overestimates the strength of these jets, while ERA‐I underestimates the strength (see case study).
The largest improvements for any variable wefind in ERA5, over ERA‐I, is the wind speed (Table 1). ERA5 has higher correlation coefficients, smaller biases, and smaller RMSEs than ERA‐I at every pressure level in the eastern and western Fram Strait (Figures 2b and 3b). These improvements in the representation of the windfield can likely be explained by the higher vertical resolution of ERA5 (137 model levels), compared with ERA‐I (60 levels) and the other reanalyses (60‐72 levels).
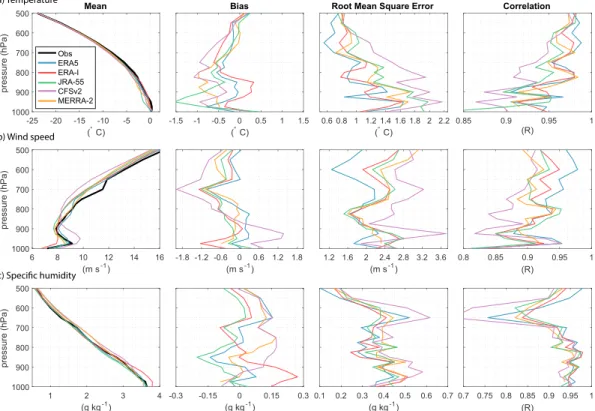
Figure 2.Mean, bias, root‐mean‐square error, and correlation coefficient (R), for the 27 profiles launched in the western Fram Strait from R/V Lance (magenta dots in Figure 1). (a) Temperature, (b) wind speed, and (c) specific humidity. Observations are shown in black and reanalyses in colors (see legend). Data from these radiosondes was not transmitted to Global Telecommunications System and therefore not assimilated in to any reanalyses.
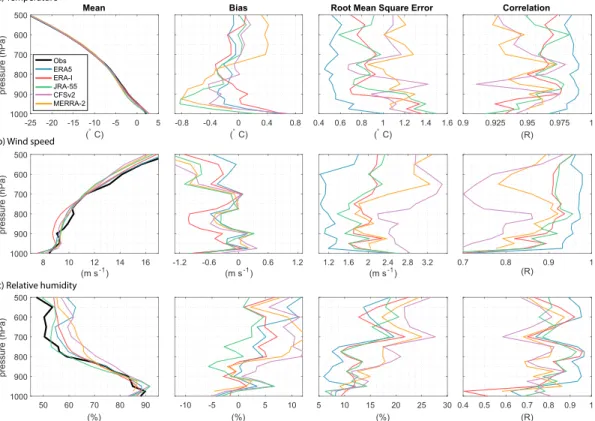
Figure 3.Mean, bias, root‐mean‐square error, and correlation coefficient (R), for the 23 radiosondes launched in the eastern Fram Strait from Polarstern (yellow dots in Figure 1). (a) Temperature, (b) wind speed, and (c) relative humidity. Observations are shown in black and reanalyses in colors (see legend). Data from these radiosondes was transmitted to Global Telecommunications System and assimilated in to the reanalyses.
Table 1
Performance of Reanalyses
Variable Reanalysis
Correlation (R) Bias Root‐mean‐square error
R/V Lance Polarstern R/V Lance Polarstern R/V Lance Polarstern
Temperature (°C) ERA‐I 0.96 0.96 0.3 0.2 1.1 0.9
ERA5 0.96 0.98 0.3 0.2 1.0 0.6
JRA‐55 0.94 0.96 0.6 0.3 1.4 1.0
MERRA‐2 0.95 0.95 0.5 0.4 1.2 1.1
CFSv2 0.93 0.95 0.6 0.2 1.5 1.0
Wind speed (m/s) ERA‐I 0.91 0.89 0.5 0.6 2.2 2.0
ERA5 0.93 0.94 0.3 0.3 1.9 1.3
JRA‐55 0.91 0.90 0.5 0.4 2.2 1.9
MERRA‐2 0.91 0.86 0.4 0.5 2.3 2.3
CFSv2 0.88 0.77 0.9 0.5 2.7 2.8
Relative humidity (%) ERA‐I 0.79 0.79 5 3 13 13
ERA5 0.83 0.87 5 4 13 11
JRA‐55 0.77 0.82 4 3 14 13
MERRA‐2 0.81 0.76 6 6 15 17
CFSv2 0.74 0.76 7 7 17 17
Specific humidity (g/kg) ERA‐I 0.94 0.92 0.1 0.1 0.4 0.4
ERA5 0.94 0.94 0.1 0.1 0.3 0.3
JRA‐55 0.93 0.91 0.1 0.1 0.4 0.4
MERRA‐2 0.92 0.88 0.1 0.2 0.4 0.5
CFSv2 0.91 0.88 0.1 0.1 0.4 0.5
10.1029/2019GL082781
Geophysical Research Letters
There is a prominent moist bias in ERA‐I below 900 hPa in western Fram Strait (R/V Lance), compared with the other reanalyses (Figure 2c). A near‐surface summertime moist bias in ERA‐I has been identified using several Arctic data sets (Jakobson et al., 2012; Lüpkes et al., 2010; Naakka et al., 2018; Wesslén et al., 2014).
Reassuringly, this bias is not present in ERA5. However, the RMSE in ERA5 is only 0.1 g/kg smaller than ERA‐I (Figure 2c and Table 1). There is a large spread in the magnitude and sign of specific humidity biases among reanalyses, but the RMSEs (0.3‐0.5 g/kg) are all relatively consistent (Figure 2c and Table 1).
Interestingly, the RMSEs are similar for each reanalyses when comparing the Lance and Polarstern radio- sondes, despite no data assimilation from Lance. It is possible that the performance of the reanalyses at Lance was enhanced by its relative proximity to the radiosonde observations assimilated from Polarstern and those from weather stations at Danmarkshavn and Ny‐Ålesund (Naakka et al., 2018).
For both cruises, wefind a sharp decrease in the correlation coefficient for the specific and relative humidity around 700‐600 hPa, in all reanalyses (Figures 2c and 3c). Typically, the RMSEs also increase at this level.
Over the Arctic Ocean, specific humidity and relative humidity inversions often coincided above 800 hPa (Naakka et al., 2018). These inversions usually form by differential specific humidity advection. It has pre- viously been shown that ERA‐I and JRA‐55 do not simulate these features well, likely due to errors in the windfield and the lower vertical resolution at upper levels (Naakka et al., 2018). It is interesting that we identify similar problems here in ERA5, despite its higher vertical resolution and smaller wind speed errors compared with other reanalyses (Figures 2c and 3c).
3.3. Case Studies
The shape of the mean atmospheric profiles agrees well between the reanalyses and observations (Figures 2 and 3), and there is often a good match for the individual profiles. However, on several occasions, many rea- nalyses miss features observed by the radiosondes. Here we highlight three examples from R/V Lance, where no data were assimilated into reanalyses (Figure 1a).
On 28 August, at the time of the 12 UTC radiosonde launch, new thin‐ice was forming around Lance and there were patches of fog at the surface. Above the fog, skies were initially clear, but conditions soon changed to overcast. The observed temperature and humidity profiles resemble a cloud‐topped planetary boundary layer, with the cloud‐driven mixed layer decoupled from a shallow stably‐stratified surface layer (Figure 4a). A surface temperature inversion extends up to 975 hPa, representing a stably stratified surface layer. A second inversion associated with a possible cloud layer is also visible between 875 and 825 hPa.
However, the relative humidity across the second inversion is below 100% (75%), reflecting the clear‐sky conditions at the time of launch. No reanalysis simulates a surface temperature inversion at this time (Figure 4a). Furthermore, no reanalysis simulates a temperature inversion or cloud at the 875‐ to 825‐ hPa level. Instead, each reanalysis has a shallow mixed layer at the surface. ERA5, ERA‐I, and JRA‐55 simulate a lifted inversion with a base height of 975 hPa in ERA‐I and ERA5 and 925 hPa in JRA‐55.
These inversions are associated with cloud layers (Figure 4a). In contrast, CFSv2 and MERRA‐2 do not simulate inversions or clouds at any level. These differences in cloud properties between the reanalyses will have a major implication for the quality of surface radiativefluxes (Walsh et al., 2009). Due to the poor representation of temperature and specific humidity inversions, all reanalyses have warm and dry biases at 875 hPa. In addition, the observations reveal collocated specific and relative humidity inversions at 750 and 600 hPa (Figure 4a). ERA5 and MERRA‐2 simulate these inversions at 750 hPa, albeit with a large moist bias in MERRA‐2. However, the inversions at 600 hPa are missed by all reanalyses. All rea- nalyses are too moist above 800 hPa.
The radiosonde at 12 UTC on 7 September was launched during stormy conditions, with strong winds and rain observed on R/V Lance. The radiosonde profile reveals a surface based temperature and specific humid- ity inversion that extends to 900 hPa (Figure 4b). All reanalyses simulate these inversions. However, the inversions are typically too weak and/or shallow. As a result, most reanalyses are too warm and moist near the surface and too cold and dry aloft (Figure 4b). The observed relative humidity profile indicates a substan- tial cloud layer, extending from the surface to approximately 700 hPa. Above 700 hPa, there is a sharp reduc- tion in specific and relative humidity. All reanalyses are too moist above 700 hPa, and in several products clouds extend above 700 hPa. In JRA‐55 the cloud top is at 775 hPa. The observations reveal a collocated spe- cific and relative humidity inversion at 600 hPa, which no reanalyses capture (Figure 4b).
The radiosonde on 7 September observed a low level jet at 975‐950 hPa, with a maximum wind speed of 23 m/s (Figure 4b). All reanalyses simulate this feature at the correct level, but the jet is typically too weak. The peak wind speed ranges from 20 m/s in ERA5 and MERRA‐2 to 15 m/s in ERA‐I (Figure 4b). In contrast, CFSv2 substantially overestimates the strength and depth of the jet, with a peak wind speed of 27 m/s.
Interestingly, ERA5 resolves this feature more accurately than ERA‐I. ERA5 also has smaller specific humid- ity errors than ERA‐I; the strength of the surface temperature inversion is more accurate in ERA‐I (Figure 4b).
We consider a further case on 31 August where a lifted temperature inversion was observed (Figure 4c). The inversion had a base of 900 hPa and an inversion top at the 825 hPa level. Interestingly, ERA‐I clearly simulated the shape of the temperature profile more accurately than ERA5, and the other reanalyses (Figures 4c and 4d).
ERA5 and JRA‐55 simulate the inversion base too low, and the inversion is too weak (Figure 4c). In contrast, MERRA‐2 simulates a much deeper and stronger inversion that extends down to 950 hPa, while CFSv2 has a well‐mixed boundary layer (Figure 4c). In the observations, the inversion coincides with local maxima in spe- cific and relative humidity (Figure 4c). Hence, this elevated temperature inversion is likely associated with a cloud layer and cloud radiative cooling. ERA‐I, ERA5, and JRA‐55 all simulate a cloud layer below 850 hPa.
Notably, ERA‐I, which simulated the most accurate temperature profile, has the highest cloud fraction at this level among all reanalyses. In contrast, cloud layers are absent in CFSv2 and MERRA‐2 (Figure 4c). MERRA‐2 simulates a shallow mechanically driven surface based mixed layer, overlain by a deep temperature inversion with warm air over the cold Arctic waters off the east Greenland coast. In contrast, CFSv2 has a much deeper mixed layer. These differences may be caused by the fact that CFSv2 has a distinct warm bias at the surface, while MERRA‐2 has cold bias when compared with the observations and other reanalyses (Figure 4c).
4. Discussion and Conclusions
In this study, we evaluate the performance offive atmospheric reanalyses in the Fram Strait, an important Arctic gateway. The reanalyses include ERA5, ERA‐I, JRA‐55, MERRA‐2, and CFSv2. We use observations from 50 radiosondes launched during two cruises from 25 August to 11 September 2017. Data from 27 Figure 4.Profiles of temperature, wind speed, specific humidity, relative humidity and simulated cloud water (liquid and ice) content for three case studies. (a) 28 August, (b) 7 September, and (c) 31 August. Observations are shown in black and reanalyses in colors (see legend). Note there are no observations of cloud water content. Locations of radiosonde launches are highlighted in white in Figure 1. Data from these radiosondes was not transmitted to GTS and therefore not assimi- lated in to any reanalyses.
10.1029/2019GL082781
Geophysical Research Letters
radiosondes launched on a cruise in the western Fram Strait were not transmitted to the GTS, and therefore not assimilated in to any reanalyses, providing a rare independent Arctic data set.
All reanalyses capture the shape of the mean temperature, wind speed, and specific humidity profiles well.
For profiles without data assimilation, mean correlation coefficients still exceed 0.88 for all three variables.
The performance of reanalyses during this period of late summer in the Fram Strait is strong compared with other regions of the Arctic and seasons (Bromwich et al., 2016; Jakobson et al., 2012; Lindsay et al., 2014;
Naakka et al., 2018; Wesslén et al., 2014). For example, Jakobson et al. (2012) compare ERA‐I with observa- tions of the lowest 890 m of the atmosphere from the Tara drifting ice station (25 April to 31 August 2007), from which no data were assimilated in to reanalyses. They found correlation coefficients of 0.74 for tem- perature, 0.71 for the wind speed, and 0.54 for the specific humidity. In contrast, wefind mean values below 925 hPa in the western Fram Strait of 0.93, 0.88, and 0.95 for temperature, wind speed, and specific humidity, respectively. Nonetheless, we would expect reanalyses to perform better for these lower latitudes and more oceanic setting, because reanalyses are known to perform poorly over Arctic sea ice (Cullather et al., 2016;
Graham, Rinke, et al., 2017; Kayser et al., 2017; Naakka et al., 2018). Interestingly, our RMSEs for wind speed in the Fram Strait are large compared with previous studies and exceed values from Tara (2.0‐2.5 m/s versus 1.8 m/s; Jakobson et al., 2012). This may reflect the higher wind speeds observed in Fram Strait.
Overall, ERA5 performs best among all thefive reanalyses, for the temperature, wind speed, and specific humidity, with the highest correlation coefficients, smallest biases, and smallest RMSEs. Temperature errors over warmer waters in the eastern Fram Strait are substantially smaller in ERA5 compared with the other reanalyses. However, wefind little improvement in the representation of temperature inversions over cold water in ERA5. In several cases, ERA‐I simulates surface based and lifted temperature inversions more accu- rately than ERA5. Notably, we identify a reduction in the summertime moist bias over cold Arctic waters in ERA5 relative to ERA‐I, but RMSEs are of similar magnitude. The clearest improvement in ERA5 is for the windfield. RMSEs for the wind speed are lower in ERA5 compared with all other reanalyses below 900 hPa and above 700 hPa, and similar to the other reanalyses between these levels. Mean wind speed biases and RMSEs are also smaller in ERA5 than ERA‐I and correlation coefficients higher at every level. In particular, ERA5 simulates low level jets more accurately than any other reanalyses. The improved representation of low level jets and reduced near‐surface specific humidity bias in ERA5 will likely increase the accuracy of the moisture transport through this important Arctic Gateway, relative to ERA‐I. The higher vertical resolu- tion of ERA5 likely contributes to its improved representation of the windfield.
For most reanalyses, wind speed and humidity errors are of a similar magnitude in the eastern and western Fram Strait, despite no data assimilation in the west. The performance of temperature is stronger in all rea- nalyses in the east. However, this likely reflects a lower frequency of poorly resolved temperature inversions over warmer waters in the eastern Fram Strait, rather than an improvement from data assimilation.
Given the limited temporal and spatial size of these data sets, caution must be taken about making strong conclusions on the performance of reanalyses in the wider Arctic, particularly for other times of year and different synoptic conditions.
Data Availability
Radiosonde observations from R/V Lance are available through the Norwegian Polar Institute's database (https://doi.org/10.21334/npolar.2019.8d3ed413). Radiosonde observations from Polarstern Cruise PS108 (ARK‐XXXI/3) were downloaded from PANGAEA (https://doi.pangaea.de/10.1594/PANGAEA.882916).
Reanalysesfiles for ERA‐I, ERA5, JRA‐55, and CFSv2 were downloaded from the National Center for Atmospheric Research's data archive (rda.ucar.edu). MERRA‐2files were downloaded from NASA's Earth Data archive (earthdata.nasa.gov/).
References
Boisvert, L. N., Webster, M. A., Petty, A. A., Markus, T., Bromwich, D. H., & Cullather, R. I. (2018). Intercomparison of precipitation estimates over the Arctic Ocean and its peripheral seas from reanalyses.Journal of Climate,31(20), 8441–8462. https://doi.org/10.1175/
JCLI‐D‐18‐0125.1
Bosilovich, M., Akella, S., Coy, L., Cullather, R., Draper, C., Gelaro, R., et al. (2015). MERRA‐2: Initial evaluation of the climate.NASA/TM‐
2015‐104606/Vol. 43, NASA Technical Report Series on Global Modeling and Data Assimilation,43(September), 139. https://doi.org/
NASA/TM‐2015‐104606/Vol.43 Acknowledgments
We thank Marius Bratrein and Jürgen
“Egon”Graeser for their help in setting up the AWI radiosonde receiving station on R/V Lance. We also thank all members of the crew from R/V Lance and Polarstern. R. M. G. was supported by the Norwegian Polar Institute's Centre for Ice, Climate and Ecosystems (ICE) through the N‐ICE project. This work was further supported by the German Academic Exchange Service (DAAD) and PPP Norway. The cruise with R/V Lance was the 2017 cruise (FS2017) for the Norwegian Polar Institute's long term monitoring pro- ject:“The Fram Strait Arctic Outflow Observatory”(http://www.npolar.no/
en/projects/fram‐strait‐arctic‐outflow‐
observatory.html). Support for the cost of radiosondes launched from R/V Lance was provided by ICE and the Arktis 2030 program of the Ministries of Foreign Affairs and Climate and Environment of Norway, through the project ID Arctic.
Bromwich, D. H., Wilson, A. B., Bai, L. S., Moore, G. W. K., & Bauer, P. (2016). A comparison of the regional Arctic System Reanalysis and the global ERA‐Interim Reanalysis for the Arctic.Quarterly Journal of the Royal Meteorological Society,142(695), 644–658. https://doi.
org/10.1002/qj.2527
Cullather, R., Hamill, T. M., Bromwich, D., Wu, X., & Taylor, P. (2016). Systematic Improvements of Reanalyses in the Arctic (SIRTA). A White Paper. Retrieved from http://www.iarpccollaborations.org/uploads/cms/documents/sirta‐white‐paper‐final.pdf
de Steur, L., Hansen, E., Gerdes, R., Karcher, M., Fahrbach, E., & Holfort, J. (2009). Freshwaterfluxes in the East Greenland Current: A decade of observations.Geophysical Research Letters,36, L23611. https://doi.org/10.1029/2009GL041278
Dee, D. P., Uppala, S. M., Simmons, A. J., Berrisford, P., Poli, P., Kobayashi, S., et al. (2011). The ERA‐Interim reanalysis: Configuration and performance of the data assimilation system.Quarterly Journal of the Royal Meteorological Society,137(656), 553–597. https://doi.org/
10.1002/qj.828
Engström, A., Karlsson, J., & Svensson, G. (2014). The importance of representing mixed‐phase clouds for simulating distinctive atmo- spheric states in the Arctic.Journal of Climate,27(1), 265–272. https://doi.org/10.1175/JCLI‐D‐13‐00271.1
Graham, R. M., Cohen, L., Petty, A. A., Boisvert, L. N., Rinke, A., Hudson, S. R., et al. (2017). Increasing frequency and duration of Arctic winter warming events.Geophysical Research Letters,44, 6974–6983. https://doi.org/10.1002/2017GL073395
Graham, R. M., Hudson, S. R., & Maturilli, M. (2019). Fram Strait 2017 atmospheric profiles from radiosondes [Data set]. Norwegian Polar Institute. Retrieved from. https://data.npolar.no/dataset/8d3ed413‐2753‐406e‐8392‐8fbd44272463
Graham, R. M., Rinke, A., Cohen, L., Hudson, S. R., Walden, V. P., Granskog, M. A., et al. (2017). A comparison of the two arctic atmo- spheric winter states observed during N‐ICE2015 and SHEBA.Journal of Geophysical Research: Atmospheres,122, 5716–5737. https://
doi.org/10.1002/2016JD025475
Harada, Y., Kamahori, H., Kobayashi, C., Endo, H., Kobayashi, S., Ota, Y., et al. (2016). The JRA‐55 Reanalysis: Representation of atmospheric circulation and climate variability.Journal of the Meteorological Society of Japan Series II,94(3), 269–302. https://doi.org/10.2151/jmsj.2016‐015 Hyland, R. W., & Wexler, A. (1983). Formulations for the thermodynamic properties of the saturated phases of H2O from 173.15 K to 473.15
K.ASHRAE Transactions,89, 500–519
Jakobson, E., Vihma, T., Palo, T., Jakobson, L., Keernik, H., & Jaagus, J. (2012). Validation of atmospheric reanalyses over the central Arctic Ocean.Geophysical Research Letters,39, L10802. https://doi.org/10.1029/2012GL051591
Johansson, E., Devasthale, A., Tjernström, M., Ekman, A. M. L., & L'Ecuyer, T. (2017). Response of the lower troposphere to moisture intrusions into the Arctic.Geophysical Research Letters,44, 2527–2536. https://doi.org/10.1002/2017GL072687
Kayser, M., Maturilli, M., Graham, R. M., Hudson, S. R., Rinke, A., Cohen, L., et al. (2017). Vertical thermodynamic structure of the tro- posphere during the Norwegian young sea ICE expedition (N‐ICE2015).Journal of Geophysical Research: Atmospheres,122, 10,855–10,872. https://doi.org/10.1002/2016JD026089
Kobayashi, S., Ota, Y., Harada, Y., Ebita, A., Moriya, M., Onoda, H., et al. (2015). The JRA‐55 reanalysis: General specifications and basic characteristics.Journal of the Meteorological Society of Japan Series II,93(1), 5–48. https://doi.org/10.2151/jmsj.2015‐001
Lindsay, R., Wensnahan, M., Schweiger, A., & Zhang, J. (2014). Evaluation of seven different atmospheric reanalysis products in the arctic.
Journal of Climate,27(7), 2588–2606. https://doi.org/10.1175/JCLI‐D‐13‐00014
Lüpkes, C., Vihma, T., Jakobson, E., König‐Langlo, G., & Tetzlaff, A. (2010). Meteorological observations from ship cruises during summer to the central Arctic: A comparison with reanalysis data.Geophysical Research Letters,37, L09810. https://doi.org/10.1029/
2010GL042724
Messori, G., Woods, C., & Caballero, R. (2018). On the drivers of wintertime temperature extremes in the high arctic.Journal of Climate, 31(4), 1597–1618. https://doi.org/10.1175/JCLI‐D‐17‐0386.1
Moore, G. W. K. (2016). The December 2015 North Pole Warming Event and the increasing occurrence of such events.Scientific Reports, 6(1), 39084. https://doi.org/10.1038/srep39084
Naakka, T., Nygård, T., & Vihma, T. (2018). Arctic humidity inversions: Climatology and processes.Journal of Climate,31(10), 3765–3787.
https://doi.org/10.1175/JCLI‐D‐17‐0497.1
Park, D.‐S. R., Lee, S., & Feldstein, S. B. (2015). Attribution of the recent winter sea‐ice decline over the Atlantic sector of the Arctic Ocean.
Journal of Climate,28(10), 4027–4033. https://doi.org/10.1175/JCLI‐D‐15‐0042.1
Rinke, A., Maturilli, M., Graham, R. M., Matthes, H., Handrof, D., Cohen, L., et al. (2017). Extreme cyclone events in the Arctic: Wintertime variability and trends.Environmental Research Letters,12(9). https://doi.org/10.1088/1748‐9326/aa7def
Saha, S., Moorthi, S., Wu, X., Wang, J., Nadiga, S., Tripp, P., et al. (2014). The NCEP climate forecast system version 2.Journal of Climate, 27(6), 2185–2208. https://doi.org/10.1175/JCLI‐D‐12‐00823.1
Saha, S., Moorthi, S., Pan, H., Wu, X., Wang, J., Nadiga, S., et al. (2010). The NCEP Climate Forecast System Reanalysis.Bulletin of the American Meteorological Society,91, 1015–1058. https://doi.org/10.1175/2010BAMS3001.1
Schmithüsen, H. (2017a). Meteorological observations during POLARSTERN cruise PS108 (ARK‐XXXI/3). Alfred Wegener Institute, Helmholtz Center for Polar and Marine Research, Bremerhaven, PANGAEA,. https://doi.org/10.1594/PANGAEA.882623 Schmithüsen, H. (2017b). Upper air soundings during POLARSTERN cruise PS108 (ARK‐XXXI/3). Radiosondes PS108_40078‐
PS108_40100. PANGAEA Dataset. https://doi.org/10.1594/PANGAEA.882916
Stroeve, J., & Notz, D. (2018). Changing state of Arctic sea ice across all seasons Changing state of Arctic sea ice across all seasons.
Environmental Research Letters,13(10). https://doi.org/10.1088/1748‐9326/aade56
Stroeve, J., Schroder, D., Tsamados, M., & Feltham, D. (2018). Warm winter, Thin ice?The Cryosphere Discussions, 1–26. https://doi.org/
10.5194/tc‐2017‐287
Tjernstöm, M., & Graversen, R. G. (2009). The vertical structure of the lower Arctic troposphere anlaysed from observations and the ERA‐
40 reanalysis.Quarterly Journal of the Royal Meteorological Society,133, 937–948. https://doi.org/10.1002/qj
Torres, R., Snoeij, P., Geudtner, D., Bibby, D., Davidson, M., Attema, E., et al. (2012). GMES Sentinel‐1 mission.Remote Sensing of Environment,120, 9–24. https://doi.org/10.1016/j.rse.2011.05.028
Walsh, J. E., Chapman, W. L., & Portis, D. H. (2009). Arctic cloud fraction and radiativefluxes in atmospheric reanalyses.Journal of Climate,22(9), 2316–2334. https://doi.org/10.1175/2008JCLI2213.1
Wesslén, C., Tjernström, M., Bromwich, D. H., De Boer, G., Ekman, A. M. L., Bai, L. S., & Wang, S. H. (2014). The Arctic summer atmo- sphere: An evaluation of reanalyses using ASCOS data.Atmospheric Chemistry and Physics,14(5), 2605–2624. https://doi.org/10.5194/
acp‐14‐2605‐2014
Woods, C., & Caballero, R. (2016). The role of moist intrusions in winter Arctic warming and sea ice decline.Journal of Climate,29(12), 4473–4485. https://doi.org/10.1175/JCLI‐D‐15‐0773.1
Woods, C., Caballero, R., & Svensson, G. (2013). Large‐scale circulation associated with moisture intrusions into the Arctic during winter.
Geophysical Research Letters,40, 4717–4721. https://doi.org/10.1002/grl.50912
10.1029/2019GL082781